Software Development
18 minutes reading time

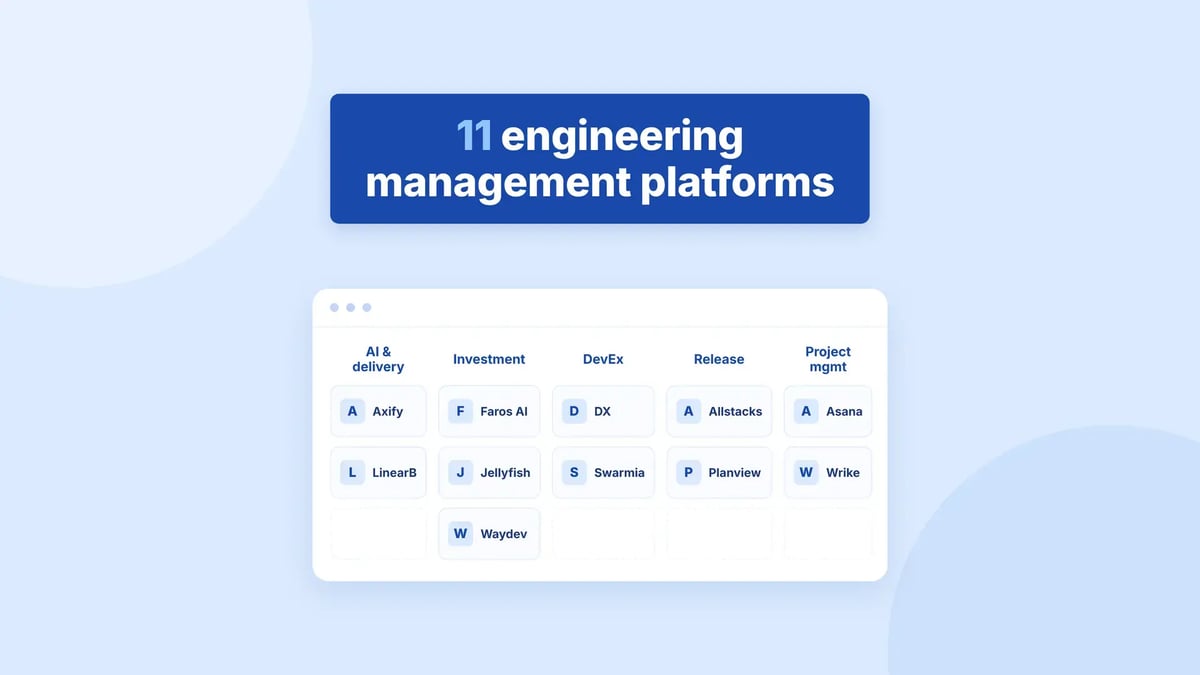
In our experience, engineering leaders rarely struggle because they lack data. They struggle because delivery metrics, AI adoption, engineering capacity, and business priorities are spread across different systems. That makes it hard to see what is actually slowing delivery or where teams need support. Only 28% of organizations say their software development tools are fully integrated with shared data and workflows, according to GitLab's 2026 research.
An engineering management platform brings that data together, so you can measure delivery performance, find bottlenecks, understand team capacity, and connect engineering work with business outcomes without manual reports or disconnected dashboards.
In this guide, we'll discuss:
Let's get started!
An engineering management platform is software that connects data from your engineering tools (source control, issue tracking, CI/CD, and AI coding assistants) to show how work flows, where it slows down, and whether engineering effort matches business priorities.
Project management tools help you plan and assign tasks. An engineering management platform measures what happens once the work starts: cycle time, review time, deployment frequency, AI usage and cost, and where engineering time goes.
| Tool | Category | Best For | Starting Price |
| Axify | AI adoption and delivery intelligence | Engineering leaders tracking AI usage, cost, and impact | $29 per active contributor/month, billed annually |
| LinearB | AI adoption and delivery intelligence | AI workflow automation | $29 per user/month, billed annually |
| Jellyfish | Engineering investment and business alignment | Executive resource allocation and R&D reporting | Quote-based |
| Faros AI | Engineering investment and business alignment | Enterprise engineering ROI modeling | Quote-based |
| Waydev | Engineering investment and business alignment | Resource planning and cost capitalization | Quote-based |
| DX | Developer experience | Developer experience measurement | Custom pricing |
| Swarmia | Developer experience | DevEx and AI tool signals | Free up to 9 developers; Standard $45 per developer/month |
| Planview Release (formerly Plutora) | Release and delivery management | Release management | Custom pricing |
| Allstacks | Release and delivery management | Predictive delivery management | $400 per contributor/year (Growth) |
| Wrike | General project management with engineering use cases | Engineering workflows | Free plan available |
| Asana | General project management with engineering use cases | Engineering planning | Free plan available |
Before comparing individual platforms, it helps to separate them by use case. Some tools focus on AI adoption and delivery intelligence, while others are better for investment planning, developer experience, release management, or general project coordination.
The platforms below are grouped into five categories, so you can compare them based on the decision you need to make.
This category fits teams that need to understand whether AI tools are improving delivery or adding hidden risk. These engineering management platforms connect AI adoption with delivery performance, cost, code activity, and engineering outcomes.
Axify and LinearB are the main options in this category.
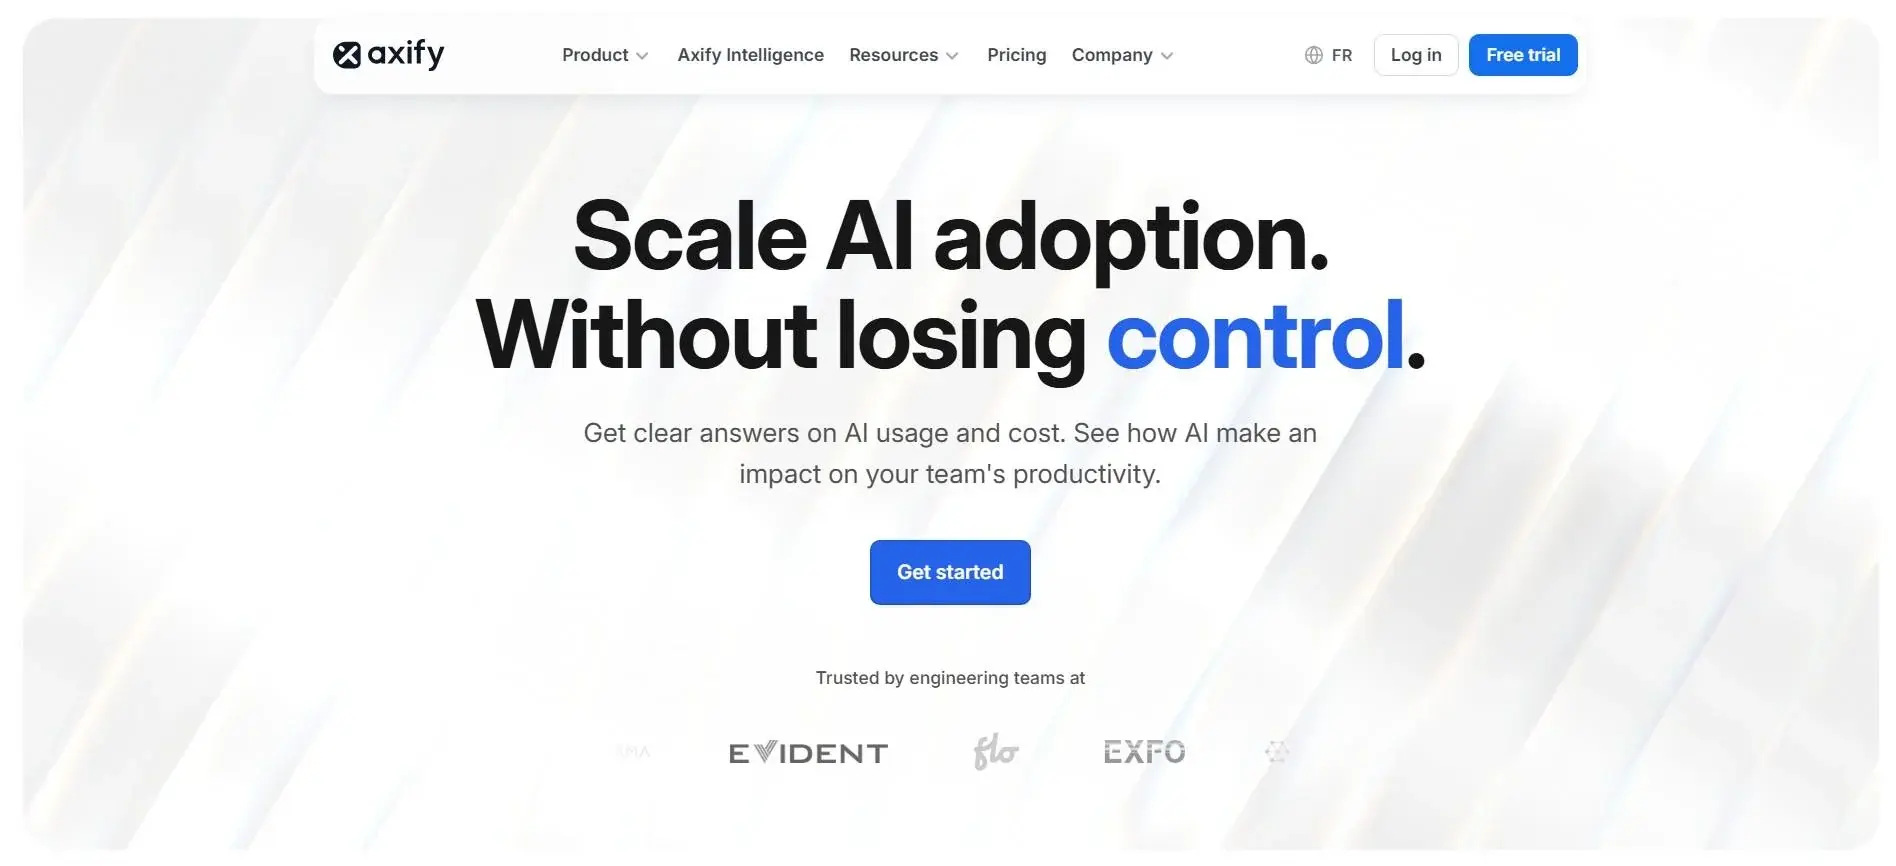
Axify is an engineering management platform for software organizations that need one place to review AI usage, AI impact, AI cost, and delivery performance. It integrates with Jira, Azure DevOps, GitHub, GitLab, Bitbucket, and AI coding tools such as GitHub Copilot, Cursor, and Claude Code, so you can understand what is helping or slowing your delivery flow. It can also suggest solutions based on your engineering data and allows you to implement them directly.
With Axify, you can:
Measuring the full delivery flow is what reveals the real bottlenecks. For example, Newforma used Axify to deliver 22X more often and reduce lead time for changes by 63% over five months.
Downside: Axify works best when your engineering team already uses connected delivery tools. If you need a basic task management system, a general project management tool may be enough.
Pricing: $29 per active contributor per month, billed annually, with a 14-day free trial (no credit card required). Enterprise pricing is custom. See Axify pricing.
Source: LinearB
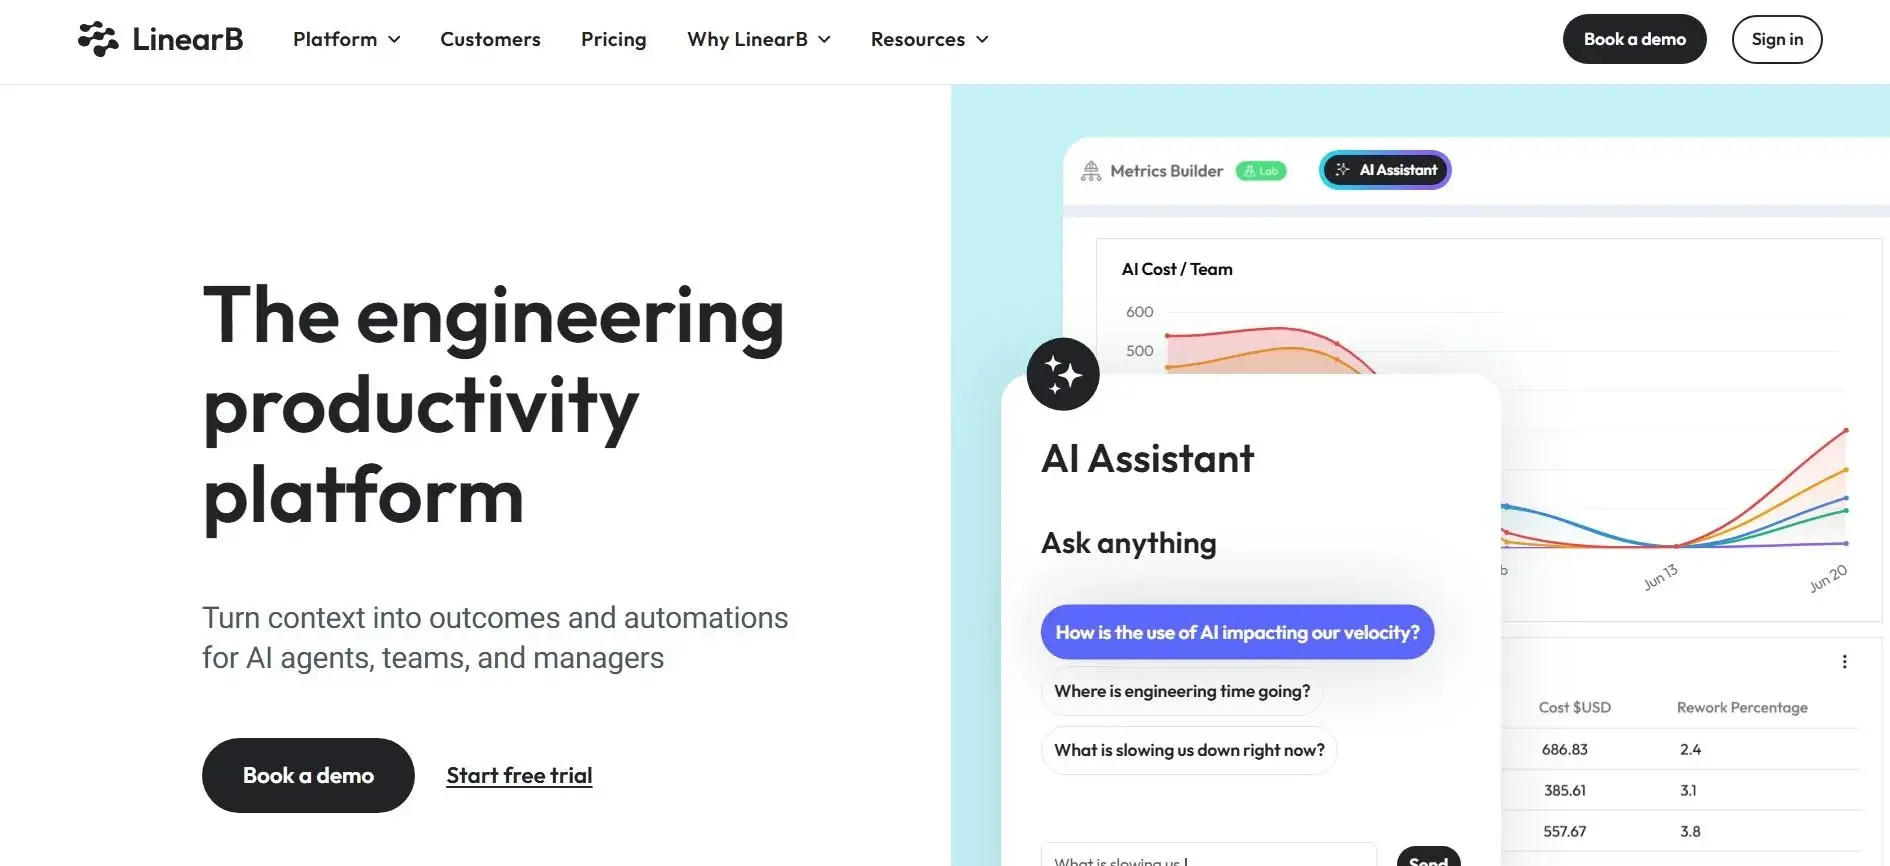
LinearB is an engineering productivity platform for teams that want to measure AI usage, delivery activity, and developer workflow patterns. It connects AI adoption data with engineering metrics such as cycle time, pull request activity, refactor rate, and change failure rate.
With LinearB, teams can:
Downside: Financial reporting (R&D cost capitalization, resource allocation, and investment profiles) is limited to the Enterprise plan, which LinearB positions for teams with 100+ developers. Automations also run on a credit-based model, so costs can climb as automation usage grows.
Pricing: Essentials starts at $29 per user per month and Enterprise at $59 per user per month, both billed annually (LinearB pricing).
Pro tip: Comparing options? See our guide to LinearB alternatives.
This category fits leaders who need to see where engineering time and money go. These platforms focus more on investment allocation, planning, finance reporting, and business alignment than on day-to-day task tracking. Jellyfish, Faros AI, and Waydev fit here.
Source: Jellyfish
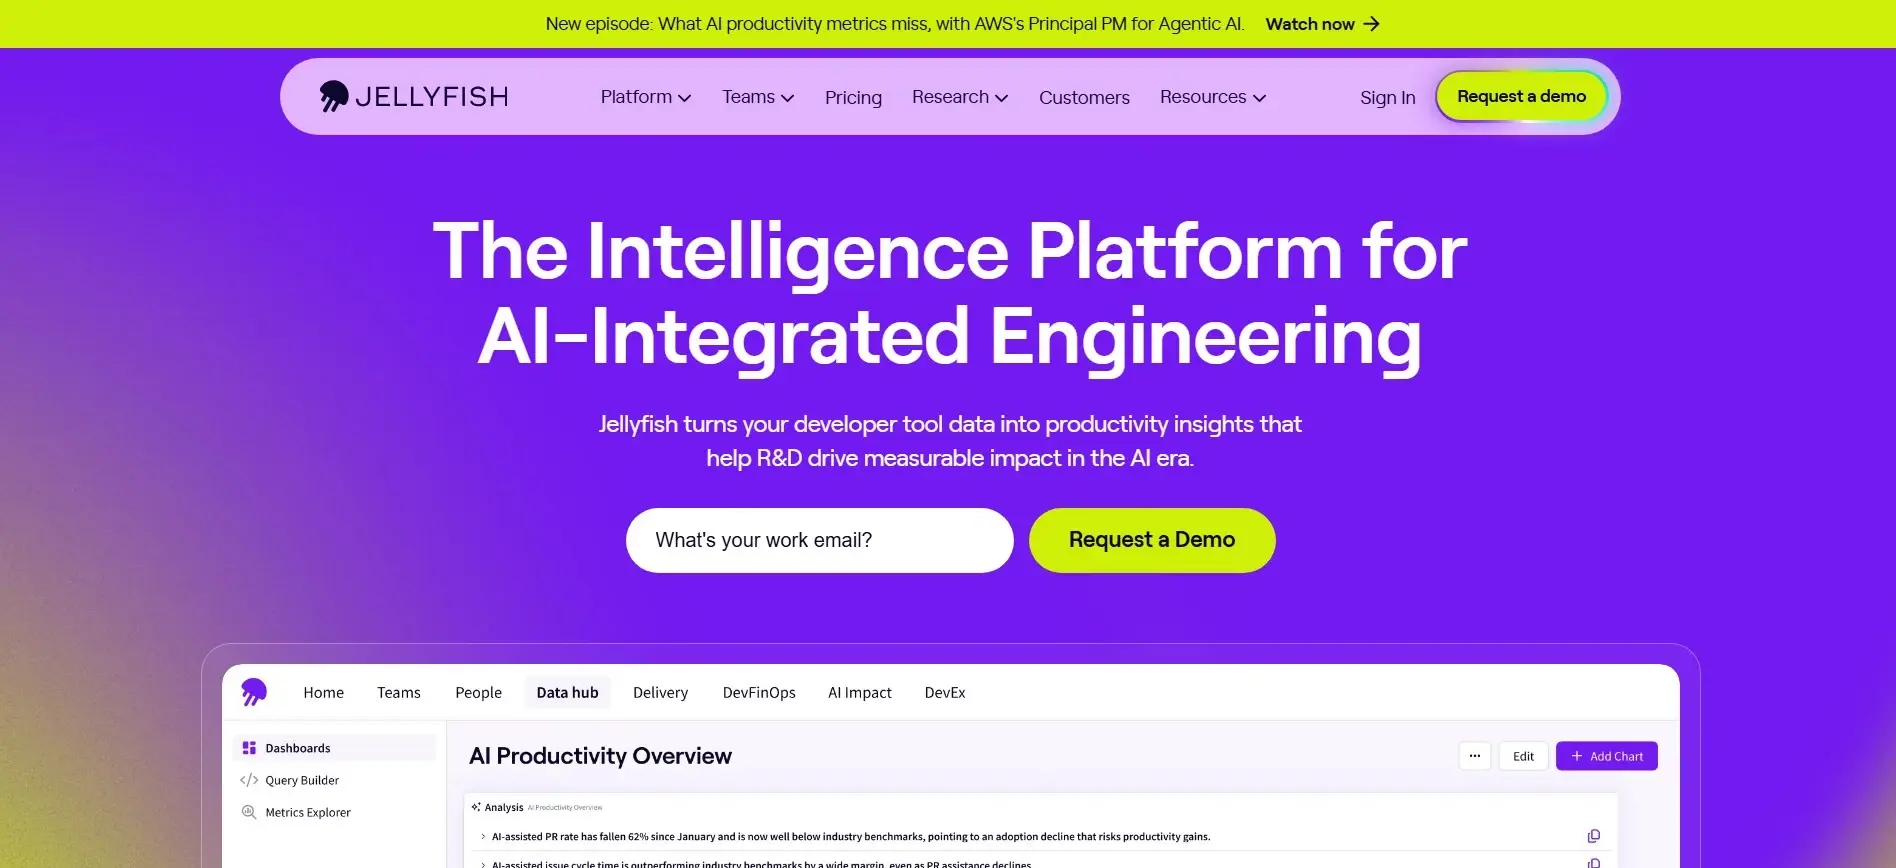
Jellyfish is for R&D leaders who need to connect engineering work with business priorities. It focuses on investment allocation, strategic goal tracking, executive dashboards, AI impact, and DevFinOps reporting.
With Jellyfish, teams can:
Downside: Getting full value requires real setup work: HR data imports, initiative mapping, and ongoing maintenance to keep allocation and capitalization data accurate. Jellyfish also lacks a built-in service catalog, so tracing a metric back to the team or owner responsible for it often means leaving the platform. Pricing is quote-based and scales with seats and modules, with no free tier.
Pricing: Quote-based. As a reference point, Jellyfish's average contract value is reported at around $95,000 per year.
Pro tip: See how it compares in our list of Jellyfish competitors.
Source: Faros AI
Faros AI is an engineering intelligence and productivity platform for larger organizations that need to combine engineering, finance, HR, and operational data. It focuses on engineering ROI, AI productivity, investment strategy, and customizable reporting across complex toolchains.
With Faros AI, teams can:
Downside: Faros AI is designed for large enterprises with complex operating models. Its customization, catalogs, hybrid deployment, and module-based structure can require more implementation work than many engineering teams want from a reporting platform.
Pricing: Quote-based.
Source: Waydev
Waydev focuses on engineering work, business alignment, project costs, and resource planning. It is especially relevant for teams that want engineering visibility and finance-related reporting in the same platform.
With Waydev, teams can:
Downside: Workflow automation (policy enforcement, automated review nudges, PR routing) is less built out than in LinearB, so teams that want the platform to actively intervene in review queues will find it more reporting-focused than action-oriented. Its methodology for attributing AI-written versus human-written code also varies by integration, so confirm during a proof of concept how it works for your toolchain.
Pricing: Quote-based (Waydev pricing).
Pro tip: Weighing your options? Read our guide to Waydev alternatives.
This category fits teams that want to measure how developers experience the software delivery process. These platforms focus on surveys, productivity signals, AI tool usage, and the conditions that affect engineering work.
Source: DX
DX (acquired by Atlassian in 2025) is for organizations that want to measure developer experience, SDLC performance, and AI-assisted development. It is built for engineering leaders, engineering managers, and platform engineering teams that need analytics, surveys, and reporting across the software delivery lifecycle.
With DX, teams can:
Downside: DX is focused on measurement, surveys, connectors, dashboards, and internal developer portal capabilities. Teams that mainly need lightweight sprint execution or basic project scheduling may need a simpler project management tool.
Pricing: Custom pricing.
Pro tip: Compare it with similar tools in our list of DX alternatives.
Source: Swarmia
Swarmia is for teams that want developer experience surveys, AI tooling signals, and delivery metrics in one reporting workflow. It focuses on helping software organizations understand what teams are working on, where work slows down, and how AI tools are being used.
With Swarmia, teams can:
Downside: Swarmia is centered on software engineering intelligence rather than broad work management. It also sells AI adoption, surveys, capitalization, and productivity as separate modules, so buyers should check which package matches their use case.
Pricing: Free for companies with up to 9 developers. The Standard plan costs $45 per developer per month, billed annually, and the AI adoption & cost module alone starts at $5 per developer per month (Swarmia pricing).
Pro tip: See how it stacks up in our guide to Swarmia alternatives.
This category fits teams that need more control over releases, dependencies, and delivery risk. These platforms are usually more relevant when software work spans multiple teams, systems, or CI/CD pipelines.
Plutora is now Planview Release, after Planview acquired Plutora in 2024. It is built for software engineering and DevOps leaders who need centralized release coordination, dependency visibility, and governance across complex delivery environments.
With Planview Release, teams can:
Downside: Planview Release is an enterprise release-governance product first. Teams that mainly need developer experience data, simple sprint planning, or lightweight project scheduling may find the scope heavier than necessary.
Pricing: Custom pricing.
Source: Allstacks
Allstacks is an engineering intelligence platform for software engineering and product management teams. It focuses on forecasting, delivery risk, investment intelligence, and technical dashboards that connect delivery health to business outcomes.
With Allstacks, teams can:
Downside: Allstacks focuses on predictive analysis, investment intelligence, and reporting depth. Teams that only need ticket tracking or a simple release board may find the platform more analytics-heavy than necessary.
Pricing: The Growth plan costs $400 per contributor per year, and Enterprise $600 per contributor per year (Allstacks pricing).
Pro tip: Looking at similar tools? Read our guide to Allstacks alternatives.
This category fits teams that need work coordination across engineering, product, and business teams. These tools can support software workflows, but they are broader project management platforms rather than specialized engineering intelligence systems.
Source: Wrike
Wrike is an enterprise work management platform with project management features for engineering teams. It can support project scheduling, QA workflows, service requests, budget planning, and cross-functional delivery.
With Wrike, teams can:
Downside: Wrike is focused on workflow execution and cross-functional visibility. It is not a specialized engineering intelligence platform, so teams that need DORA metrics, AI tooling ROI analysis, or deeper delivery intelligence may need another tool alongside it.
Pricing: Free plan available.
Source: Asana
Asana is a work management platform that supports sprint planning, product roadmaps, feature launches, and bug tracking. It fits teams that need approachable planning across engineering, product, and business stakeholders.
With Asana, teams can:
Downside: Asana is a broad work management platform with engineering workflows added on top. Organizations that need deep SDLC analytics, DORA reporting, or AI adoption measurement will usually need a more specialized platform alongside it.
Pricing: Free plan available.
Engineering management has changed. Tracking software development work is easy today. The real challenge is understanding whether your engineering effort, AI investment, and delivery performance are moving in the same direction.
Without an engineering management platform, you can struggle to answer questions like:
Without those answers, organizations risk optimizing the wrong things. Teams may adopt AI quickly without improving delivery, spend more on coding assistants without increasing throughput, or prioritize local productivity over customer outcomes.
An engineering management platform helps solve those problems by turning engineering data into operational decisions. The main benefits include:
The biggest benefit is making better decisions with the data you already have. When you can connect AI usage, delivery performance, engineering capacity, and business priorities, you can improve software delivery based on evidence.
Remember: Engineering management platforms overlap with the broader category of software engineering intelligence platforms. If your main question is delivery analytics, our guide to SEI platforms goes deeper.
Choosing an engineering management platform is less about comparing feature lists and more about understanding whether it helps your engineering organization make better decisions. The right choice should improve planning, delivery, resource allocation, and engineering visibility. If it simply gives you more dashboards, it's not the right pick.
These are the most important criteria to evaluate before choosing a platform.
A good platform should track software engineering metrics across delivery speed, flow, quality, and developer experience. That includes cycle time, lead time, deployment frequency, change failure rate, work in progress, review time, and throughput by work type, among others.
Time to market, for example, matters because it has the strongest correlation with higher profit margins among IT efficiency and effectiveness metrics. According to McKinsey, its correlation with revenue growth is 3x stronger than customer satisfaction and 7x stronger than employee satisfaction.
That is why delivery metrics should be reviewed alongside business outcomes.
The correct approach is to review these metrics at the team, product, or portfolio level over the same period. For example, compare cycle time and support volume for the same quarter. If cycle time improves while support volume stays stable, you can discuss whether delivery changes helped the team move faster without creating more customer issues.
The incorrect approach is judging individual developers by output counts. Delivery speed depends on team-level factors (scope, review queues, dependencies, product priorities, sales timing, and release rules), so individual output counts lead to the wrong decisions.
Your platform should connect with the development tools your teams already use, such as Jira, GitHub, GitLab, Azure DevOps, Bitbucket, CI/CD tools, incident tools, and AI coding assistants. Without those connections, the platform becomes another reporting layer that people have to maintain manually.
That problem is common. GitLab’s 2026 AI Accountability research found that only 28% of respondents said their SDLC tools were fully integrated with shared data and workflows. Fragmented toolchains were also the second most-cited barrier to traceability, named by 40% of respondents.
Poor integrations create blind spots. You might see delivery metrics without understanding what slowed development, or track deployment frequency without seeing review bottlenecks or AI usage.
Pro tip: When evaluating vendors, ask whether integrations provide live operational data or simply import reports, and whether they need write access or a copy of your code. That difference determines whether the platform supports day-to-day engineering decisions, and how hard it will be to approve with your security team.
The platform should surface data-driven insights that highlight changes in trends, bottlenecks, and actions worth trying next.
A platform that connects engineering metrics to a clear decision is very useful. For example, if review time increased over the last month and pull requests also got larger, the platform should help you decide whether to reduce PR size, rebalance reviewers, or adjust work in progress limits.
But a platform that shows many charts without explaining the operational tradeoff can leave managers guessing.
Pro tip: Ask vendors to show how the platform explains trends and how it suggests solutions, too.
AI now changes what engineering leaders need to measure. A useful engineering management platform should show AI adoption by team, active usage, accepted suggestions, cost, and delivery impact.
DORA’s 2025 research shows why AI impact needs to be measured across the full delivery system. In its 2025 survey, 90% of respondents said they use AI at work, and more than 80% believed it increased their productivity. At the same time, 30% reported little to no trust in AI-generated code, which means many teams may not be using AI safely or effectively.
A good engineering management platform should also let you compare AI tools on the same basis. For example, one team may use Claude Code for larger workflow tasks while another uses Copilot for in-editor suggestions. The platform should help you compare adoption and cost by tool, then look at delivery signals such as cycle time, review time, and code quality for those teams over the same review period.
A strong platform should show where engineering resources go and whether that work supports product and business priorities. This includes time spent on new features, bugs, maintenance, security, incidents, and technical debt.
This is where business alignment matters. If a team spends most of a quarter on maintenance while leadership expects faster feature delivery, the platform should make that mismatch visible early enough to adjust scope, staffing, or sequencing.
Pro tip: Ask whether the platform shows where engineering effort goes automatically or whether teams must classify work manually. Manual categorization rarely scales across larger engineering organizations.
The platform should reduce cognitive load for managers and teams. If onboarding is slow, definitions are unclear, or reports require too much manual interpretation, adoption will suffer.
Good vendor support matters here. Look for clear documentation, onboarding help, responsive support, and guidance on how to use metrics without turning them into vanity reporting.
A platform with strong engineering process oversight should help your team make better decisions, rather than add another tool people check without changing how work flows.
Pro tip: A platform only improves engineering management if leaders actually use it. During your demo or free trial, measure how long it takes to answer common management questions, such as why delivery slowed last sprint or where engineering capacity is going. If managers still need spreadsheets or manual analysis after implementation, the platform is adding complexity instead of reducing it.
Implementing an engineering management platform is usually harder than buying the tool. The main risks come from adoption, integrations, and how metrics are presented to managers and teams.
Here are the common challenges to plan for before rollout:
Working in small, iterative increments, as Agile methodologies recommend, also applies to the rollout itself: start with one or two questions, show teams what changed, then expand.
Every engineering management platform promises visibility. Few change the quality of engineering decisions.
That's the distinction worth evaluating.
If managers still need separate reports to understand AI adoption, delivery performance, engineering capacity, and business priorities, the platform hasn't reduced management complexity. It has simply moved it.
The right platform should help leaders spend less time assembling information and more time deciding what to do next.
Axify is built for that level of decision-making. It helps engineering leaders track AI adoption and impact, monitor AI cost, compare delivery performance, find bottlenecks with Value Stream Mapping, and use Axify Intelligence to turn engineering data into practical next steps.
Ready to take the next step? Book a demo with Axify and see it with your own engineering data.

An engineering management platform helps software engineering leaders understand what's helping or slowing software delivery. By combining delivery metrics, engineering activity, and AI insights, it gives leaders the context they need to prioritize work, improve planning, and make better engineering decisions.
An engineering management platform focuses on software delivery performance, while project management software focuses on task planning and coordination. Project management tools help teams organize work, while engineering management platforms connect delivery data, code activity, DORA metrics, and other engineering outcomes.
An engineering management platform should track delivery speed, flow, quality, developer experience, and resource allocation. Common metrics include lead time, cycle time, deployment frequency, change failure rate, work in progress, review time, and throughput by work type.
AI coding tools are making engineering management platforms track AI adoption, usage, cost, accepted suggestions, delivery impact, and code quality signals. Leaders now need to see whether AI helps teams move faster without increasing rework, review burden, or production risk.
Engineering management platform pricing generally falls into three tiers:
Pricing usually depends on the number of contributors, included metrics, AI tracking features, integrations, dashboards, support level, and security requirements.