DORA Metrics Dashboard
Based on the latest research from the Google team, DORA metrics predict better delivery performance for better organizational performance.
A path to elite performance
Improve your development process with indicators used by the most successful development teams.

Full tracking of DORA metrics
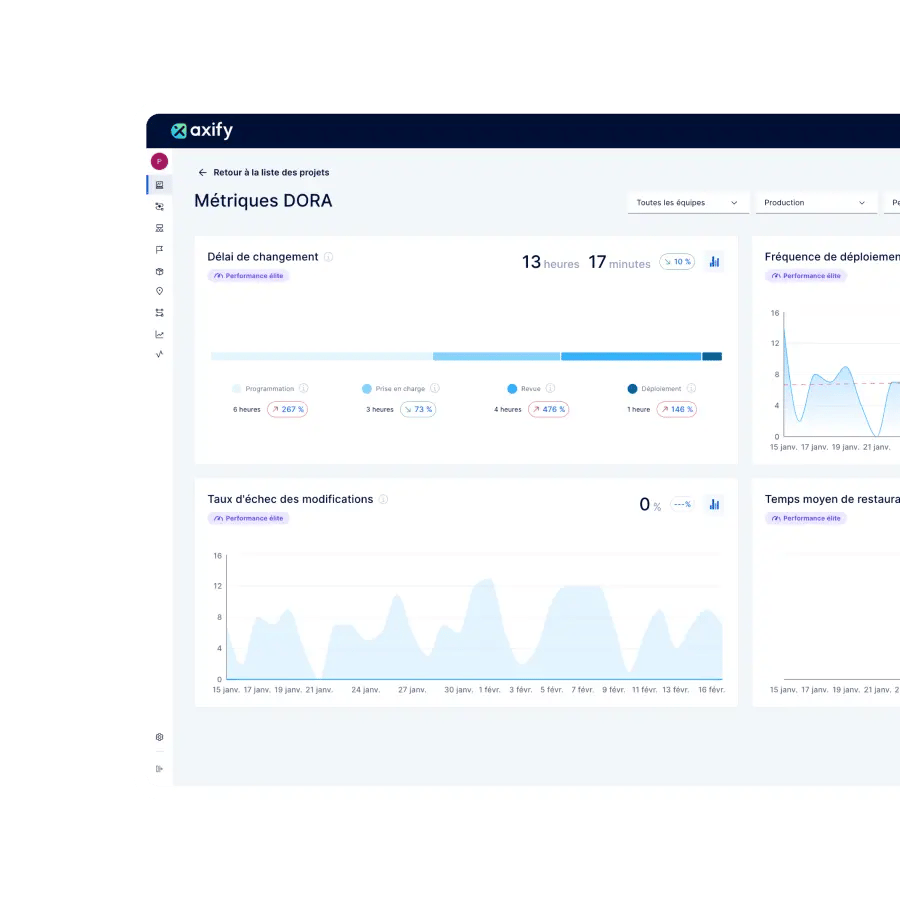
Provides real-time tracking of the four DORA metrics in dashboards that can be used for management presentations or detailed reviews, with indications of trends, bottlenecks and successes.

Automated data logging
Integrates with your tools, such as Jira, Azure DevOps, or GitLab, to collect accurate data at all phases of development, reducing manual input errors and saving development teams time.

Benchmark analysis
Allows teams to compare their performance with industry benchmarks, past performance and other teams in the same organization so they can identify areas for improvement and celebrate successes.

Better performance
Tracking and improving DORA metrics leads development teams to greater reliability, efficiency, agility, and resilience and helps them deliver higher-quality software products.
Complete DORA metrics guide
Download our complete guide to DORA metrics dashboard to learn more and get ideas for improving your performance on each indicator.
All your data in one glance
Use a DORA metrics dashboard to transform your software development cycle.
.png?width=1318&height=1050&name=DORA%20(1).png)
The essential guide to DORA metrics
Find out how good performance in each DORA metric can help you improve efficiency, increase reliability and accelerate software delivery.
Deployment frequency
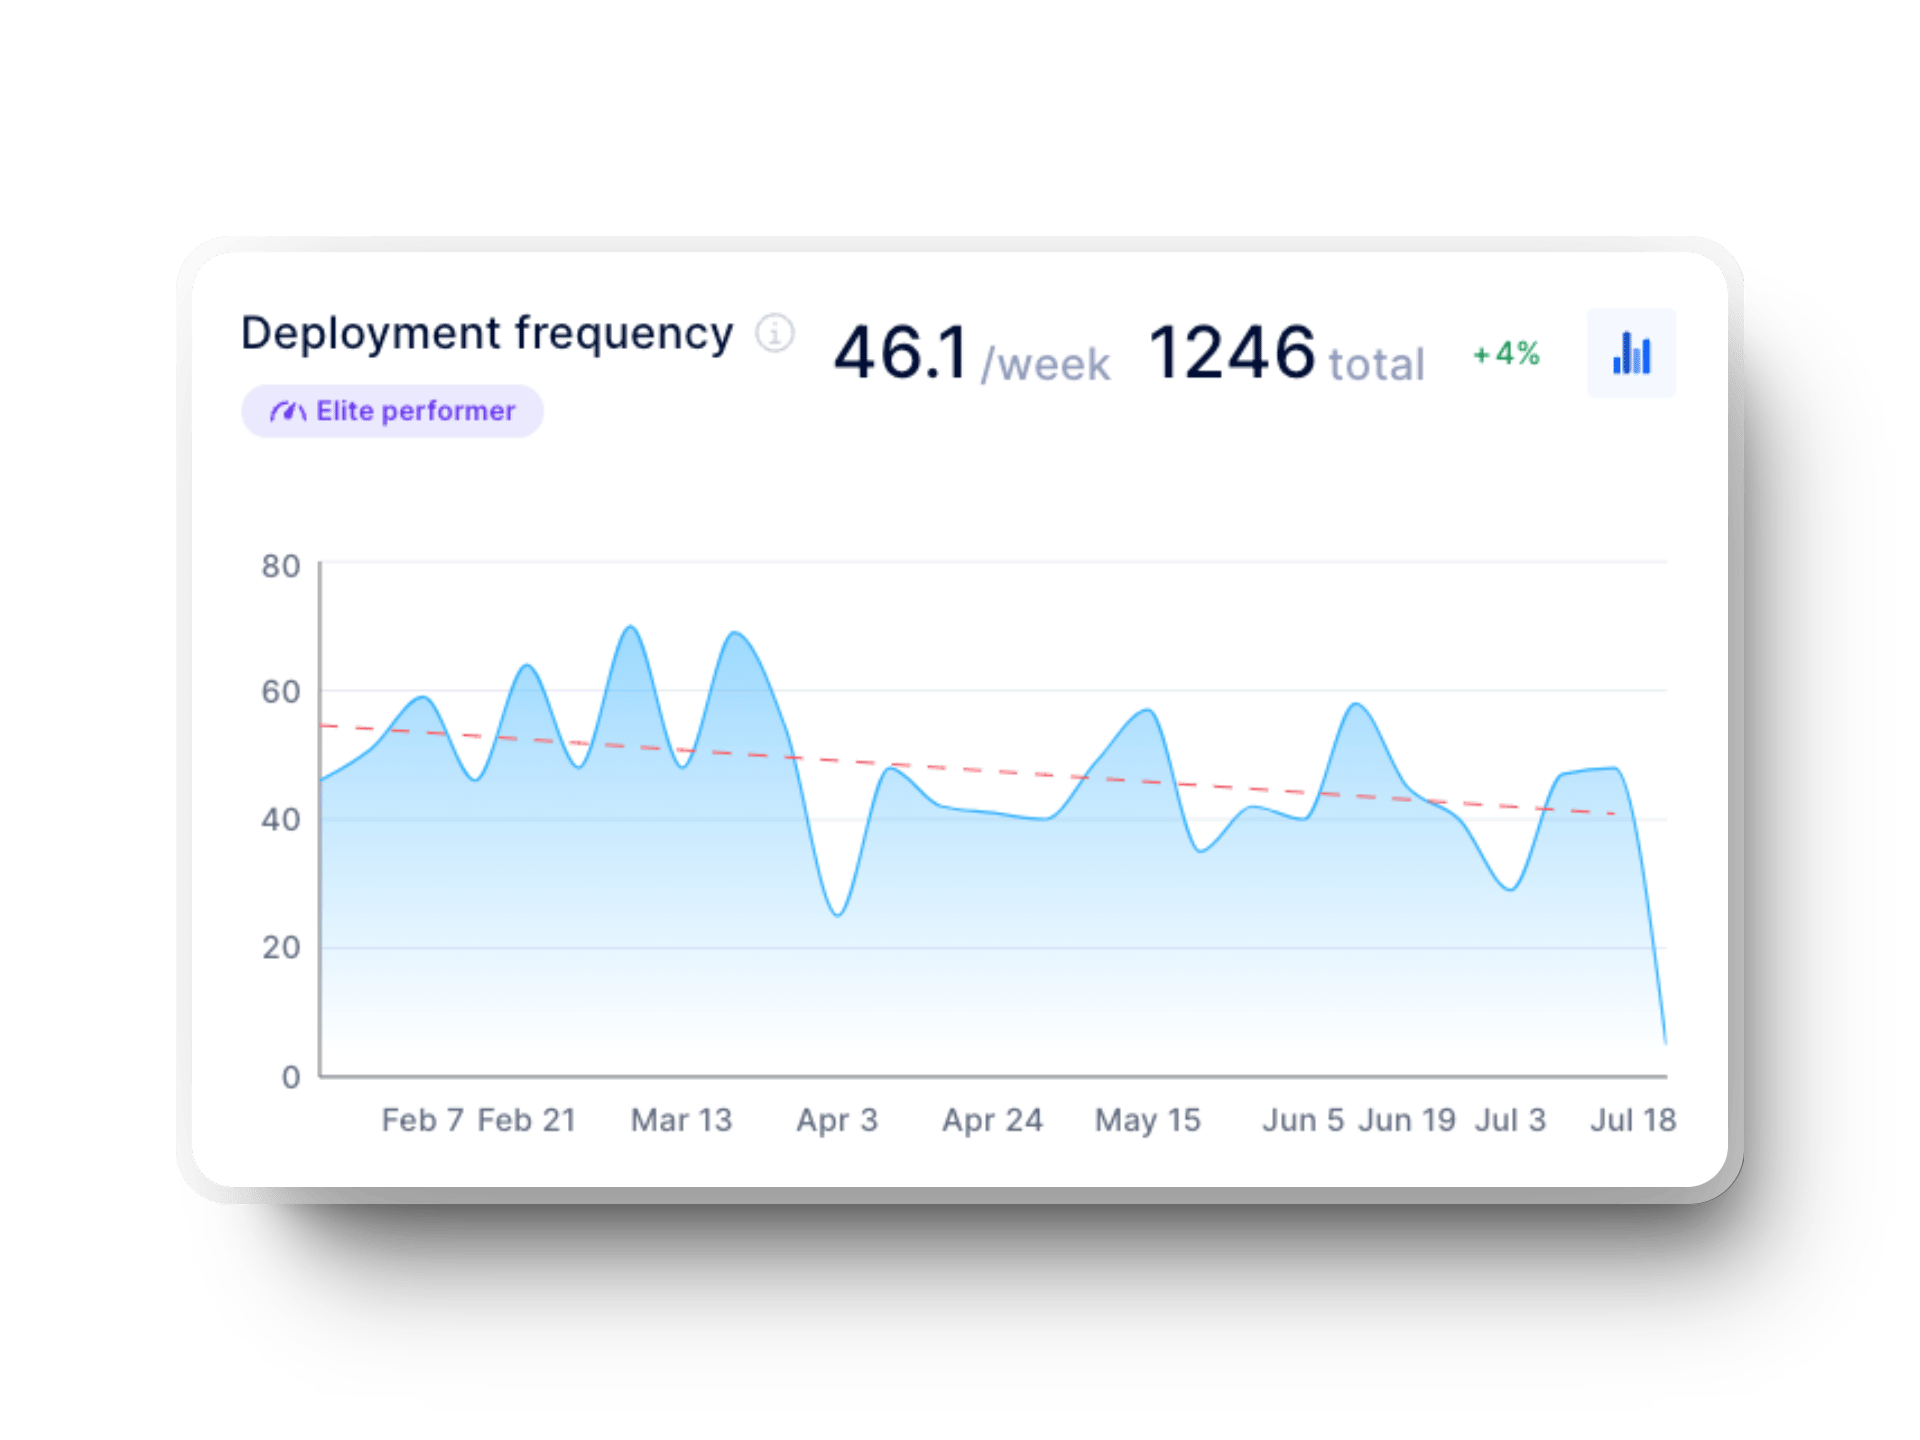
Measuring and increasing deployment frequency :
-
 Influences time-to-market and competitiveness of software products
-
 Facilitates testing, deployment and rollback
-
 Promotes innovation and rapid product improvement
-
 Reduces the risk associated with each deployment
-
 Enables rapid response to market changes and user feedback
-
 Supports an agile development environment and continuous deployment
-
 Leads to greater user satisfaction
Lead time for change
-
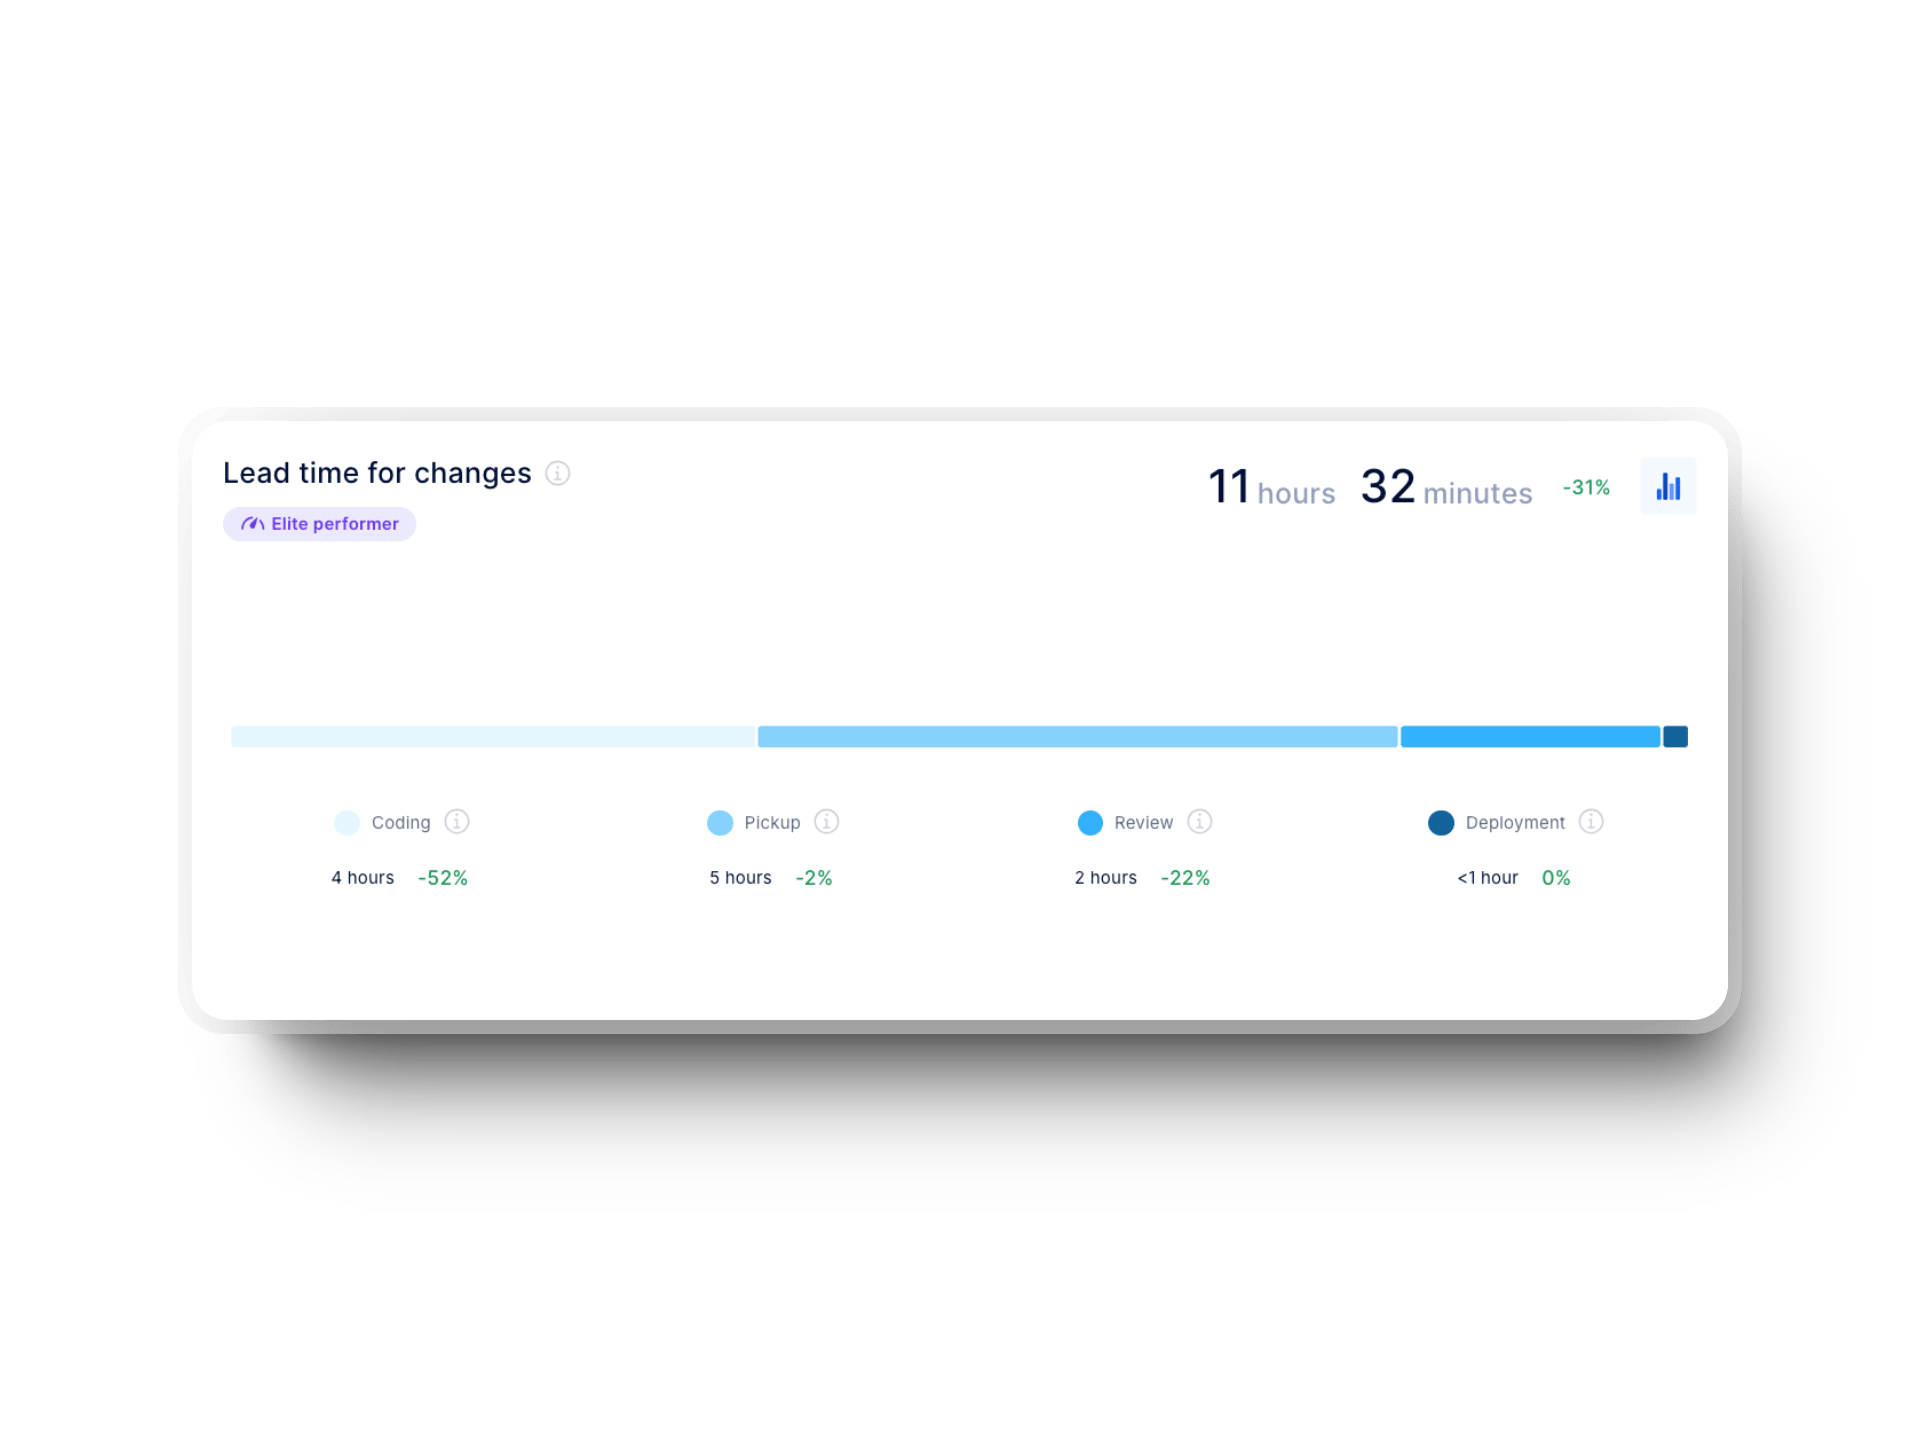
 Allows you to evaluate the effectiveness of software development cycles and initiatives
-
 Leads to organizational, human and technical changes for a more dynamic and responsive development organization
-
 Helps estimate the speed with which a request can be met, as well as forecast deliveries and team capacity
-
 Eliminates wasted time and bottlenecks
-
 Improves the overall quality of the final product
-
 Provides continuous insight into process efficiency
-
 Highlights opportunities for continuous improvement in the software development lifecycle
Change failure rate
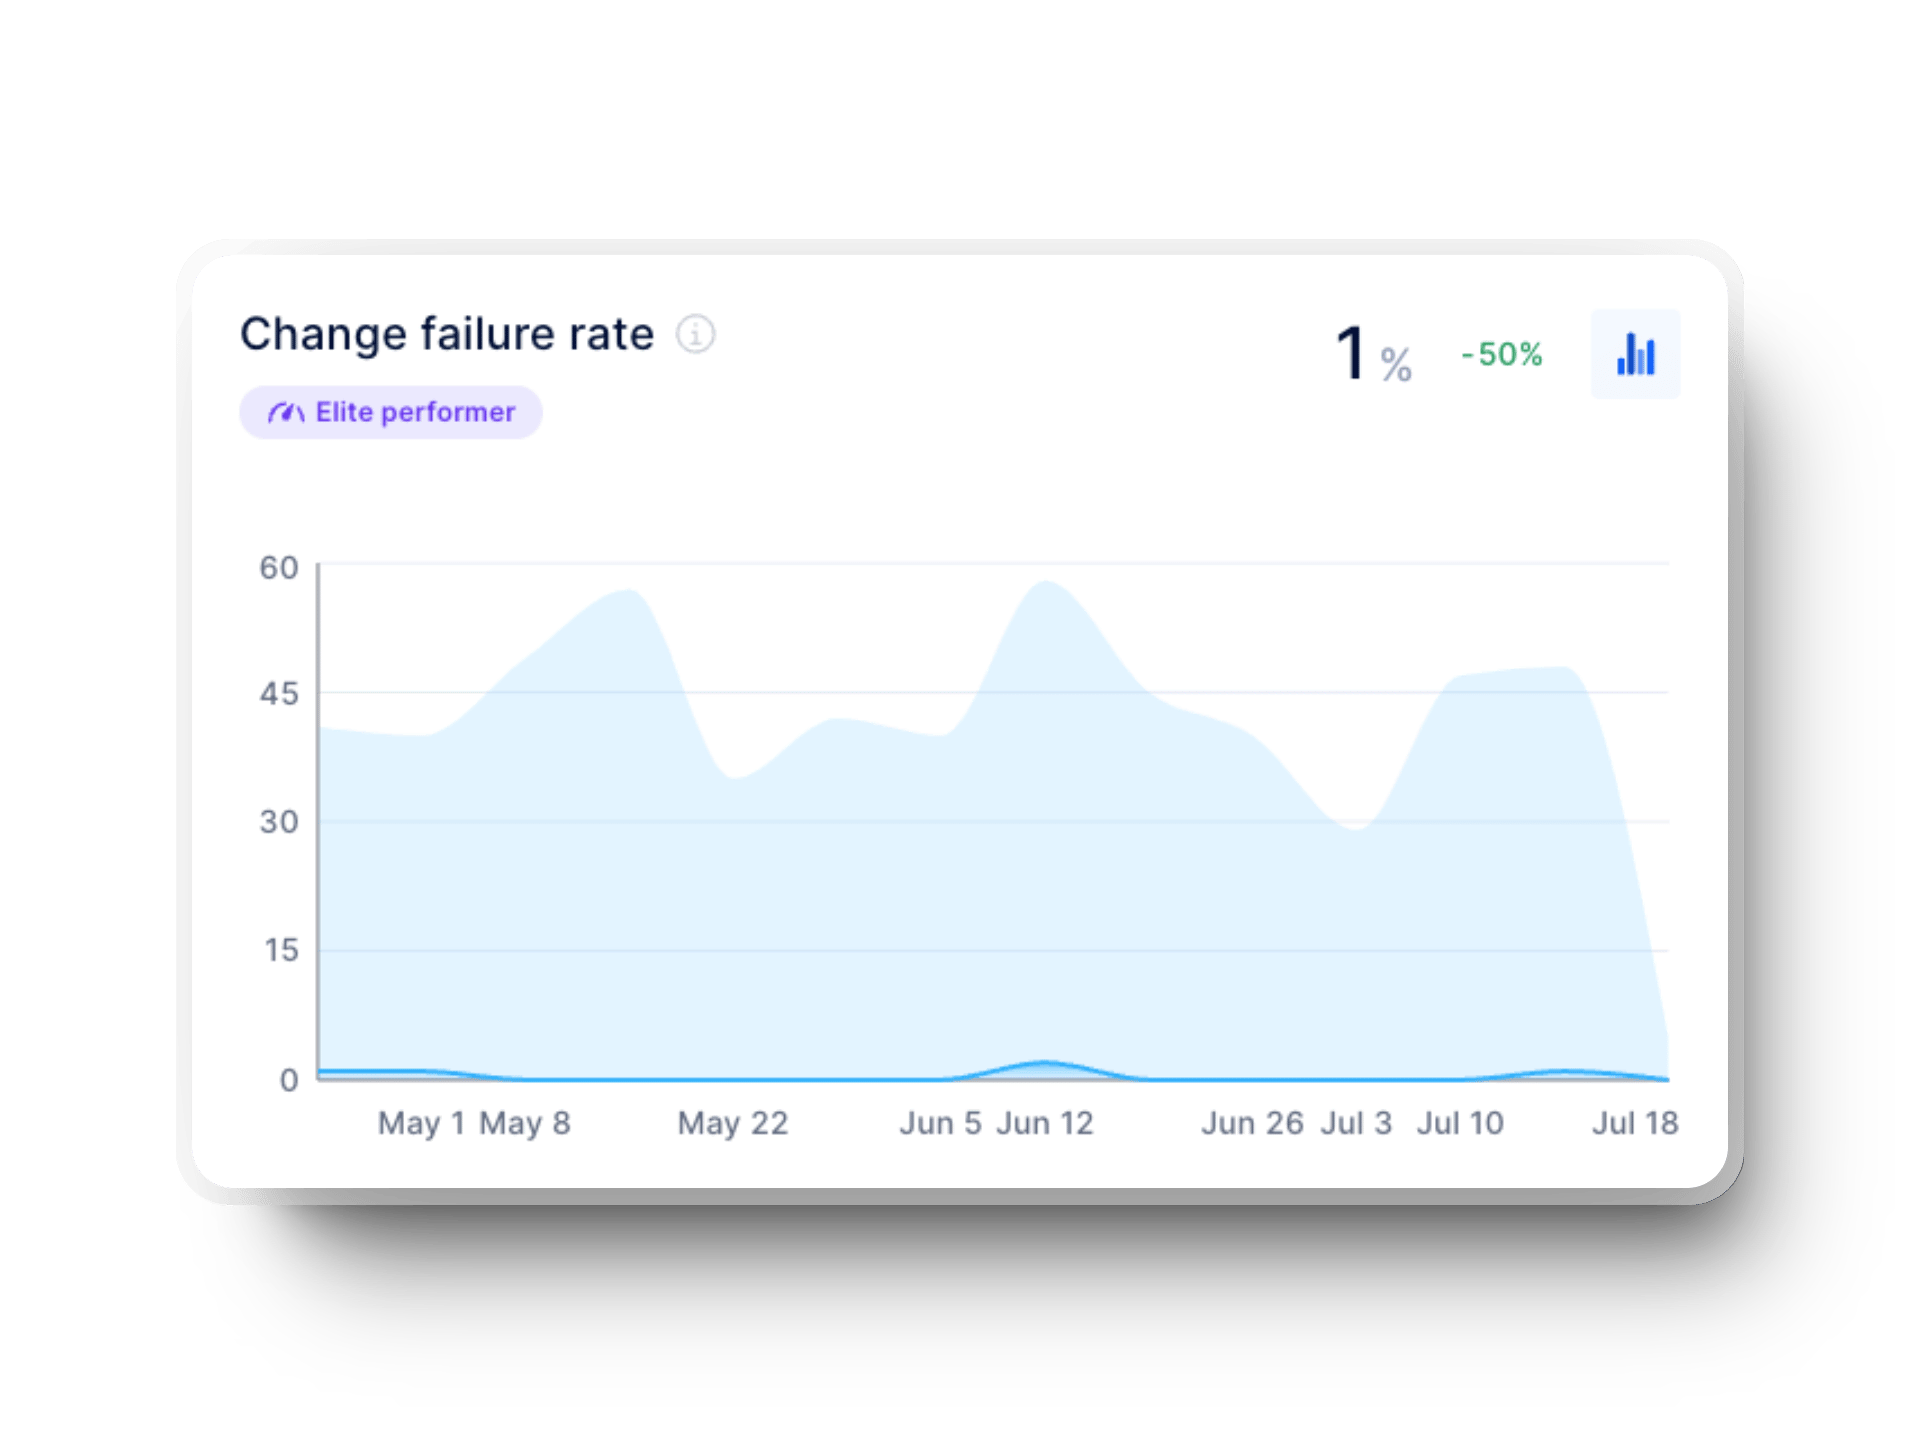
Measuring and lowering change failure rate :
-
 Indicates high-quality software deployments and a more reliable, stable software product
-
 Reduces the likelihood of problems affecting user experience, satisfaction and confidence
-
 Contributes to operational stability by minimizing interruptions and failures
-
 Reduces costs associated with emergency fixes, rollbacks and the negative impact of service interruptions
-
 Can have a positive effect on development team morale and productivity
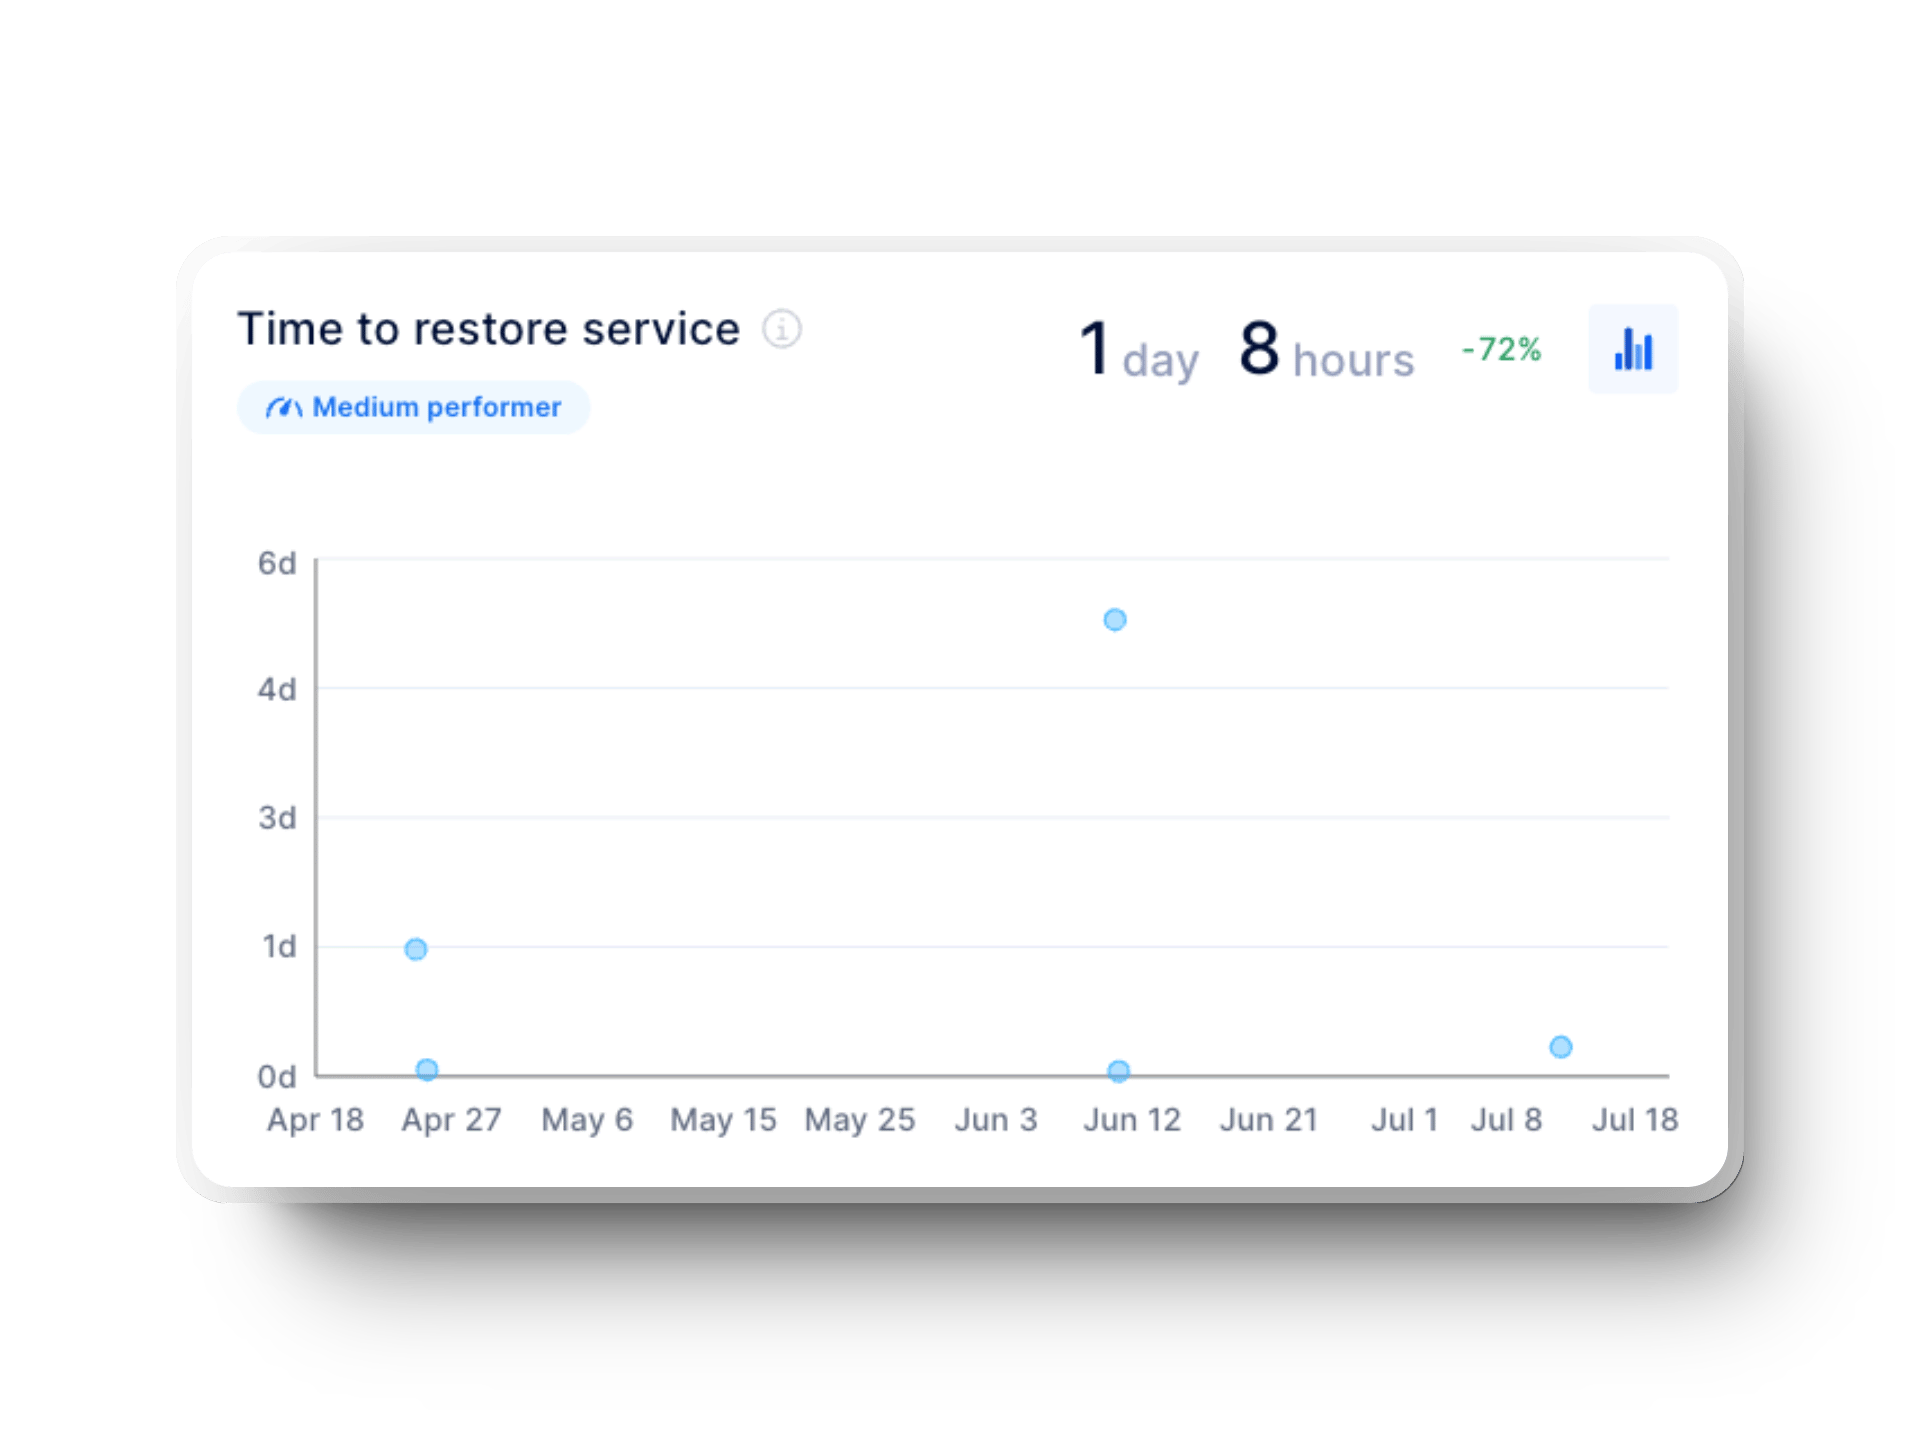
Failed deployment recovery time
Measuring and improving failed deployment recovery time :
-
 Reduces interruptions for customers, increasing satisfaction and loyalty
-
 Reduces financial losses due to service interruptions by restoring normal operations more quickly
-
 Prevents similar incidents in the future and improves system resilience
-
 Enables companies to stand out from the competition and attract more customers thanks to improved reliability
-
 Encourages a culture of innovation and continuous improvement within the organization
Guide complet des métriques DORA
Téléchargez notre guide complet des métriques DORA pour approfondir vos connaissances et obtenir des pistes de réflexion afin d’améliorer vos performances pour chaque indicateur.
Frequently Asked Questions
Everything you need to know about our DORA metrics dashboard
DORA metrics (deployment frequency, lead time for change, change failure rate, and failed deployment recovery time) are key performance indicators that measure the efficiency of software development and operation processes. They help organizations improve their practices by improving the speed and quality of software deliveries.
Axify automates data collection and analysis associated with DORA metrics, providing real-time dashboards and actionable insights. It helps teams track performance, identify areas for improvement and make informed decisions based on data.
Yes, Axify is designed to integrate easily with popular development tools such as Azure DevOps, GitHub and Jira. This integration enables automatic data synchronization and provides a complete view of your development context.
No! All your data is simply gathered from your tools.
Absolutely. Whether you're a small business or a large corporation, Axify adapts to your project's specific needs and the size of your team, providing customized information to help each team stay on track.
Absolutely. Axify is designed to adapt and manage data from multiple teams and projects, making it suitable for organizations of all sizes.
No two development teams are alike. Let's find out together if Axify is the right solution for you with a short discovery call. We've guided teams of many sizes, settings and industries toward the ideal configuration of their Axify space to equip them with data that works for them.
Axify starts collecting data and presenting dashboards when your integrations are connected. The only exception is team morale, where we wait two weeks before generating the first report to ensure proper data representation and anonymity. Up to one year's data history is available from the first day of use.
It's very simple! First, we'll help you add your team (Axify users and the developers who will receive daily questions) to your organization. Then, we'll guide you through activating various integrations to begin synchronizing data. Once these two elements are in place, you can analyze and improve your processes.
You bet! We integrate customer support into all our plans via our help center or product specialists. Some plans also include a Slack channel dedicated to supporting your team.
Axify only stores the information necessary for its operations. More specifically, this includes a restricted subset of the information offered by the various integrations supported by Axify, such as the title and change history of a Jira item or Azure DevOps work item, the description and list of commits for pull requests, the date of a deployment, or the responses to team morale surveys. Axify does not retain any source code.
You can find our full privacy policy and notice on cookies by clicking here.
Yes! Try Axify free for 14 days. Access all features and integrations. Get support from our team to get you off to a great start. See improvements before you even choose your plan!
Absolutely! Our team is here to help you choose the right plan or adjust your current plan to suit your needs. Whether it's a change in the size of your team or the level of support you want, contact us to change your plan.
You can cancel your Axify plan at any time. Your account will remain active until your renewal date.
Start your free trial
Find out how Axify can help your development team build a better software engineering culture.


.png?width=60&name=About%20Us%20-%20Axify%20(2).png)