We know your team feels constant pressure to deliver high-quality products swiftly while maintaining a sustainable workflow.
One key metric to follow and optimize from that standpoint is flow velocity, which tells you how quickly value is being delivered to your customers.
And you’re reading the right article because we discuss:
- What flow velocity is, and why it matters in the context of software delivery
- How to measure and interpret this metric
- Common challenges and how Axify can help you overcome them
Let’s dive in.
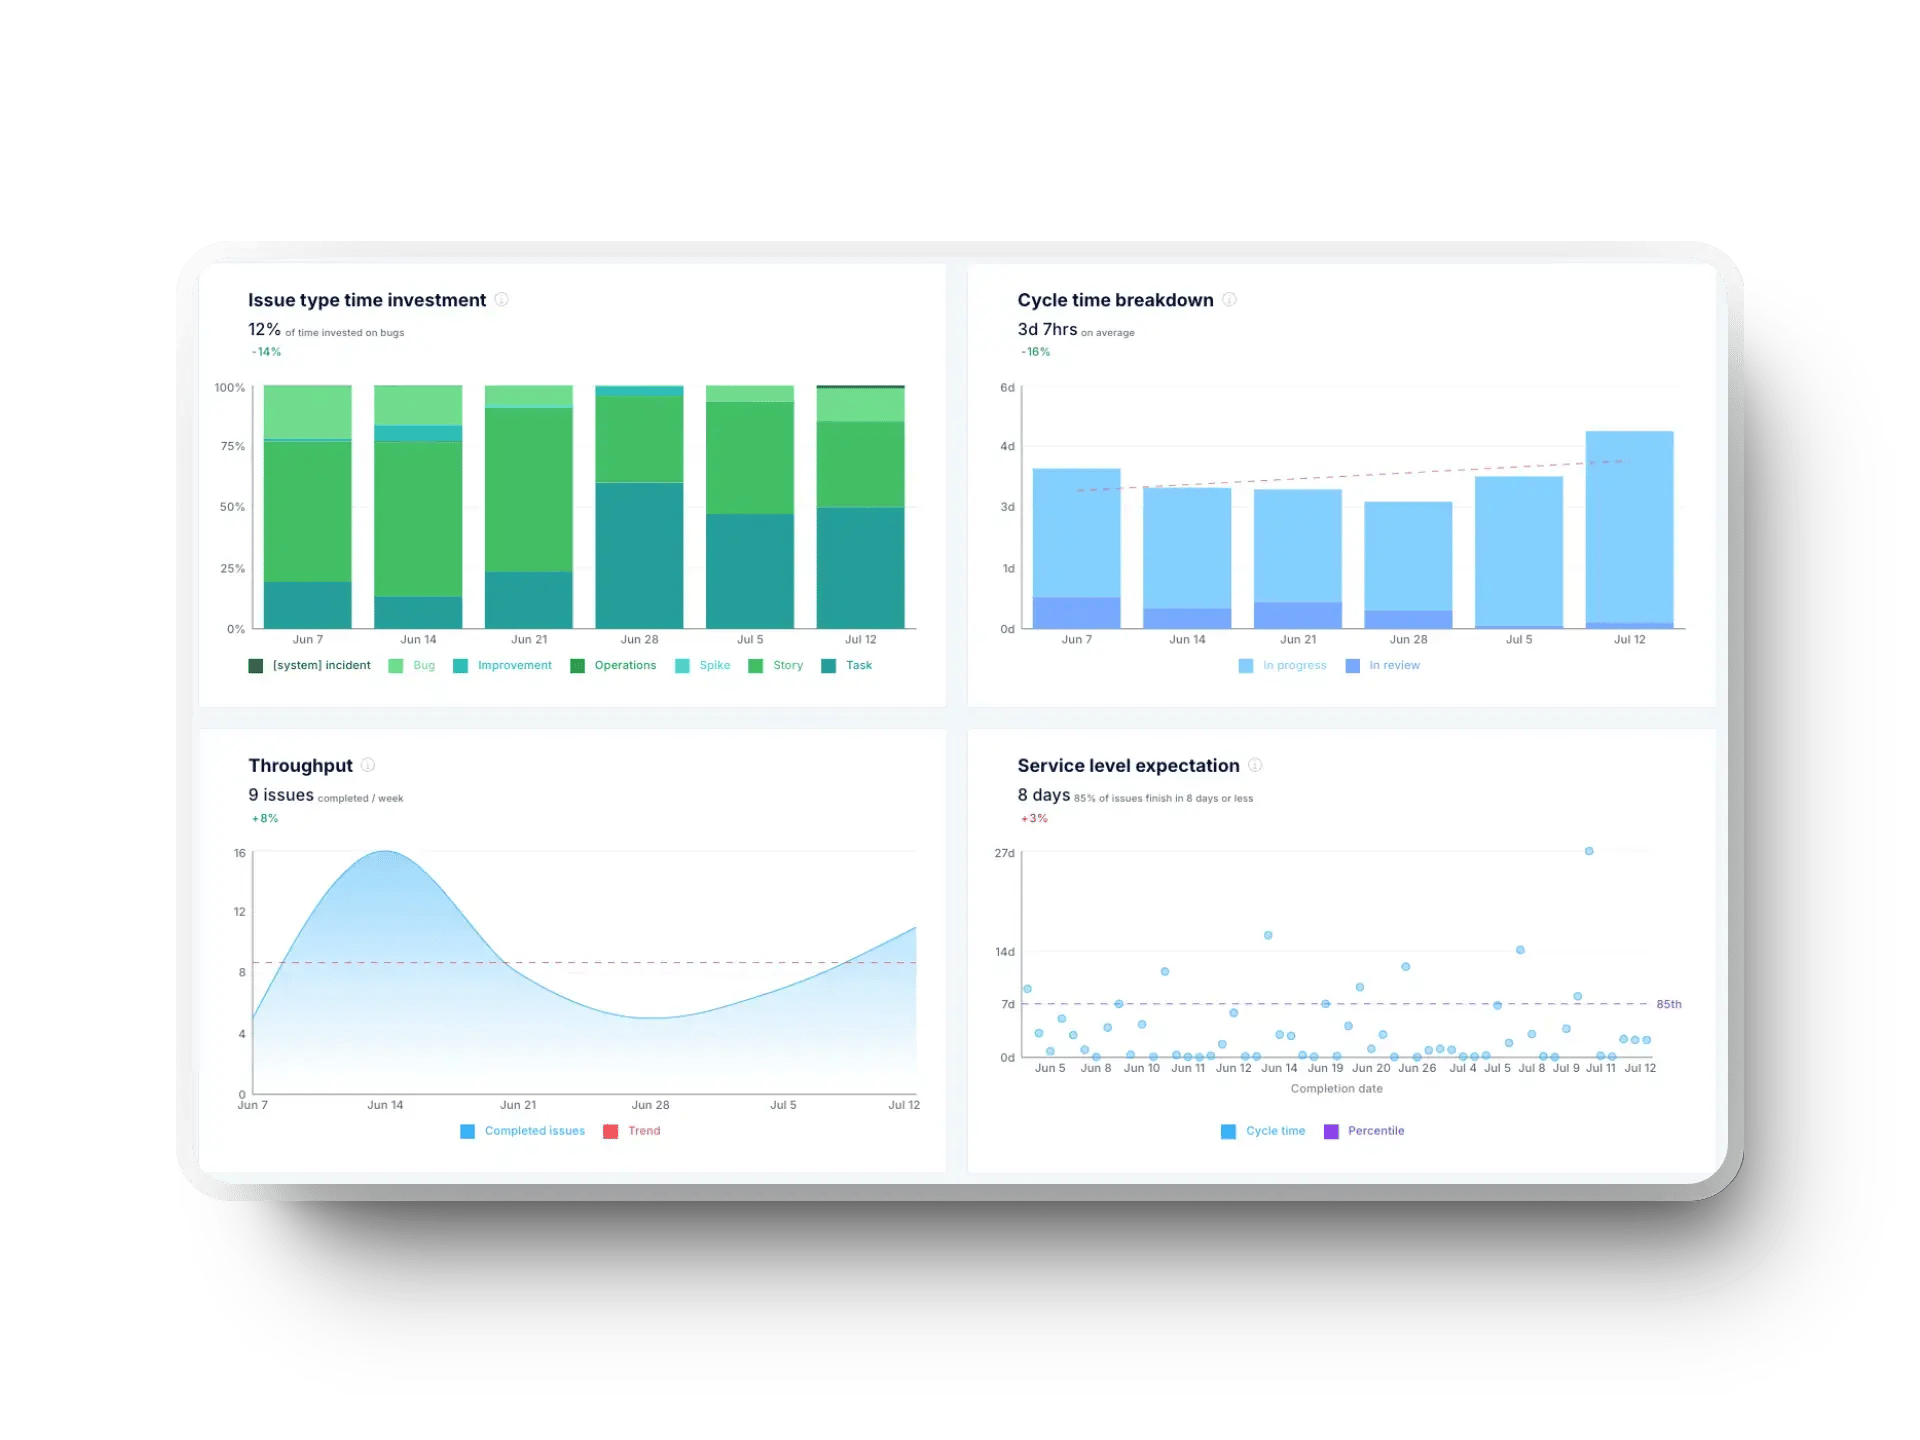
Insider tip: By leveraging Axify's comprehensive metrics dashboard, you can visualize your team's throughput across different projects. This lets you spot bottlenecks early and adjust your workflow to ensure consistent and accelerated delivery. Use these insights to align your team's efforts with your strategic objectives, ensuring you're always moving toward faster, more efficient software releases.

What Are Flow Metrics?
Flow metrics are key performance indicators that clearly show how effectively work is moving through the development lifecycle, from inception to completion.
Flow metrics help you identify bottlenecks, streamline processes, and ultimately improve your ability to deliver high-quality software faster.
Standard flow metrics include flow time, flow efficiency, flow velocity, and flow load.
As you can see, they focus on different aspects of the development process, such as the speed of delivery, the workload being handled, and the overall effectiveness of the team's workflow.
What Is Flow Velocity?
Flow velocity measures the rate at which work items are completed and delivered within a given timeframe. It tells you how much work your team can deliver over a specific period, providing insight into your team's throughput. This metric is crucial because it reflects the pace at which your team can bring value to your customers.
A higher flow velocity indicates that your team maintains a consistent and efficient delivery pace, while a lower flow velocity may suggest bottlenecks or inefficiencies in your process. Monitoring flow velocity helps you ensure you get the needed results consistently.
Pro tip: You should analyze flow velocity alongside other flow metrics for a comprehensive view of your development process. For example:
- Flow time: To understand how long work takes to complete.
- Flow efficiency: To determine the rate at which the team's time is spent actively working versus the total time, including waiting or delays.
- Flow load: To assess whether your team handles an appropriate amount of work relative to their capacity, ensuring the team is adequately organized and utilized.
How to Calculate Flow Velocity
Calculating flow velocity is straightforward, but doing it effectively requires a clear understanding of your team's workflow and the tasks at hand. Here’s how you can calculate flow velocity in your development process:
- Define the time period: Choose a specific time frame for measuring flow velocity, such as a sprint, a week, or a month.
- Count completed work items: Tally the total number of work items completed during the chosen period. This could include user stories, features, bug fixes, or any other deliverables your team tracks.
- Pro tip: Theoretically, you can calculate throughput at any level you want—whether at sub-tasks, user stories, epics, or initiatives.
- Calculate flow velocity: Use the formula below to calculate the average number of work items completed per time unit (e.g., per sprint).

Example Time: Real Flow Velocity Calculation
If your team completes 10 work items over 5 months, your average flow velocity would be 2 items per month.
But here’s a trickier example.
Let’s say your team is working on a project that spans six sprints, each lasting two weeks. Over these 12 weeks, your team completes a varying number of work items in each sprint.
Sprint breakdown:
- Sprint 1: 25 work items completed
- Sprint 2: 30 work items completed
- Sprint 3: 28 work items completed
- Sprint 4: 35 work items completed
- Sprint 5: 27 work items completed
- Sprint 6: 32 work items completed
Total time period: 12 weeks (6 sprints)
Total work items completed: 25 + 30 + 28 + 35 + 27 + 32 = 177 work items
Flow velocity = 177 work items/ 6 sprints ≈ 29.5 work items/sprint
In this example, your team’s average flow velocity over the 12 weeks is approximately 29.5 work items per sprint.
Pro tip: Here’s what to look for beyond just this number:
- Variation across sprints: Notice the variation in the number of work items completed per sprint. While some fluctuation is normal, significant differences indicate bottlenecks or changes in team capacity that you need to address. Also, remember that work items may vary in size and complexity, affecting how many you complete in each sprint. Larger or more complex items mean fewer completions in a given sprint, while smaller items allow more.
- Trend analysis: Monitor whether your team is improving, maintaining, or declining in terms of delivery speed. An increasing trend might indicate that your team is becoming more efficient or has overcome initial challenges. However, if you notice a decreasing trend, it may signal underlying problems within the team. Aim to break down work into smaller, similarly-sized units to achieve stability and predictability. This approach helps maintain consistent delivery and makes it easier to identify and address any challenges the team might face.
Factors to Consider
After reviewing this example, we can better infer the main factors to consider when measuring flow velocity.
- Historical throughput: Use historical throughput data to predict what your team can realistically accomplish in a given sprint. By understanding the typical number of work items your team completes, you can set more accurate sprint goals and ensure that the workload is manageable, leading to more predictable outcomes.
- Team composition stability: Consider any changes in team composition during these sprints, as new team members, departures, or shifts in roles can affect productivity and, consequently, flow velocity.
Insider tip: Use Axify’s Historical Data Analysis feature to compare velocity across multiple projects and time periods. This helps you identify patterns, make predictions for future sprints, and fine-tune your workflow to maintain or increase delivery speed.
How to Interpret Flow Velocity
High flow velocity is generally a positive indicator, suggesting that your team completes work efficiently and consistently delivers value. It typically reflects a well-balanced workflow with minimal bottlenecks, enabling rapid progress on tasks and faster time to market for your product.
However, there are times when a high flow velocity is not beneficial. For instance:
- Quality vs. speed trade-off: If the focus is too heavily on speed, it might compromise quality. Rushing through tasks to maintain a high velocity can result in technical debt or defects that require later rework.
- Team burnout: Consistently pushing for a high flow velocity without considering the team's capacity can lead to burnout. If the team is under pressure to maintain an unsustainable pace, it could negatively impact morale and productivity in the long run.
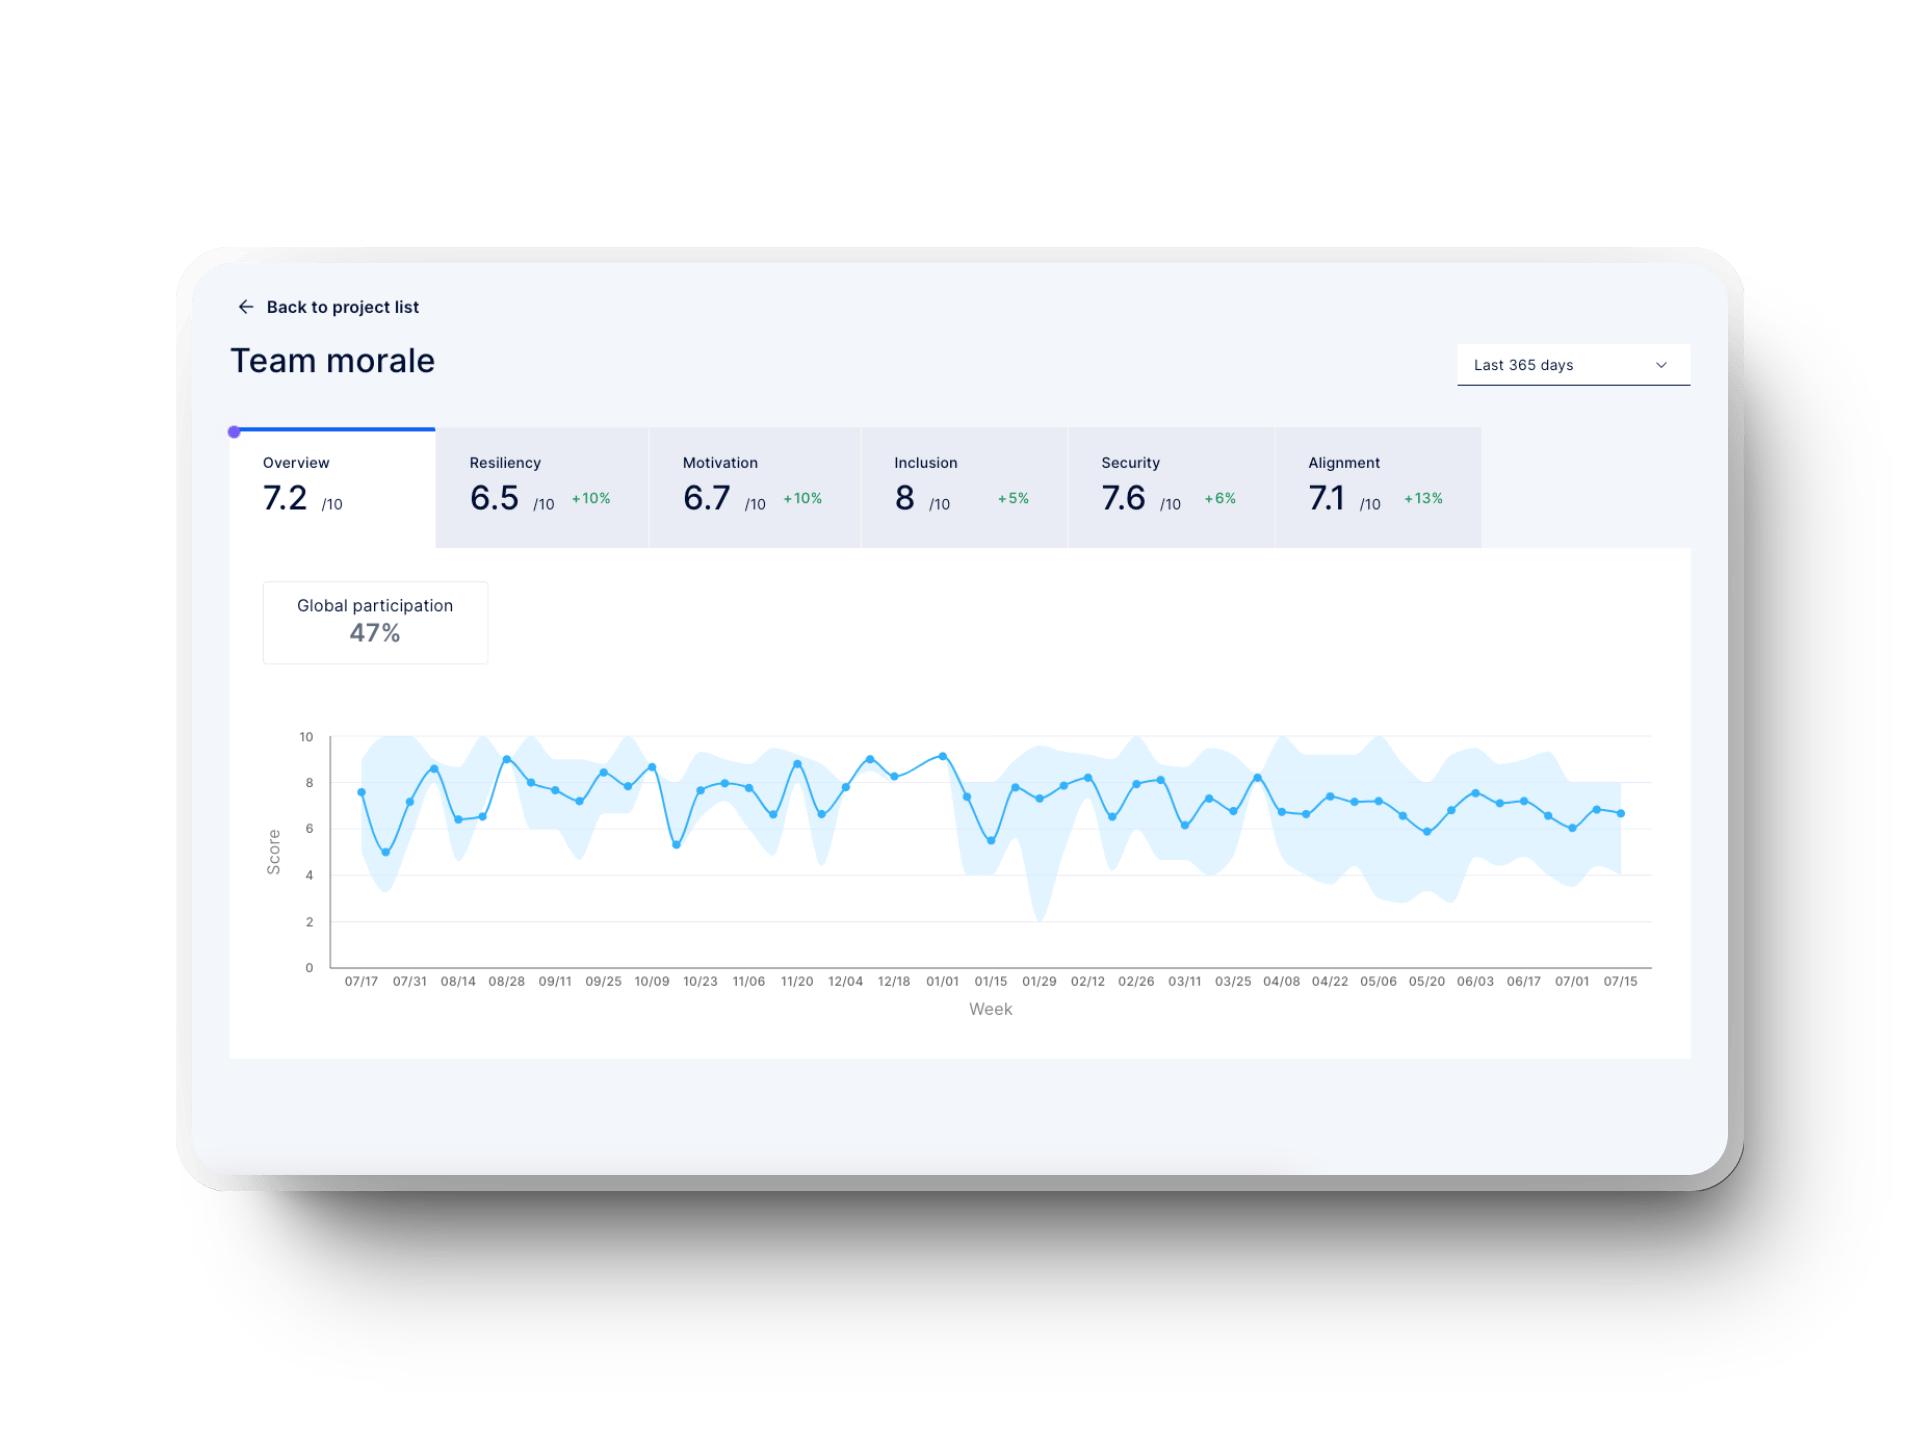
Insider tip: Use Axify’s team well-being tracker to balance flow velocity with team health. This feature helps you monitor team morale and workload, ensuring that while your team delivers quickly, they maintain a sustainable pace and high job satisfaction.
Flow Velocity: Key Uses and Benefits
Flow velocity is a versatile metric that offers significant benefits across various roles within a software development team.
Let’s explore some of these benefits:
Developers
- Enhanced workflow efficiency: Tracking flow velocity allows developers to identify where work is moving smoothly and stalling. Addressing these bottlenecks helps optimize your processes, leading to a more streamlined workflow.
- Consistent delivery pace: Maintaining a steady flow velocity helps developers manage their workload more effectively. This reduces the stress associated with fluctuating demand and ensures a more balanced and sustainable pace of work.
Project Managers
- Improved project forecasting: Understanding the team’s flow velocity over time enables project managers to create more accurate project timelines and delivery forecasts. This insight helps set realistic expectations with stakeholders and reduce the risk of project delays.
- Resource management: Analyzing flow velocity data allows project managers to predict when work will be completed, using historical throughput as a guide. This approach is more efficient because it doesn’t require the team to estimate every task in detail. Instead, understanding the typical throughput lets you make informed predictions about timelines. That way, you can manage resources effectively and ensure your team is not overburdened. The result is timely and high-quality deliveries.
Product Owners
- Better prioritization: Flow velocity, when considered alongside other flow metrics, helps product owners prioritize tasks that can be completed quickly while still delivering high value. This allows for faster response times to market demands and customer needs.
- Increased customer satisfaction: A consistent and optimized flow velocity means product owners can deliver features and improvements more regularly. This agility leads to better alignment with customer expectations and higher satisfaction.
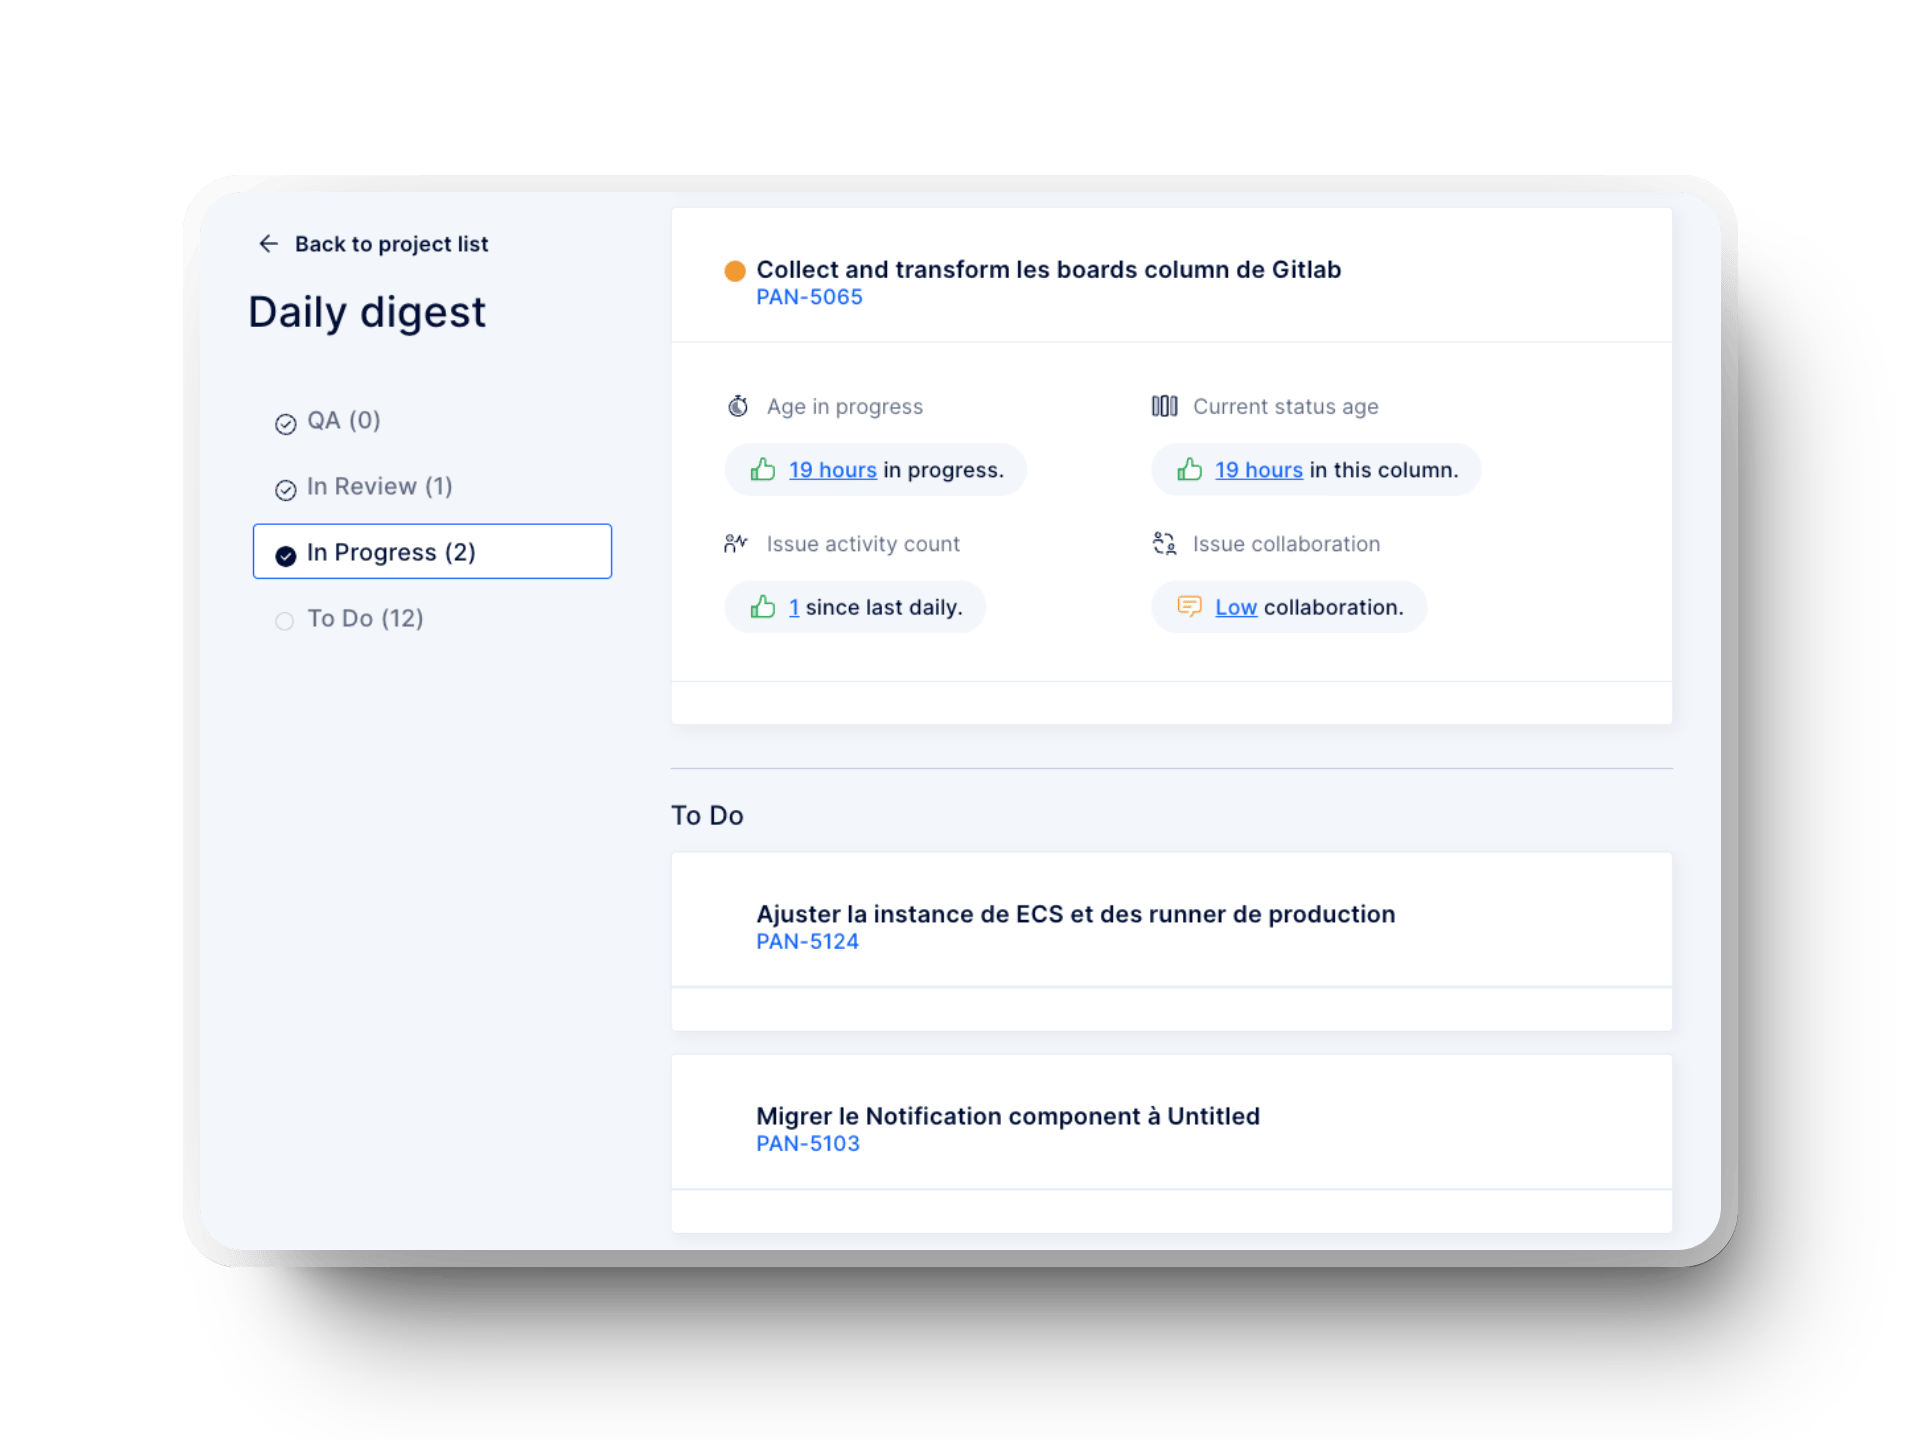
Insider tip: While maintaining a high flow velocity is critical for delivering value quickly, ensuring that this pace is sustainable is equally important. Axify’s Daily Digest feature can help you monitor key metrics daily, including age in progress, current status age, and other historical data. By closely monitoring your team’s daily performance, you can make real-time adjustments to avoid burnout and ensure that your team remains productive and motivated.
Flow Velocity vs. Development Velocity
Understanding the difference between flow velocity and development velocity is crucial for accurately assessing your team's performance and delivery speed.
- Flow velocity measures the rate at which work items, such as user stories or tasks, are completed and delivered over a specified time period. It focuses on the team's throughput and indicates how much work is getting done.
- Development velocity typically refers to the amount of work (often measured in story points or another unit of measure) a development team completes during a sprint or iteration. It focuses more on the team's capacity and productivity within a fixed time frame.
Key Differences
- Scope of measurement: Flow velocity looks at the overall workflow across the entire development lifecycle, encompassing multiple stages and teams. Development velocity, on the other hand, is more focused on the development team's performance during a sprint.
- Purpose: Flow velocity optimizes the flow of work and improves efficiency across the process, while development velocity is used for sprint planning and ensures that the team can commit to a reasonable amount of work within a given time frame.
- Units of measurement: Flow velocity is measured in completed work items per time period, whereas development velocity is typically measured in story points or similar units per sprint.
Insider tip: Use Axify’s Value Stream Mapping (VSM) to visualize how work moves through your process, with metrics like deliverables lead time, issues cycle time, and lead time for changes. These metrics provide valuable insights that help you identify and address bottlenecks.

How to Improve Flow Velocity in Software Development
Improving flow velocity is critical to delivering value more quickly and consistently. Ultimately, you need your team to maintain a steady and efficient pace of work without compromising quality. Here are some strategies to boost flow velocity:
- Optimize task breakdown: Break down complex tasks into smaller, more manageable work items. Smaller tasks are easier to complete and track, reducing the risk of delays and keeping the workflow moving steadily.
- Limit Work in Progress (WIP): Like flow time, limiting WIP is essential for improving flow velocity. Focus your team on fewer tasks at a time to ensure they can complete each one more quickly. The point is to minimize context switching as much as possible.
- Work iteratively: Adopt Agile methodologies like Scrum or Kanban, emphasizing iterative development, continuous feedback, and regular adjustments. Agile practices help teams stay focused, respond to changes quickly, and maintain a consistent delivery pace, all contributing to a higher flow velocity.
- Enhance cross-functional collaboration: Encourage close collaboration between developers, testers, designers, and operations teams. The faster issues are identified and resolved, the quicker you can complete work items.
- Regularly review and adjust processes: Conduct regular retrospectives to identify bottlenecks or inefficiencies in your processes. Use these insights to make targeted improvements that boost flow velocity.
- Improve technical capabilities: Better technical capabilities help you speed up your processes. For example, better test automation enables you to maintain high speed without increasing technical debt.
Challenges in Measuring Flow Velocity and the Axify Solution
Measuring flow velocity in software development can be challenging due to several factors:
- Inconsistent work item sizes: Different tasks can vary significantly in size and complexity, making it challenging to measure flow velocity consistently. High variability leads to less predictability, making your estimations less reliable.
- Data accuracy and completeness: Accurate flow velocity measurements depend on consistent data collection. Incomplete or outdated data due to manual entry errors can result in unreliable metrics, making it hard to gauge the actual velocity.
- Workflow complexity: Multiple stages and hand-offs in the development process can introduce delays and make it challenging to measure flow velocity accurately. Identifying where work is getting stuck without clear visibility into each stage is difficult.
The Axify Solution
Axify helps overcome these challenges by providing a comprehensive set of tools designed to improve the accuracy and reliability of flow velocity measurements:
- Standardized metrics: Axify ensures consistency across teams by standardizing how data is collected and analyzed. Our engineering metrics make it easier to compare velocity information across different projects.
- Automated data collection: Axify automates the collection and synchronization of data from your existing tools (e.g., Jira, Azure, DevOps, or GitHub). This reduces the risk of human error and ensures that your flow velocity metrics are based on complete, up-to-date information.
- Value Stream Mapping (VSM): With Axify’s VSM feature, you can visualize and analyze each workflow stage. This allows you to identify bottlenecks and optimize processes, improving your team’s flow velocity by addressing inefficiencies where they occur.
- Key objective tracking: Axify’s objectives tracking feature helps align your team’s activities with strategic goals. Monitoring progress against key objectives keeps your team's efforts focused on the most impactful work, contributing to improvements in flow and development velocity.
- Software delivery forecasting: Axify’s software delivery forecasting tool leverages historical data to predict future delivery times. This helps you plan more accurately and make informed decisions that keep your project timelines on track, ultimately supporting better flow velocity by reducing uncertainty.
- DORA metrics dashboard: Axify provides a DORA metrics dashboard that tracks critical performance indicators like deployment frequency and lead time for changes. Analyzing these metrics alongside flow velocity gives you a comprehensive view of your team’s efficiency so you can sleuth out areas for improvement faster.
- Well-being tracker: Axify’s well-being tracker monitors team morale and other key indicators of team health. By ensuring that your team remains motivated and engaged, you can maintain a sustainable pace of work, which is essential for consistent and reliable flow velocity.

Wrapping Up
Flow velocity is a critical metric that provides valuable insights into how efficiently your team delivers work. By optimizing flow velocity, you can enhance your team’s productivity, ensure faster delivery of value to customers, and maintain a sustainable work pace.
However, accurately measuring and improving flow velocity can be challenging due to factors like inconsistent work item size and complex workflows.
Axify offers solid solutions to these challenges through all the features and tools we presented above.
Leveraging these features helps you gain a holistic view of your development process and make data-driven decisions that enhance speed and quality.
Ready to take your software development process to the next level?
Book a demo with Axify today and discover how our platform can help you optimize your velocity metrics and achieve continuous improvement.

