AI
17 minutes reading time

GitHub-backed research shows developers completed a coding task 55.8% faster with Copilot, but your sprint velocity may not necessarily move the same way
Fast-written code can still get stuck later in review, fail CI checks, create rework, or increase churn after merge. Even worse, you can’t see GitHub Copilot’s impact on your developer productivity inside the editor.
So you need better tools to evaluate whether Copilot improves your delivery flow without weakening software quality.
And you’re on the right page for that.
We’ll start with GitHub Copilot productivity benchmarks and where those numbers stop applying to your team. Then, you’ll learn how to build a measurement system using adoption, delivery, and productivity metrics together.
P.S. If you want to understand how Copilot fits into your broader AI tooling stack, start with our guide to measuring AI coding tools impact. It gives you the wider context before you measure Copilot alone.
The research says GitHub Copilot can speed up coding tasks in most software teams. However, that’s not an automatic guarantee of better delivery; you need to track your own team’s workflow to see the actual impact and ROI you get from this AI tool.
In the meantime, here’s what recent studies on Copilot reveal:
The takeaway is not that one study is “right” and another is “wrong.” Copilot’s impact depends on the environment around it. That brings us to the next point.
GitHub Copilot’s real impact varies because each team feeds AI-assisted work into a different delivery system. This includes different task types, review policies, codebases, CI queues, and adoption habits.
Teams with clear requirements, smaller pull requests, strong test coverage, fast reviews, and consistent adoption are more likely to turn faster coding into faster delivery. Teams with weak review practices or unstable workflows may only move the bottleneck from coding to review, QA, or bug fixing.
Here are the main reasons your results may look different from the benchmark:
At Axify, we treat AI as a system change because it changes how work enters the delivery flow. Once developers rely on AI for suggestions, tests, refactoring, or debugging, the team also needs stronger habits around context, review quality, and validation.
The teams that get the most from Copilot are usually improving the surrounding system so AI-assisted work is easier to trust, easier to review, and easier to ship safely.
GitHub Copilot can improve code quality in controlled settings. But it can also increase technical debt when teams measure output without checking what happens in review, rework, and maintenance.
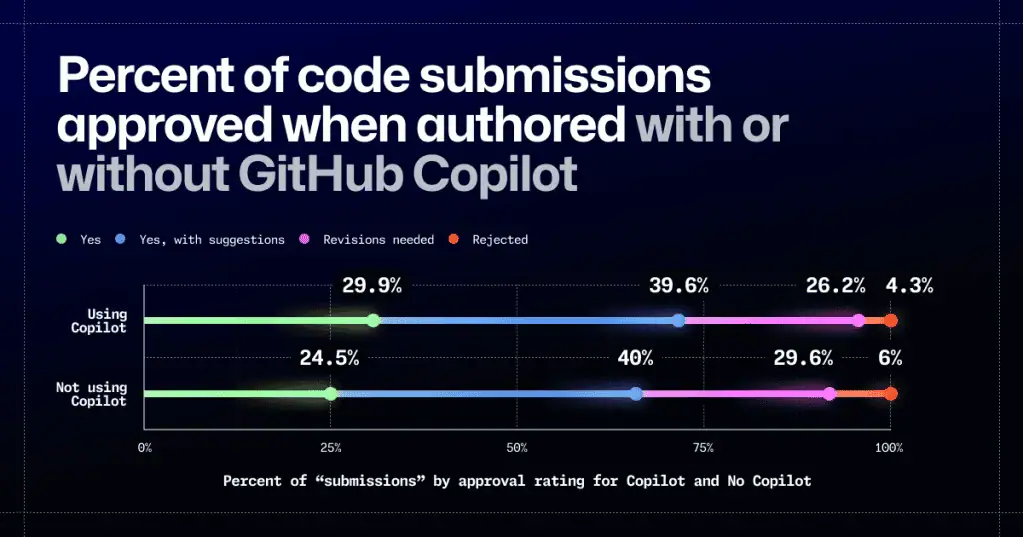
GitHub ran a randomized controlled trial with 202 experienced developers to evaluate code quality after Copilot adoption.
They found that Copilot-assisted code improved readability, reliability, maintainability, and conciseness. Reviewers were also 5% more likely to approve code written with Copilot, which matters because approval speed affects merge flow and release timing.
Source: GitHub
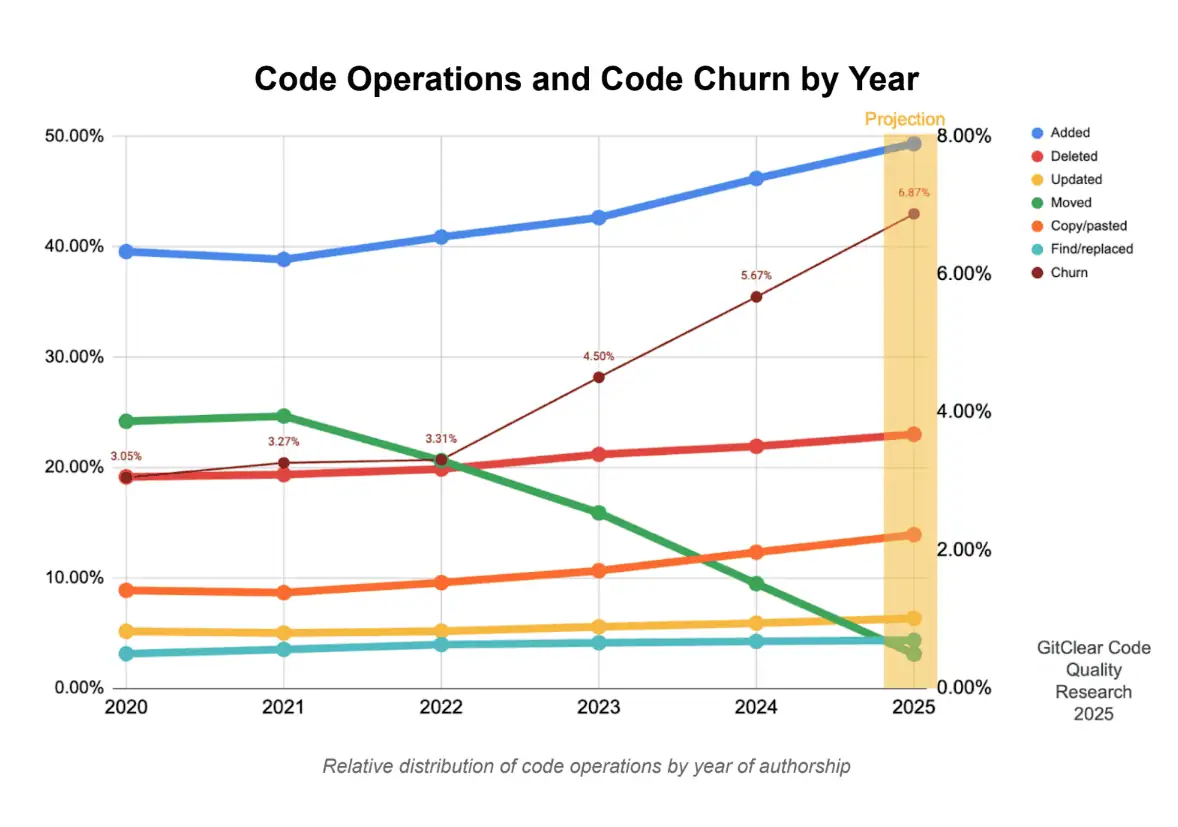
More generated code can make the codebase harder to maintain if teams accept suggestions without enough context or review discipline. GitClear analyzed 211 million changed lines and found more duplicate code blocks, more short-term churn, and fewer cases where existing code was reorganized through refactoring.
That suggests teams may be adding or rewriting code more often than improving existing code. This can make the codebase larger, more repetitive, and harder to reason about, so it can increase maintenance risk over time.
In the same dataset, “copy/pasted” code exceeded “moved” code for the first time. That suggests teams may be adding more new or duplicated code instead of reusing, moving, or refactoring existing code.
Source: THE COOP Blog
Copilot measurement needs to separate code quality at review time from maintainability over time.
The GitHub study suggests Copilot-assisted code can be easier to read, approve, and maintain when developers use it with clear tasks and proper review. So, you should track review outcomes such as approval rate, review duration, reviewer comments, and how often Copilot-assisted PRs pass review without major changes.
But the GitClear data shows why that is not enough.
Code can look acceptable in review while still increasing long-term maintenance risk if teams add more duplicate code, rewrite similar logic repeatedly, or create short-term churn after merge.
We already discussed how AI changes the software development lifecycle by speeding up development while creating new risks in review, testing, deployment, and maintenance.
So, we don’t encourage you to measure Copilot by PR volume or coding speed alone.
Instead, compare Copilot-assisted and non-assisted work using the metrics below.
To measure Copilot properly, you need to track adoption, delivery, and quality. That way, you can see whether Copilot is changing the software development process or just increasing activity inside the editor.
Adoption metrics show whether Copilot is part of your developers’ daily work or not. Here are the adoption metrics to track:
Delivery metrics show whether Copilot-assisted work moves faster through tickets, commits, PRs, reviews, merges, and deployments.
Here are the delivery metrics to track:
You don’t have to choose between speed vs. quality. Faster output only helps if review, CI, testing, and release practices prevent defects from moving downstream.
Here are the quality metrics that show whether Copilot-assisted work creates extra cleanup after the first draft:
Most software engineering teams can’t answer “Is Copilot worth it?” because you get Copilot usage data in the Copilot platform; this info is not connected with the delivery and quality data in your engineering dashboards. This triggers a slew of problems.
Here’s the timeline:
A credible GitHub Copilot ROI model compares your Copilot cost with the delivery capacity you gained, the quality risk you avoided, and the review effort you added. You should never treat “time saved while coding” as an automatic financial return.
Here are the steps you can use to build the model.
Start by benchmarking essential metrics like cycle time, PR throughput, merge frequency, review cycle length, rework rate, and change failure rate before your Copilot rollout. This gives you a stable comparison point.
Without it, you may attribute a drop in rework to Copilot, when it, in fact, comes from better requirements, stronger QA checks, or a cleaner release scope.
Next, group teams by actual usage depth; the license assignment date isn’t a useful indicator here. As we explained above, two teams may have activated their Copilot licenses simultaneously, but one of them is using Copilot daily for tests, boilerplate, and refactoring, while the other only uses it occasionally for easier tasks.
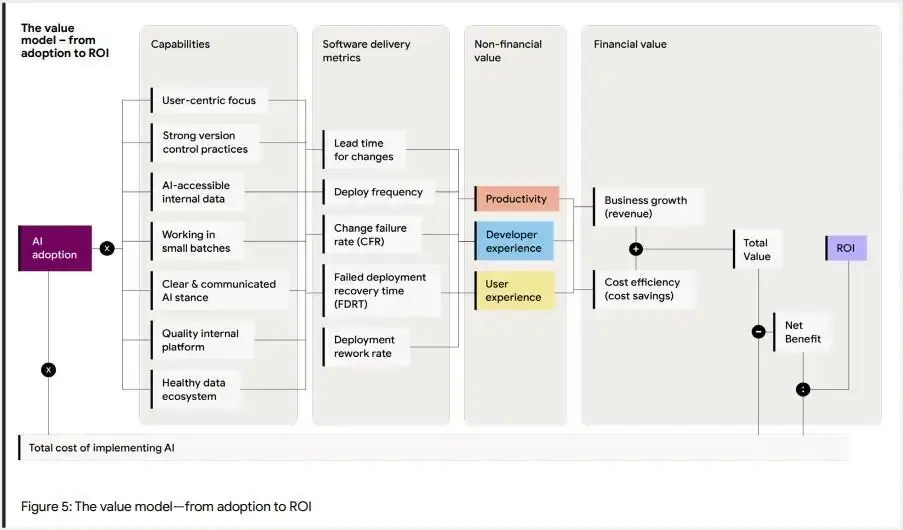
This matters because ROI is influenced by adoption quality. The DORA 2026 ROI model treats AI adoption as the first input, but it does not assume adoption turns directly into financial value. AI adoption needs supporting capabilities around it, such as:
Those capabilities determine whether Copilot usage improves DORA metrics tied to delivery speed and stability.
From there, their model connects delivery changes to non-financial value, such as productivity, developer experience, and user experience, before translating those gains into financial value through cost efficiency or revenue impact.
Source: DORA 2026
For Copilot, that means your ROI model should compare adoption depth against delivery outcomes.
So, check whether heavier Copilot usage is linked to faster delivery, stable quality, less rework, and better developer satisfaction in teams with similar work and similar engineering conditions.
Copilot may affect new features, bug fixes, refactoring, and documentation differently. That’s why the cleaner comparison is similar work before and after Copilot inside the same team.
For example, compare the bug-fix cycle time for three months before rollout with the bug-fix cycle time three months after rollout. After that, review whether your rework rate and PR review time changed in the same period.
A practical ROI model should translate delivery improvements into usable engineering capacity.
For example, if Copilot reduces review-adjusted cycle time across a large engineering group, that time can be redirected to roadmap work, platform improvements, or technical debt reduction.
But the gain should be treated as net capacity.
If review time, rework, change failure rate, or recovery time increases at the same time, part of the benefit is being consumed elsewhere in the delivery system.
This follows the logic in DORA’s 2026 ROI model, which separates the value side from the investment side:
So, a positive impact of Copilot on your productivity means this tool creates usable capacity after you account for review effort, rework, and delivery stability.
Review Copilot ROI monthly or quarterly as teams learn how to use it in real work. Early results may look uneven because developers are still learning where Copilot helps, while reviewers may spend extra time checking AI-powered code.
Then, track whether that extra effort decreases in time.
For example, teams may see better results after they improve prompts, split PRs into smaller changes, expand automated tests, or define clearer review rules for Copilot-assisted work.
Use the ROI review to make practical decisions: where Copilot spend is justified, which teams need more enablement, and where AI-assisted coding is creating extra work in review, QA, or maintenance.
After you define the right GitHub Copilot metrics, the next steps are visualizing them, interpreting them in context, and making decisions based on them.
Axify helps you do all that.
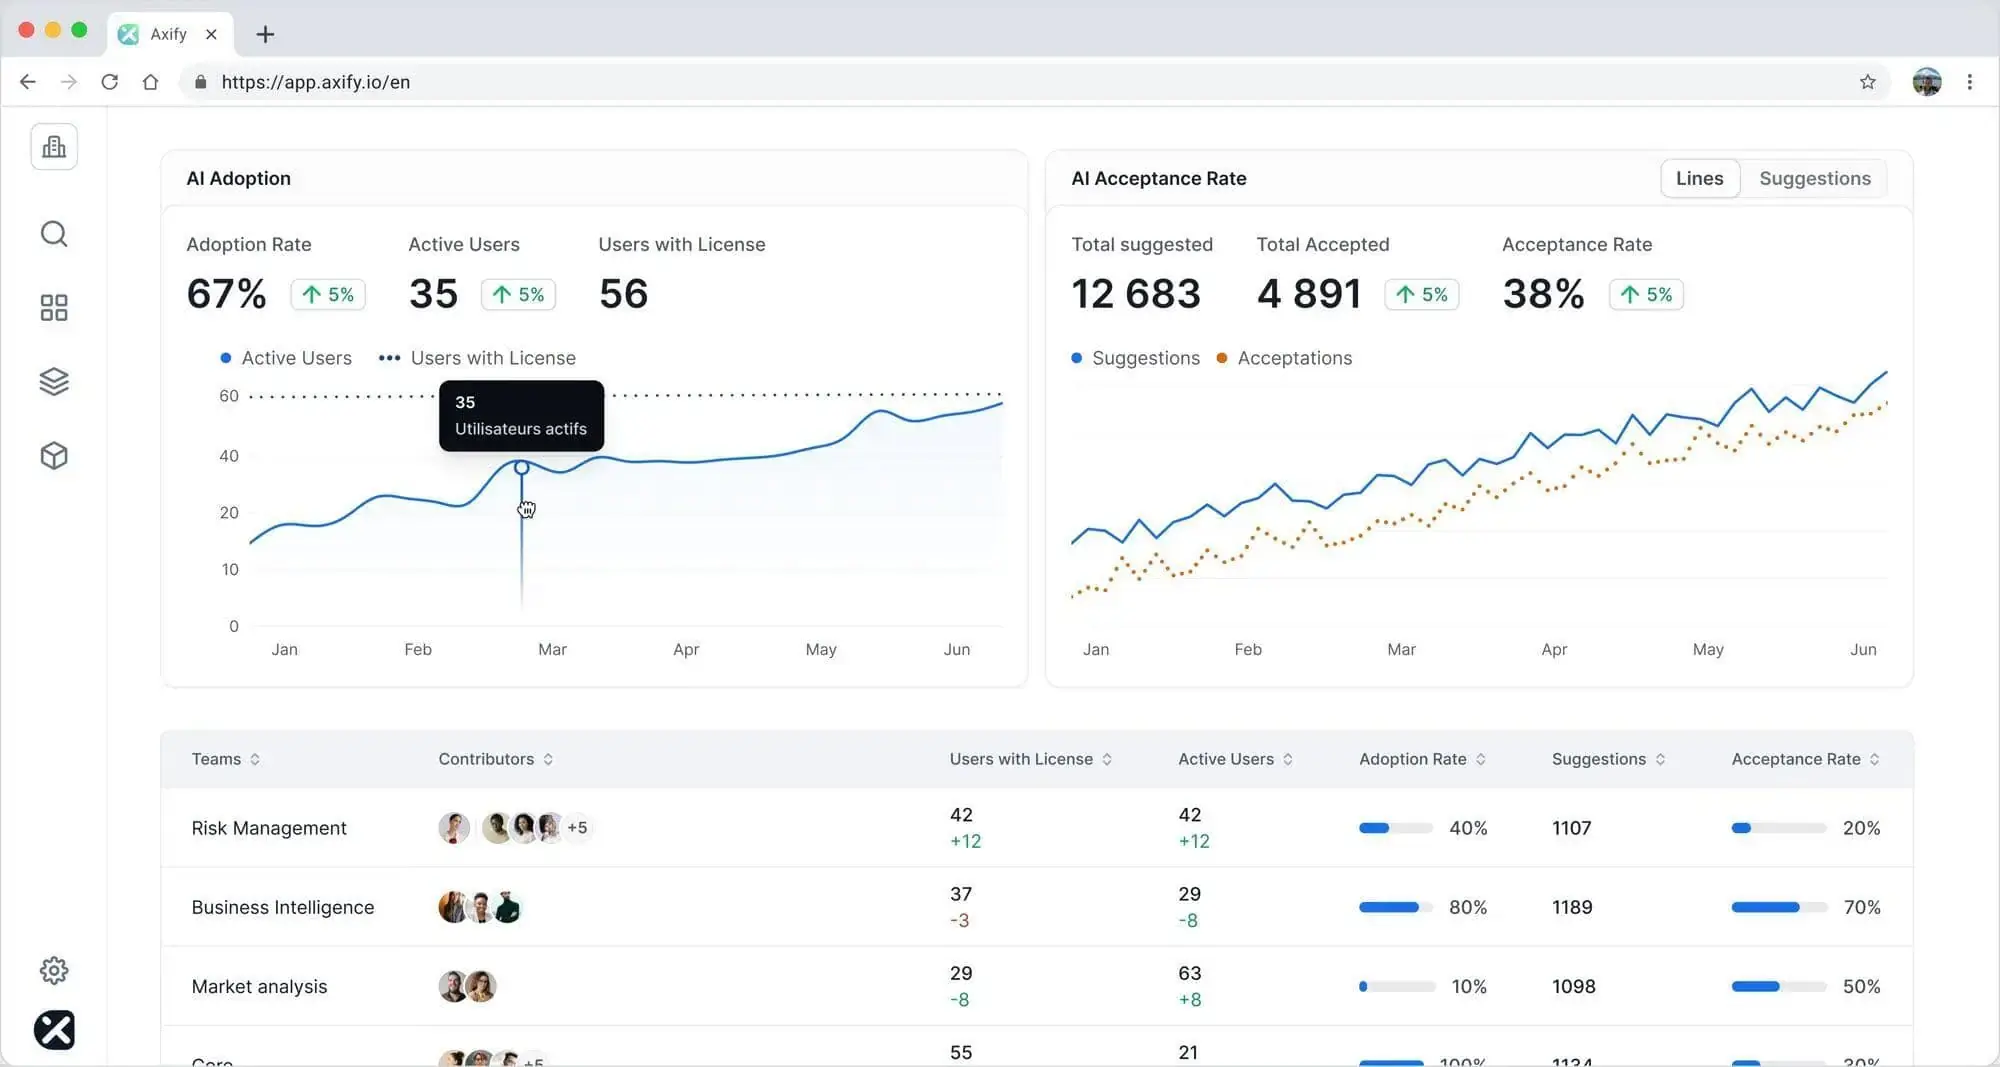
Axify's AI Adoption and Impact feature integrates directly with GitHub Copilot to pull adoption data into the same dashboard as cycle time, throughput, rework, PR quality, and delays.
Axify tracks the three DORA AI adoption dimensions: usage, confidence, and habit. Usage shows whether teams are actively using Copilot. Habit shows whether that use is repeated and embedded in daily work. Confidence is approximated through acceptance-rate signals, which help indicate whether developers trust Copilot suggestions enough to use them.
As such, you can see which teams use Copilot consistently and whether that usage connects to better delivery.
From there, Axify surfaces the correlation between Copilot adoption and engineering metrics by team, project, or business line. It also supports before-and-after AI comparisons, so you can see how equivalent task types perform, instead of relying on org-wide averages.
This helps you identify which teams generate the most Copilot value, which practices are worth repeating, and where adoption needs support rather than more licenses.
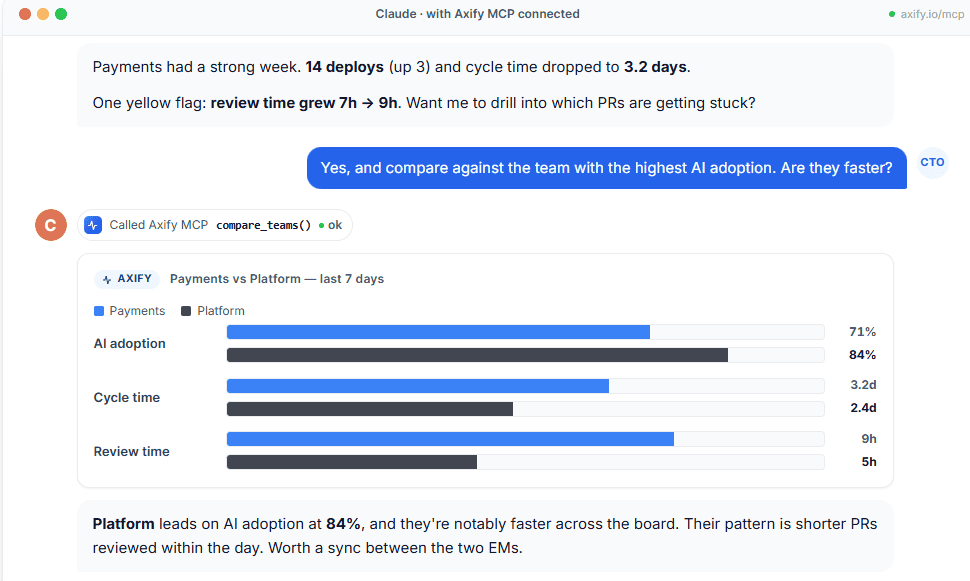
Axify MCP brings the same engineering intelligence into the AI tools your leaders already use, including Claude, Gemini, and Microsoft Copilot.
Your AI tool (in this case, GitHub Copilot) calls the Axify MCP server, gets live data, and renders the answer as a visualization. Don’t worry, you won’t see a wall of JSON.
For example, you can ask which teams have lower cycle time but lower Copilot adoption, or which team’s review time changed after Copilot adoption rose.
The MCP server pulls from Axify’s existing integrations and respects your Axify role and team permissions, so the answer stays tied to the data you are already allowed to see.
Axify Intelligence helps you understand what Copilot adoption actually changes in your delivery system. The engineering intelligence layer:
For example, it can show that Copilot-assisted work is moving faster through implementation, but more items are reopening after QA. That gives leaders a clearer signal: the issue may not be adoption, but validation rules, test coverage, or task scope.
Unlike a general-purpose AI tool, Axify Intelligence works with your engineering context: teams, workflow stages, delivery metrics, and historical patterns. It can summarize the key insight, let you explore the supporting data in dashboards, and answer follow-up questions through the conversational agent.
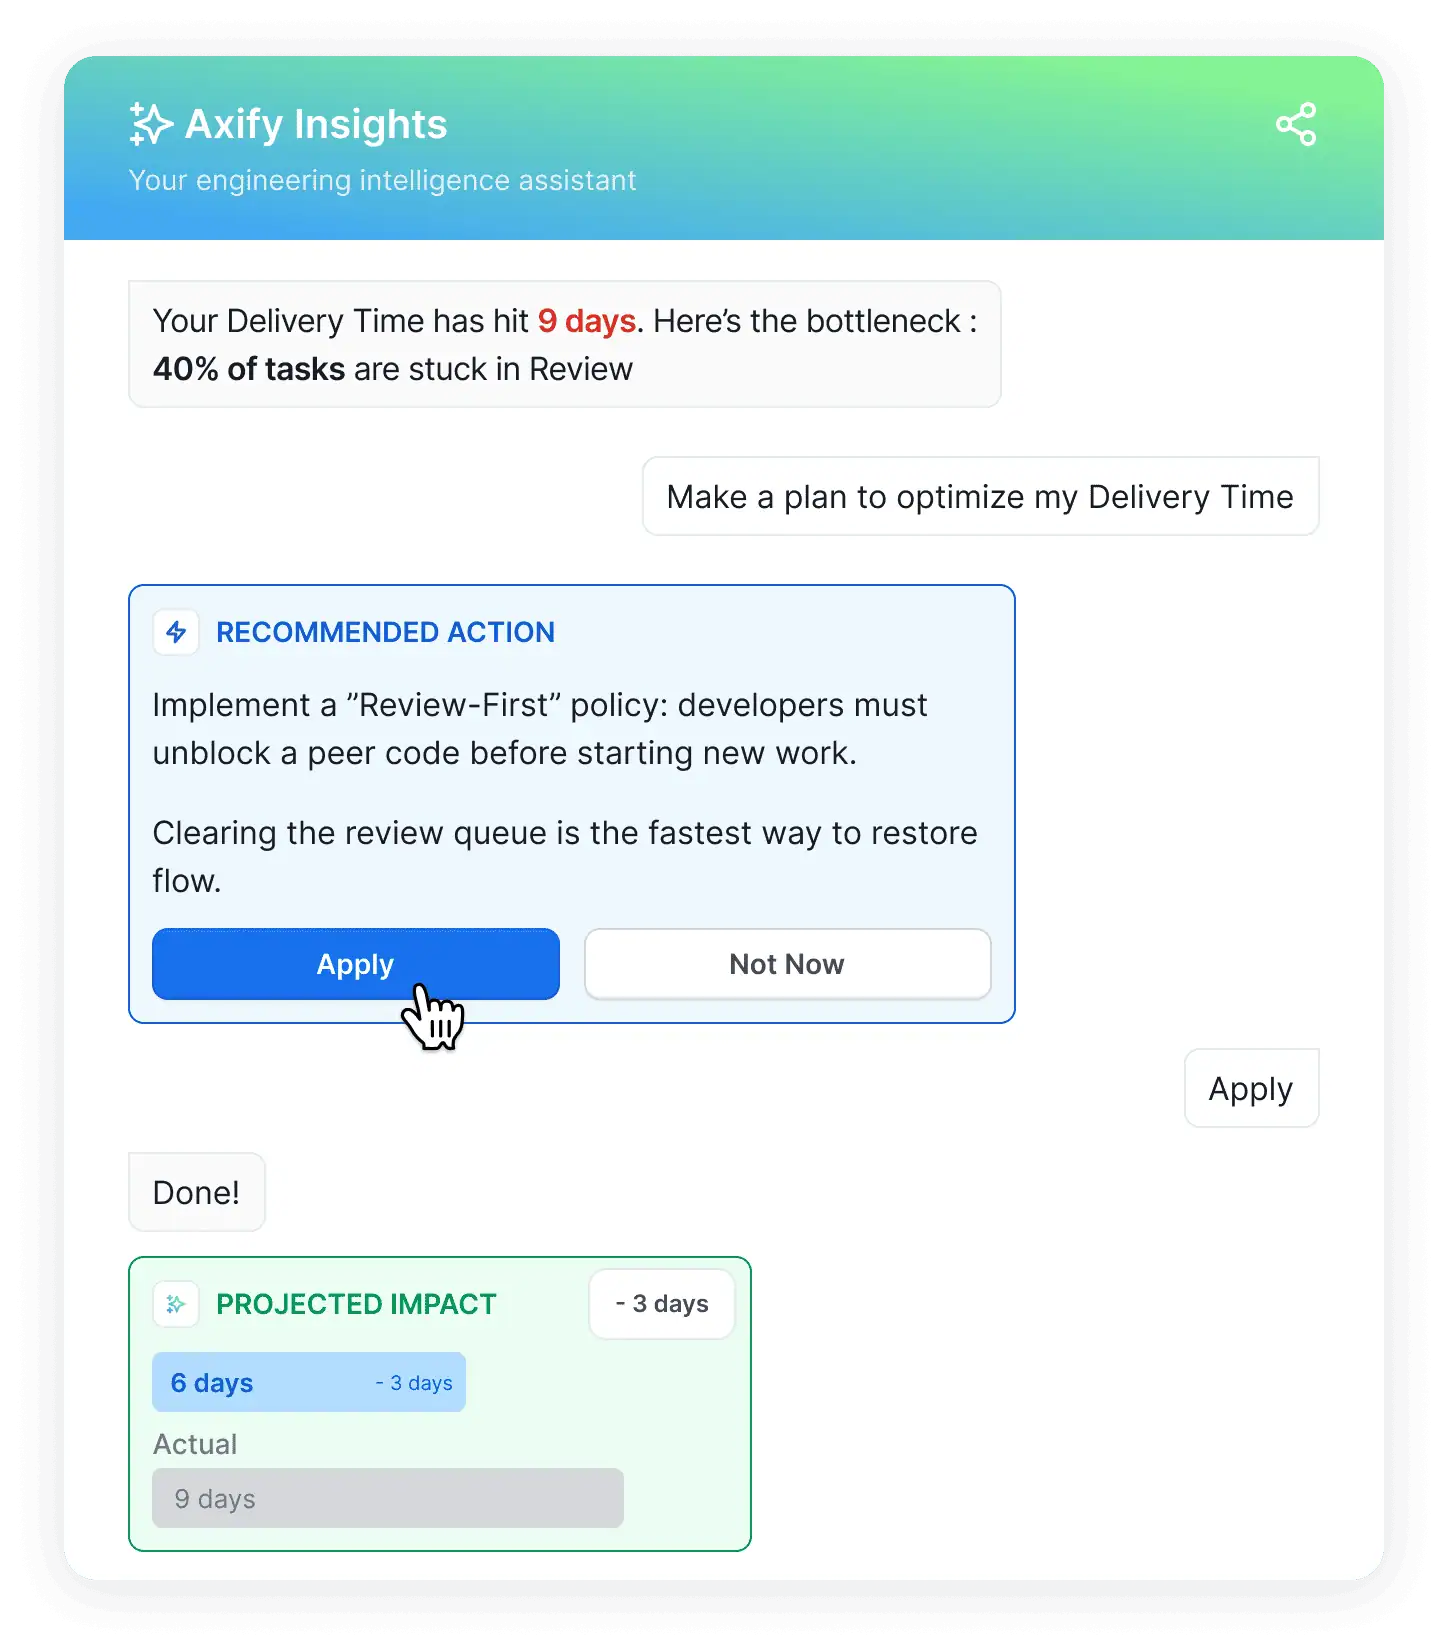
From there, Axify Intelligence recommends concrete actions, such as tightening acceptance criteria, adjusting sequencing, improving test coverage, or reducing work in progress. You can implement those recommendations directly from the Axify platform, so Copilot measurement turns into workflow improvement, not just another report.

GitHub Copilot can help developers move faster, but the real question is whether that speed survives the rest of the delivery process.
A useful measurement model connects Copilot adoption to delivery outcomes, quality signals, and team-level workflow changes. That means looking beyond acceptance rate or PR volume and asking whether Copilot-assisted work reaches review, merge, and production with less friction, less rework, and stable quality.
Contact Axify today to see how Copilot adoption connects to your real delivery data.
Teams should wait at least 60 to 90 days after active rollout before judging Copilot’s impact. That gives developers enough time to form habits, adjust prompts, and move real work through tickets, PRs, reviews, CI checks, and deployments.
Platform or developer productivity teams should own the measurement system because they can keep definitions, data sources, and dashboards consistent. Engineering managers should interpret the results for their teams because they understand the work, codebase, and delivery constraints. Executives should then use the data for budget, rollout, and renewal decisions.
You can tell by comparing Copilot adoption with review cycle length, rework rate, PR size, and cycle time. If coding starts faster but review queues grow, Copilot may be shifting effort from development into validation.
First, confirm the comparison is fair by segmenting results by team, task type, adoption depth, and review period. Then look at what high-value teams do differently, such as stronger test coverage, smaller PRs, clearer prompts, or better review rules.
If some teams still don’t benefit, don’t force the same rollout everywhere. Limit Copilot use to the tasks where it helps, provide targeted enablement, or help them implement a different AI tool. The goal is measurable delivery impact, so don’t focus on uniform adoption above anything else.
You justify Copilot spend by showing where it creates measurable delivery gains and where licenses need support or reconsideration. A credible case separates high-adoption teams, low-usage teams, and teams where faster coding increases review or rework.