Delivery Performance
10 minutes reading time


Building a high-performing software team depends on how clearly you understand what actually drives output, quality, and follow-through.
The right developer productivity metrics give you visibility into workflow efficiency, team collaboration, and how engineering effort connects to business outcomes. But those signals only matter when you look at them as part of a system.
So instead of tracking metrics in silos, you need a systems view that shows how work moves, where friction appears, and why certain tradeoffs emerge over time. And that view is shifting fast. The rise of AI tools is changing how work gets done, which means measurement has to account for new patterns in flow, review cycles, and feedback loops.
To help you out, this article brings together established research from the DORA framework, flow metrics, and SPACE, interpreted through DevEx principles and grounded in our teams’ real experience. Along the way, you’ll see how to interpret developer productivity metrics in context and decide what to adjust next.
Let's get started.
Pro tip: Want to streamline your software development lifecycle? Identifying and resolving inefficiencies is the first step! For this, you can use Axify’s developer productivity functionalities, which include DORA metrics, value stream mapping, and detailed resource allocation. All these aspects are crucial in optimizing workflows and reducing bottlenecks.


Developer productivity metrics are quantifiable measurements used to assess the efficiency and effectiveness of software developers. They track various aspects of the development process and provide insights into how well teams meet objectives and align with business outcomes.
These metrics are helpful in:
From our experience at Axify, the best approach is to focus on your team's output collectively when measuring productivity metrics. This aligns with Goodhart's Law: "When a measure becomes a target, it ceases to be a good measure."
Rather than setting rigid targets for these metrics, we suggest using them as indicators. This helps to avoid unintended consequences, like overemphasizing speed at the expense of quality.
Check out this insightful podcast episode to learn how to measure performance from your developers:
Developer productivity metrics matter to engineering leaders because they let you see how delivery capacity, quality, and effort actually translate into business outcomes. At the same time, they help you move beyond activity tracking and focus on how work flows through your engineering organization as a system.
When used well, these metrics help you act with intent across four critical areas:
Measuring developer productivity in software development involves tracking metrics that evaluate both the efficiency and effectiveness of your development processes. It’s not just about how quickly tasks are completed. We advise you to analyze how your team collaborates, maintains quality, and delivers value.
To measure developer productivity effectively, we found it’s best to focus on several key areas:
The point is to evaluate how efficiently tasks are being completed, which is a crucial parameter of developer productivity. Flow and efficiency metrics include:
Pro tip: We advise including idle time as part of the cycle times metric (which you can track in Axify). This helps provide a more comprehensive perspective on task duration by covering every phase from initiation to completion. Consequently, you can identify and address delays by getting clear insights into both active work periods and waiting times.

Collaboration and code quality metrics reflect how effectively development teams work together and maintain high coding standards. For this, we recommend tracking the following indicators:
Pro tip: Axify doesn’t track lines of code (LOC) because it can lead developers to focus on adding more code rather than improving quality. Instead, it uses frequent pull requests and quick review/merge times. Also, have your teams work in small, efficient batches to keep the code clean and encourage teamwork.
We recommend using the resource allocation feature in Axify to gain insights into how your team's resources are distributed across tasks and investment categories. The metrics that offer a detailed look at where the developer capacity is spent are:
Pro tip: To make the most of resource allocation metrics, you should regularly review WIP, throughput, and time-to-zero together. These insights will help you spot when your team is overloaded, adjust resources to prevent delays, and set priorities that keep projects on track and productivity high.
.webp?width=1600&height=1200&name=Work%20in%20progress%20(WIP).webp)
To measure developer productivity in Agile, you can use Axify to track metrics like cycle time, throughput, and WIP to assess how efficiently work moves through the development process.
In the previous section, we discussed how to measure developer productivity in software development. As you know, software development is a broad term that includes all methodologies, tools, and practices used to create software. That means it can follow various approaches, including traditional (Waterfall), Agile, DevOps, or hybrid.
Agile is specifically designed to respond to changing requirements and promote iterative work cycles. We think it's one of the best methodologies for software development because it features continuous delivery of small, functional software increments, regular feedback, and adaptation to evolving needs.
That aside, since this is a specific methodology, there are specific nuances we need to consider to effectively measure developer productivity in Agile.
You should focus on metrics that align with Agile principles of flow, collaboration, and continuous improvement. For instance:
In Agile, teams focus on metrics that reveal how work progresses through development cycles and how predictable and adaptable the process is. Key Agile productivity metrics are cycle time, lead time for changes, and throughput.
Shorter cycle time and lead time for changes show responsiveness and overall process efficiency. Together with throughput, they report the team's ability to meet project timelines and basically have faster development cycles.
Pro tip: Axify’s throughput metric is especially valuable in Agile settings for forecasting because it accurately reflects the volume of work completed. This data supports effective sprint planning and timeline predictions, which can help Agile teams manage project timelines and capacity effectively.
In Agile, working in small batches is important for maintaining a smooth flow and reducing context switching, both of which contribute to improved developer productivity. Basically, smaller, manageable tasks allow teams to respond quickly to feedback and changes. This supports Agile's focus on adaptability and efficiency.
Pro tip: We encourage rapid pull requests and review processes, which align with Agile’s emphasis on flow. This makes it easier to deliver smaller, frequent updates and keeps the development cycle moving forward.
Quality and collaboration are central to Agile productivity. Hence, continuous integration metrics are important as they provide insight into the team's ability to deliver reliable software quickly.
Monitoring these metrics helps Agile teams ensure that code quality remains high and issues are resolved promptly.
Pro tip: Axify’s deployment frequency and failed deployment recovery time metrics are the gems for Agile teams. They offer a clear view of delivery velocity, batching behavior, and issue resolution speed. This way, you can understand more about your team’s responsiveness and productivity levels.
Developer productivity is not a single problem with a single lens. Each framework below looks at a different part of how work moves, how teams operate, and how results show up over time. Understanding how these approaches work helps you choose signals that fit your operating model.
DORA and its metrics focus on how reliably and quickly software changes move into production. Its strength lies in connecting delivery speed and stability, which helps you reason about release risk and operational health.
So instead of focusing on how “busy” your teams are, DORA helps you assess whether their delivery practices support predictable outcomes.
However, its scope stays intentionally narrow. You get a clear view of delivery performance, yet limited insight into why certain issues exist upstream.

The Flow framework shifts attention to how work moves across the system. Therefore, the focus is on queues, bottlenecks, work in progress, and delays between steps. We recommend this approach because you can see where time is lost between planning, execution, review, and release.
And because this framework considers the entire workflow, it exposes friction that pure delivery metrics typically miss. That context matters, especially when progress is slow despite the fact that your teams appear productive. In this situation, you may want to look at prioritization or handoff issues, and the flow metrics that reflect them.
Developer experience frameworks add human and organizational dimensions to measurement. The SPACE framework, for example, broadens the view beyond speed by including satisfaction, collaboration, and focus.
At Axify, we like to adopt this perspective because inefficiency sometimes hides in daily friction.
In fact, around 69% of developers report losing eight hours or more per week to inefficiencies such as technical debt, poor documentation, complex processes, and lack of focus time.
So while delivery metrics show outcomes, DevEx approaches explain the conditions that create those outcomes.
Systems-based frameworks treat productivity as an interaction between tools, processes, structure, and people. Instead of isolating delivery or experience, they examine how decisions ripple across the organization.
That includes how priorities are set, how teams coordinate, and how change propagates through CI/CD pipelines.
The benefit here is coherence.
You gain a way to connect operational signals, workflow health, and team conditions without collapsing them into a single score.
Pro tip: Axify brings these perspectives together into a balanced view of delivery, flow, quality, and developer satisfaction. You get a way to operationalize insights across frameworks, so signals turn into concrete actions rather than disconnected dashboards.
Here's what that looks like for our team:

These metrics give you a combined view of delivery reliability, workflow, team conditions, and business impact. So instead of tracking isolated signals, you can see how operational performance, flow metrics, developer experience, and outcome-driven measures work together to guide better decisions.
DORA metrics give you a clear view of how reliably and efficiently software changes reach production. Taken together, they help you understand delivery speed, stability, and recovery under real operating conditions. Let’s discuss them below:
1. Deployment Frequency
Deployment frequency tracks how many times the code is pushed to production, which shows your team's ability to deliver continuous value.
High deployment frequency plays a critical role in meeting customer expectations. It shows that the development environment can handle frequent updates while still maintaining high-quality standards.
According to the DORA 2025 Report, elite teams deploy far more frequently, with 16.2% deploying on demand (multiple times per day).
Pro tip: Axify monitors how frequently your deployments are. You can follow this metric in our dashboard to pinpoint bottlenecks and ensure a continuous delivery process. When you reduce downtime between releases and accelerate development cycles, you can boost your software delivery performance.

2. Lead Time for Changes
Lead time for changes helps you track the time from a change's first commit to deployment. This means how long it takes for that committed change to reach production.
The 2025 report from DORA notes that elite teams deliver changes much faster, with 9.4% delivering in under one hour. That gives you a good perspective when tracking it through Axify.
Pro tip: Axify’s predictive analysis feature is quite important to improve flexibility and adapt quickly to changing business priorities. This is because it can help you reduce lead times.

3. Change Failure Rate
Change failure rate measures how frequently deployments result in degraded service, incidents, or rollbacks. This metric helps you assess whether speed comes at the cost of stability or whether delivery practices balance risk and reliability.
For change failure rate, elite teams sit firmly at the very low end, with 8.5% of elite teams reporting a 0-2% failure rate. This is, of course, based on the DORA 2025 report.
Pro tip: Axify tracks failure patterns across deployments so underlying causes become visible. This visibility supports targeted improvements in testing, review, and release readiness.

4. Failed Deployment Recovery Time
Think of a scenario where deployment frequency is high, but the recovery from failures lags. Well, failed deployment recovery time steps in as a critical metric by helping teams measure how fast the functionality is restored after a failed attempt.
Basically, it captures the team's resilience to maintain stability when issues arise in production. And elite teams recover from failed deployments much faster, with 21.3% recovering in under one hour.
Pro tip: Axify’s tools deliver actionable insights into failure rate trends. Use them to refine your recovery processes, improve software quality, and reduce defect rates. The goal is to minimize disruptions and ensure a reliable experience for your end users.

Flow metrics help you understand how work moves across your team, from start to finish. These metrics track the pace and efficiency of your workflow, which allows you to identify friction points and improve overall productivity. Here are the key flow metrics to track:
5. Cycle Time
Cycle time captures the total time from the beginning of a task to its completion, including waiting periods. When you track cycle time, you can identify delays in your processes and understand where work is getting stuck. Optimizing cycle time means reducing those unnecessary delays so you can streamline your development pipeline.
Pro tip: You can examine cycle time on Axify’s platform to spot bottlenecks in your workflows. These insights allow your team to minimize repetitive tasks and focus on achieving shorter lead times.

6. Work in Progress (WIP)
Let's consider how a team's productivity is affected by the number of active tasks. Work in progress metrics track these tasks to provide insight into workload distribution. The point is to prevent bottlenecks on the one hand and burnout on the other.
Pro tip: Axify’s WIP tracking feature allows you to see where you need to set effective limits. Evenly distributed tasks are important for maintaining developer satisfaction and steady team capacity.

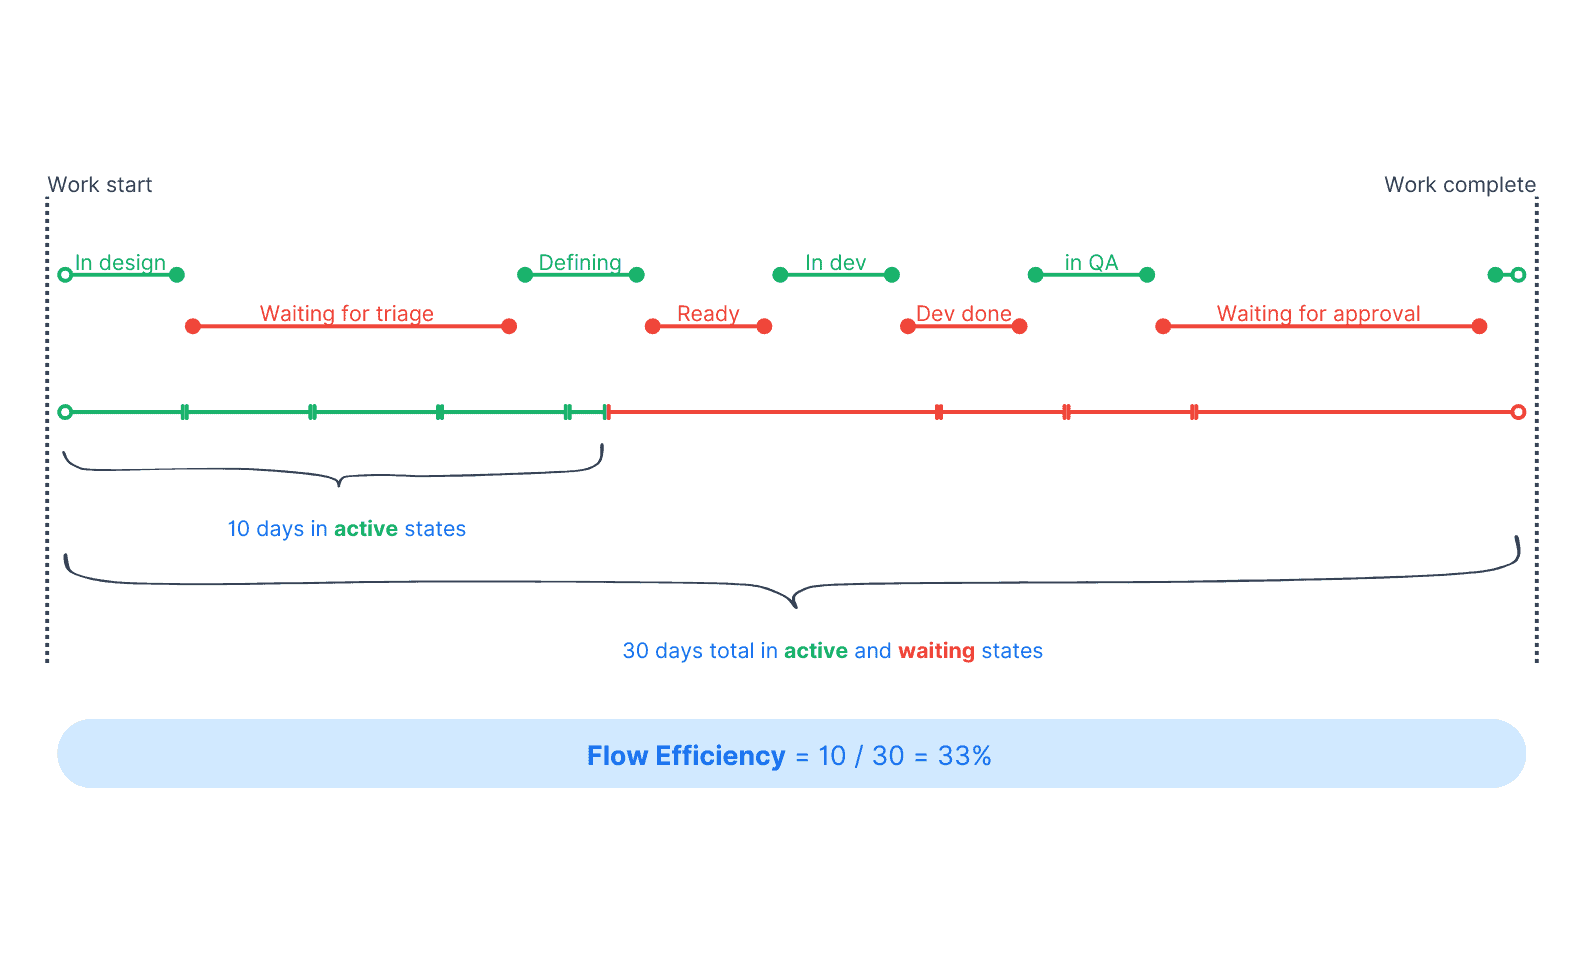
7. Flow Efficiency
Flow efficiency measures how much of the time in your cycle is spent actively working, as opposed to idle or waiting time. This metric helps you understand how well your team is using its resources and time, so you can identify potential areas of waste.
Pro tip: Axify’s platform tracks flow efficiency by showing the ratio of time spent actively working versus idle time. This allows you to make adjustments and improve your team's productivity.
8. Throughput
Throughput is just like a project dashboard where completed tasks accumulate to show the team's total progress over time. Rather than individual contributions, it reflects your team's collective output, which is useful in measuring capacity.
Pro tip: Instead of relying on story point estimates, we recommend using historical throughput data for sprint planning. This approach supports your realistic goals and helps you optimize project timelines.

Delivery and system performance metrics show how well your development environment supports your team’s ability to deliver quality software. These metrics help you identify areas where improvements in process, collaboration, or technical infrastructure can drive better outcomes.
Here are the key metrics you need to track.
9. Batch Size
Batch size measures the amount of work that’s completed and ready for integration into the system at once. We know first-hand that smaller batches create fewer dependencies and faster feedback, which leads to smoother development cycles.
Current research further supports this. Smaller pull requests (a proxy for smaller batch size) correlate with smoother review processes and fewer delays in integrating code changes.
10. Pull Request (PR) Review and Merge Time
These metrics show the speed of code reviews and reveal collaboration efficiency within the development environment. Shorter review times mean reduced context switching, which helps streamline feedback loops and improve productivity over time.
Pro tip: To enhance developer velocity in Axify, you should encourage small PRs, as they support efficient collaboration among individual developers and the entire team.

11. Handoff Load (Cross-Team Dependencies)
Handoff load tracks the complexity of interactions between teams as work moves across boundaries. In our experience, too many handoffs create friction, slow down delivery, and can lead to misalignment or delays. So, monitoring this metric helps you understand and reduce unnecessary dependencies.
12. Rework / Refactor Ratio
The rework/refactor ratio helps you gauge the need for improvements in your codebase over time. It measures the amount of time spent revisiting or modifying existing work. We encourage regular refactoring to ensure your code stays clean, maintainable, and easy to update.
This practice is supported by research showing the impact of refactoring on code quality. One piece of industry research (Microsoft context) views refactoring efforts as beneficial for readability and maintainability, with 43% of developers reporting improved readability when code was refactored.
Quality and technical health metrics provide a clear picture of how well your software is performing in production and during development. These metrics focus on the reliability of your code and the health of your development processes.
Here are the key quality metrics to track.
13. Defect Rate / Escaped Defects
This metric tracks the number of defects that make it into production. It helps you understand the effectiveness of your testing processes.
When you monitor defect rate, you can pinpoint weak spots in your development cycle and improve testing practices to reduce production errors.
14. Code Quality Signals
Code quality signals provide insight into the maintainability and readability of your codebase. These metrics look at the complexity of code, duplication, and the frequency of changes to identify areas that may become technical debt.
15. Workflow Stability
Workflow stability is a key metric that tracks the balance between tasks started and tasks completed. It provides insights into a team's ability to manage work consistently.
Pro tip: You can use workflow stability metrics to spot stages where tasks frequently hinder. Addressing these points improves flow, reduces delays, and keeps your development cycles on track for timely delivery.

Developer experience and team health are crucial factors in maintaining productivity and fostering a supportive work environment. These metrics help you understand how well your team collaborates, communicates, and balances workload.
At Axify, we typically focus on the metrics below (and we encourage our clients to do this as well).
16. Developer Satisfaction
Developer satisfaction is an important component of productivity that directly impacts developer engagement and long-term project success. In Axify, this metric is measured through tools like the team well-being tracker, which helps you evaluate developer sentiment and address potential issues early.
Pro tip: Regularly review team satisfaction insights to understand any shifts. Engage in open communication and implement feedback where possible to create a supportive, high-performing environment that retains skilled developers.

17. Interruptions & Focus Time
Interruptions and focus time track the number and impact of disruptions that affect developers' ability to concentrate.
That’s extremely important to analyze because it takes an average of about 23 minutes to fully regain focus after a context switch. High levels of interruptions can lead to cognitive overload and reduced output.
So, monitoring this metric helps you create an environment where developers can stay focused and work efficiently.
18. Review Load / Cognitive Load
Review load and cognitive load measure the mental effort required for tasks like code review, decision-making, and multitasking. Too much review load can cause burnout, while high cognitive load can slow down work and affect quality. Tracking these factors helps you manage workload distribution and optimize team performance.
19. Onboarding Velocity (Time to First Meaningful PR)
Onboarding velocity measures how quickly new developers contribute meaningfully to projects. This metric tracks the time it takes for new hires to submit their first meaningful pull request (PR). Faster onboarding means quicker integration into the team and faster project ramp-up.
Business impact and value delivery metrics provide the insights you need to connect development efforts directly to business outcomes. These metrics help you understand whether your engineering efforts are generating real, measurable value.
20. Value Delivery Ratio (New work vs. maintenance)
This metric tracks the balance between new features and maintenance work. It helps you gauge whether your team is focused on innovation or spending too much time on upkeep. A healthy ratio indicates that your team is progressing with new capabilities while maintaining system stability.
21. Predictability (Planned vs. Delivered Work)
Predictability measures how frequently the team meets its delivery commitments. It tracks the difference between what was planned and what was actually delivered. This helps you assess the team's ability to deliver on time and build confidence across the business.
Pro tip: Axify helps measure delivery predictability by evaluating metrics like cycle time, throughput, and deployment frequency. Axify allows users to monitor the completion time of tasks and track historical data to improve future predictions, which directly contributes to enhancing predictability.
22. Resource Allocation
Resource allocation gathers insights from various development activities to provide a clear view of how effort is distributed across different investment categories. We advise you to check where your resources are focused to support better decision-making aligned with corporate objectives.
Pro tip: In Axify, the resource allocation feature includes multiple tools, like value stream mapping (VSM) and software delivery forecasting. You can use them, along with metrics like WIP and time-to-zero, to gain a full picture of resource distribution and improve your project planning and efficiency.
AI-enhanced developer productivity metrics provide new insights into how artificial intelligence tools can accelerate your team's performance while maintaining high standards of quality. These metrics help you track the impact of AI on key delivery aspects and assess whether AI adoption drives measurable improvements.
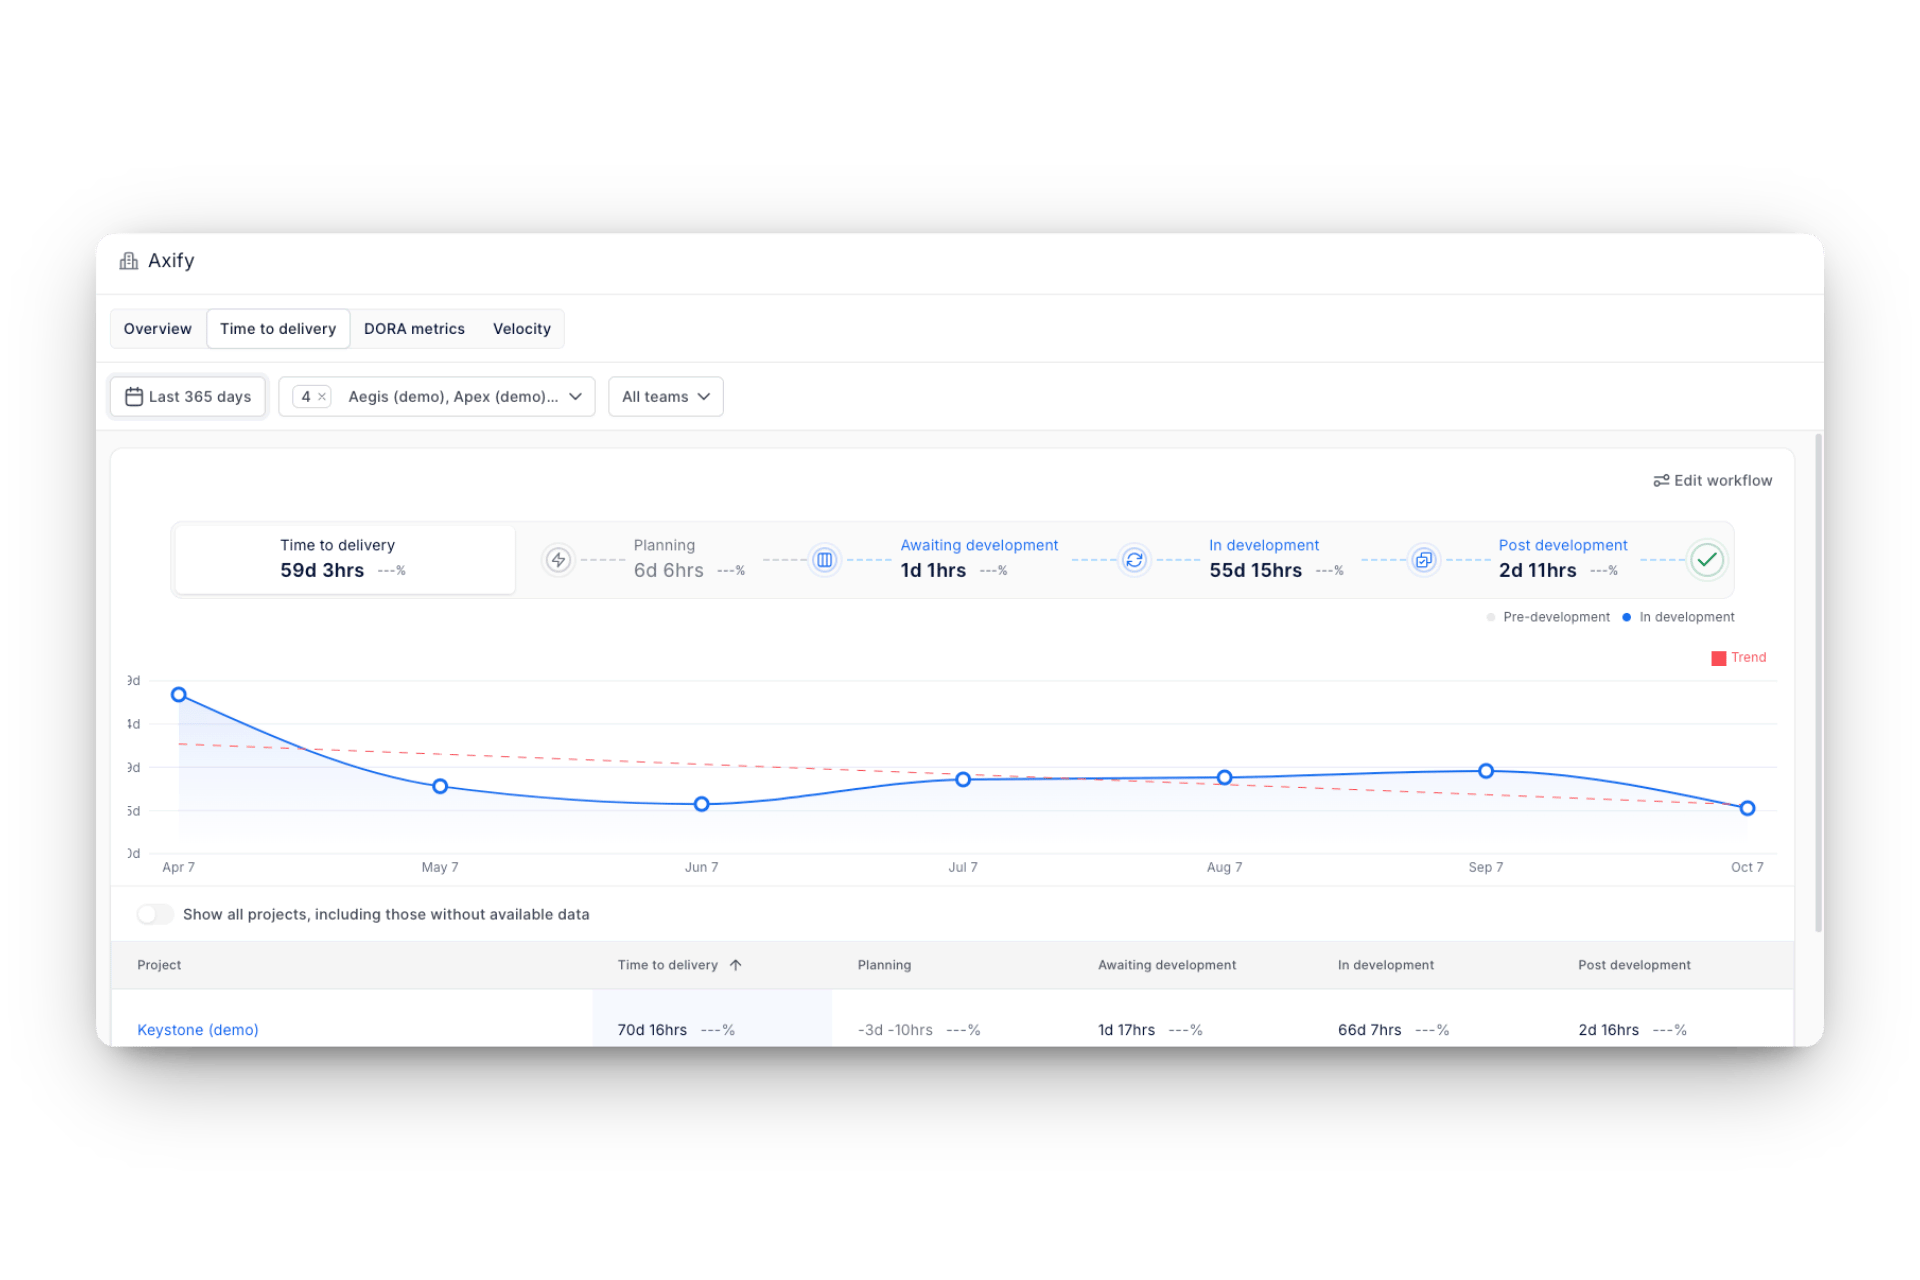
22. AI-Assisted Time to Delivery
AI-assisted time to delivery measures the impact of AI tools in speeding up development cycles. When AI automates repetitive tasks and streamlines decision-making, it can reduce the time from development to deployment.
However, we like to say that AI acts as an amplifier. If your processes are already good, it will make them better; but if they’re lacking, AI can worsen them.
This metric shows how AI influences delivery speed without sacrificing quality.
23. AI-Generated Test Coverage
AI-generated test coverage tracks the extent to which AI tools are contributing to your testing processes. AI can improve test coverage by automatically generating test cases or identifying gaps in coverage. This may lead to more reliable and faster releases in teams who implemented AI correctly.
Track this metric to understand the role of AI in maintaining a high level of software quality in your company.
24. AI Code Review Acceleration
AI code review acceleration measures how AI tools can speed up the code review process. AI can automatically identify code issues, offering suggestions, and potentially reducing manual review time.
This metric shows if, indeed, AI reduces bottlenecks in code reviews and accelerates the overall development cycle.
Pro tip: Axify’s AI Performance Comparison feature will measure and compare your team’s performance with and without AI to clearly show its impact on delivery time, DORA metrics, and other key indicators. You’ll gain a data-driven view of how AI adoption affects real-world outcomes.
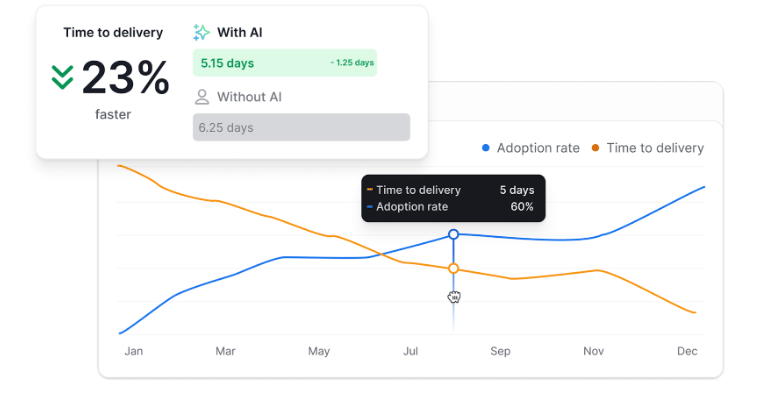
The chart above shows a 23% faster delivery time with AI. As the adoption rate (blue line) rises, delivery time (orange line) decreases.
Improving developer productivity metrics works best when you treat them as signals for action rather than as reports to review after the fact. So, our Axify A.C.T. framework gives you a practical way to move from observation to change, while keeping delivery stable and teams aligned.
Analysis starts with understanding how work actually flows through planning, build, review, and release. At this stage, the goal is clarity. So, we encourage you to look for patterns that explain delays, rework, or uneven load across teams. That context matters because surface-level metrics rarely explain root causes on their own.
Once teams begin measuring real outcomes, alignment improves. In practice, a 35% increase in team collaboration and a 25% reduction in time-to-market were observed in one study in companies using Agile approaches. These are clear signals of healthier coordination and delivery once measurement reflects reality.
With visibility in place, the next step is focus. Rather than attempting broad change, we like to first identify the few constraints that affect outcomes most. That usually means prioritizing work intake, reducing handoffs, or stabilizing review and release steps.
And by choosing improvements that teams can influence directly, progress stays tangible. This focus also reduces noise, since fewer initiatives compete for attention.
Transformation works best when change happens in small steps. So instead of large restructures, you now have to test adjustments, observe results, and adapt.
We use this approach to keep risk contained while building confidence over time. Small experiments also make cause and effect easier to understand, which strengthens decision-making.
Evidence supports this model. In studies of iterative experimentation, approaches such as A/B testing drove an additional 20% improvement in key business metrics compared with static methods. That outcome reinforces why steady iteration (not one-time fixes) leads to lasting gains.
Developer productivity metrics provide valuable insights that allow your team to identify inefficiencies, improve cycle time, and support faster development cycles. But with so many metrics available, ranging from deployment frequency and failure rate to resource allocation and developer satisfaction, tracking can become challenging.
Axify simplifies this process by bringing key metrics into one unified platform.
When you use the platform, you can monitor important metrics like flow efficiency, SPACE KPIs, and deployment frequency, all in a single view. This ensures focus on high-quality software and project timelines without constantly switching between tools.
Ready to elevate your team's productivity tracking? Book a demo with Axify today to experience a structured approach to measuring developer productivity!
