Flow
18 minutes reading time


Flow metrics have existed for years under different names in the software development world. Regardless of the framework you’re implementing, the goal should be shifting focus from isolated activities, like lines of code written, to value streams, which map how work delivers value to customers. This approach aligns your business goals with your IT capabilities and gives you visibility into how work flows through your organization.
Following flow metrics leads to:
If that sounds intriguing, you’re on the right page. This article will guide you through:
Flow items are the foundation of flow metrics. They represent the various types of work that move through your value streams, each contributing to the overall value delivered to customers.
Flow items provide a clear structure for categorizing work. And they let you track progress and performance effectively. That means you can prioritize tasks that deliver the most value, identify bottlenecks, and ensure a balanced approach to managing different types of work. As a result, you can optimize the flow of work and improve customer outcomes.
Flow metrics are key performance indicators that measure your software delivery processes' efficiency and effectiveness. The point is to understand how work flows through your value streams. That’s how you make informed decisions and optimize delivery.
The flow metrics are:
As you can see, these flow metrics are similar to other metrics commonly used to track value delivery. The point is to focus on end-to-end visibility of work as it moves through your workflow and to capture the overall impact of your team's efforts. This approach will help you:
Let’s break these benefits down.
For CIOs, IT leadership, and product management, flow metrics offer several advantages:
For example, understanding flow velocity requires considering flow load to avoid skewed team capacity and performance conclusions.
But more about that in a second.
We already explained that flow metrics help you understand and optimize your software delivery processes. In a nutshell, they represent critical aspects of how work flows through your system. Here’s a closer look at each of them and the proxy metrics you might have seen in the past:

Flow velocity measures the number of flow items completed over a specific time period. It helps you understand your teams' throughput and how quickly you can deliver value to customers.
Axify tracks a similar metric called Throughput. Our platform leverages historical throughput data to predict what your team can accomplish in future sprints. That way, you can plan your sprints better.
Benefits: Apart from gauging your delivery speed, you can identify trends over time. This metric helps you set realistic goals and expectations for release cycles. Improving flow velocity can also lead to faster time-to-market, which means your organization gains a competitive edge.
Flow time measures the total time it takes for a flow item to move from start to finish. As such, it captures the elapsed time from start to completion.

Cycle time in Axify measures the entire development process, too. However, it can also be broken down to track specific stages within the workflow, giving you more detailed insights at each step.
Benefits: Tracking flow times allows you to identify and eliminate bottlenecks, streamline processes, and enhance efficiency. Faster flow time means quicker feedback loops and more opportunities to iterate and innovate. The result is higher customer satisfaction and better alignment with business goals.
Flow efficiency measures the ratio of active working time to the total flow time. It highlights how much time you spend adding value versus waiting.
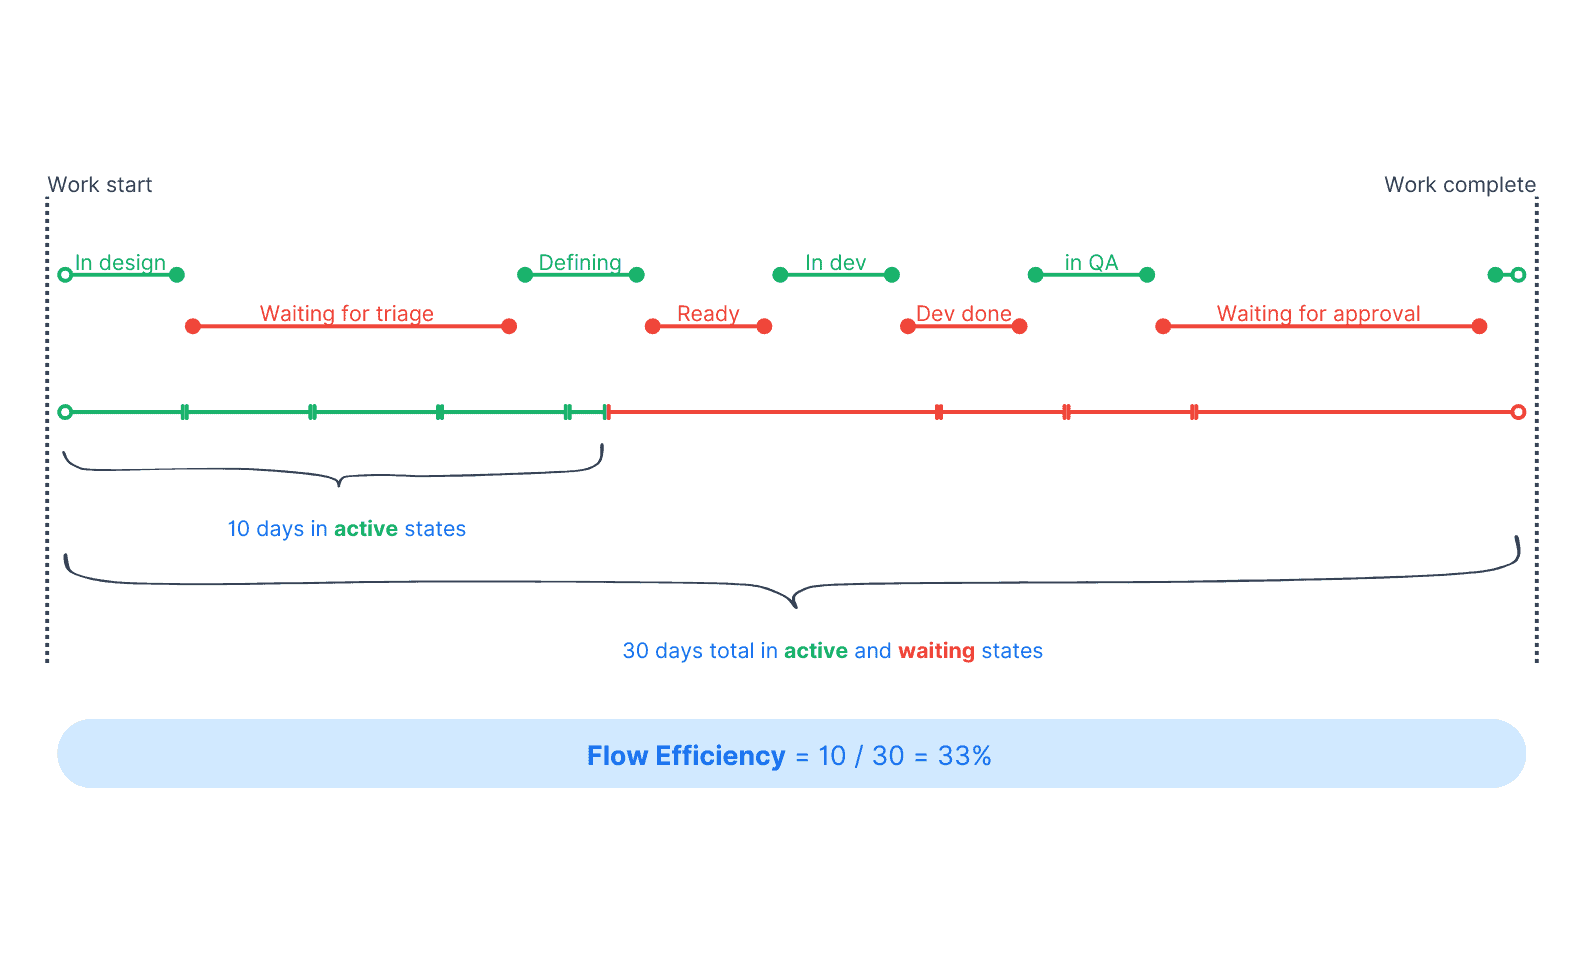
Benefits: High flow efficiency indicates that your processes are streamlined and free from unnecessary delays. Optimizing flow efficiency ensures that resources are used effectively. The point is to reduce waste, deliver faster, and create higher customer value.
Flow load represents the total number of flow items in progress within your system. Axify lets you use a better metric to track flow load called WIP (Work in Progress).
WIP gives you a clear view of your team’s active tasks so you can distribute work evenly to avoid overload and burnout. We also boast a “time-to-zero” feature that uses historical data to predict your tasks' completion, assuming no new work is added. This allows you to plan efficiently and keep the workflow moving without delays.
%20metric%20in%20Axify%20for%20software%20engineering%20teams.webp?width=1260&height=1134&name=Work%20in%20progress%20(WIP)%20metric%20in%20Axify%20for%20software%20engineering%20teams.webp)
Benefits: Managing flow load correctly means maintaining optimal productivity and preventing overload. Too much WIP leads to burnout, errors, and scattered focus. Therefore, your teams can deliver high-quality work consistently and respond effectively to priority changes.
Flow distribution measures the proportion of different types of flow items (features, defects, risks, and debt) in your value stream.
Axify allows you to track a similar KPI called issue-type time investment. This helps you identify if you're focusing too heavily on one type of work while neglecting others. Leverage this insight to balance your tasks and priorities and maintain smooth progress without bottlenecks.

Benefits: Analyzing flow distribution leads to a balanced approach to managing innovation, maintenance, and risk mitigation. This metric helps you align work with strategic priorities to allocate resources effectively and meet your business objectives. Maintaining a healthy flow distribution allows you to address customer needs while managing technical debt and potential risks.
Flow predictability measures the consistency and reliability of your product delivery rate, focusing on how accurately you can forecast delivery times and outcomes. While technically, this metric is not included in the flow framework, it is part of SAFe 5.1.
Benefits: High flow predictability builds trust with business stakeholders and customers because it means reliable delivery schedules that reduce uncertainty. Improving predictability also means making better-informed decisions, setting realistic expectations, and enhancing collaboration across teams. This metric helps you identify variability in your processes and take corrective actions.

Image source: SAFe and Scaled Agile
Flow and DORA metrics are essential for evaluating software delivery performance, but they focus on different process aspects.
Flow metrics measure the flow of work through your value streams. As we explained above, they emphasize the efficiency and effectiveness of the entire delivery process. You get actionable insights into how work moves from concept to completion, which allows you to focus on value creation and business goal alignment.
DORA metrics, developed by the DevOps Research and Assessment (DORA) team, focus on the performance of DevOps practices. They measure teams' ability to deliver software quickly and reliably, emphasizing speed, stability, and operational excellence.

Here’s how each flow metric compares to other standard metrics in your DevOps dashboard:
Unique edge: While flow velocity gives a holistic view of the productivity and efficiency across all types of work being processed, deployment frequency looks explicitly at how fast the team can push updates to production, which is a subset of the overall flow. Development velocity zooms in even further, highlighting the speed and efficiency of the coding process itself before any deployment actions.
Example: A team might have a high deployment frequency but low flow velocity if they deploy small, incremental changes. Flow velocity can help identify if significant value is being delivered or if more focus is needed on impactful features.

Unique edge: Flow time focuses on the entire process, from start to completion, while lead time for changes measures start to completion regarding code changes. Flow time helps you identify bottlenecks throughout the workflow, including upstream activities like planning and design.
Example: If a team has a short lead time for changes but a long flow time, this could indicate that work items are too large and should be broken down into smaller, more manageable tasks. Large items usually require multiple pull requests to complete, which means longer flow times and slower delivery.
Unique edge: Flow predictability is critical to reliable sprint planning and ensuring that your team can meet deadlines and deliver consistently. Cycle time, on the other hand, focuses on the speed of individual tasks. Improving cycle time helps streamline changes, which in turn improves flow predictability by ensuring that the team consistently makes progress toward its objectives.
Example: A team with fast average cycle times but low flow predictability might complete tasks quickly but still struggle to meet overall project timelines due to inconsistent delivery. That can seem counterintuitive at first, but even if a team has fast cycle times on average, there could be a lot of variation between tasks. Some might be completed very quickly, while others take much longer. The team can also prioritize smaller, faster, but less important tasks that inflate average cycle time. That’s why it’s important to consider flow predictability as well and plan better sprints.

If you’re not yet sure how to use flow metrics in practice, here are some solid examples from our clients at Axify:
A software development team noticed that, despite working full days, their output seemed low compared to the effort being expended. When they started monitoring flow velocity, they noticed they completed certain items slower than expected, which explained the delivery delays.
Action taken: The team implemented the SPIDR technique to break down large work items into smaller, more manageable tasks. Here’s what SPIDR stands for:

Outcome: Applying the SPIDR technique reduced the time it took to complete each item and, therefore, improved the overall flow of work. As a result, they started delivering features more consistently.
An e-commerce company faced extended delivery times for new platform features, which slowed its ability to roll out enhancements and updates.
Action taken: Analyzing the flow time of each feature from conception to deployment helped them identify a persistent delay in the deployment phase, which relied on manual intervention. They automated this stage by implementing a continuous deployment process, streamlining automatic deployments without the need for human intervention. This solution improved the workflow and reduced unnecessary waiting time.
Outcome: These changes reduced the average flow time by 30%, enabling faster feature deployment and a more responsive development cycle.
A mobile app development team was frustrated by the slow pace of progress despite long work hours. Flow efficiency metrics revealed that too many tasks were in progress at once (high WIP), which led to constant context switching and reduced overall productivity.
Action taken: The team reduced their work in progress by limiting the number of active tasks and introducing pair programming. This helped minimize context switching and allowed developers to focus more deeply on individual tasks.
Outcome: These changes significantly improved flow efficiency, allowing the team to complete tasks faster and speed up the delivery of new app updates.
A software development company found that product release schedules were frequently delayed, resulting in customer frustration and lost revenue opportunities. The company examined flow load metrics and discovered that its teams were handling too many tasks simultaneously. This unbalanced multitasking led to inefficiencies and reduced productivity.
Action taken: The agency implemented a Kanban system to limit WIP and introduced regular WIP reviews to adjust loads dynamically based on current capacity.
Outcome: Reducing WIP led to a 25% increase in flow velocity. This improvement translated into a more consistent delivery of features, helping the company better meet its release deadlines. Due to timely feature rollouts, customer satisfaction also improved.
An IT service provider noticed a discrepancy between the amount of work done and the impact on business goals. Flow distribution metrics showed an overwhelming focus on handling defects, with very little time spent on new features or addressing technical debt.
Action taken: Management adjusted their strategy to allocate more time to reduce technical debt, even if it meant sacrificing time spent on new feature development in the short term. Prioritizing technical debt in the short term allowed them to create more capacity for future feature development. In other words, they improved their “innovation rate”.
Outcome: This realignment improved product offerings and reduced system downtime by 27%.
A financial technology firm struggled with unpredictability in its software releases, affecting its client credibility.
Action taken: The firm stopped using relative estimation (such as story points) and switched to tracking issue count. Using historical flow velocity (throughput) as a benchmark allowed them to gauge how many items they could realistically complete in a sprint, which meant more accurate sprint planning.
Outcome: This approach resulted in more predictable software releases, which restored client trust and enhanced the firm's internal planning capabilities.
While flow metrics offer valuable insights into software delivery processes, implementing and using these metrics is not free of challenges.
Gathering accurate and comprehensive data for flow metrics can be difficult. Incomplete or incorrect data can lead to misleading conclusions and ineffective decision-making.
Solution: Implement robust data collection processes and ensure all team members understand the importance of accurate data entry. Axify helps you capture data consistently across the entire value stream.
Flow metrics must be interpreted within the context of your specific organization and projects. Metrics viewed in isolation can lead to incorrect assumptions about team performance.
Solution: Always analyze flow metrics in relation to other metrics and organizational goals. Use metrics to generate discussions and explore underlying causes rather than making immediate judgments.
Axify helps you get a bird’s-eye view of all your metrics thanks to an intuitive dashboard. Besides, our Daily Digest feature allows your team to prioritize high-risk items correctly.

Focusing too heavily on one metric can lead to imbalances in the workflow. For example, prioritizing flow velocity might cause teams to overlook quality.
Solution: Monitor all flow metrics together to maintain a balanced view. Use them to drive holistic efficiency, quality, and value delivery improvements, ensuring that no single metric dominates decision-making.
Axify, for example, uses a science-driven approach to help you prioritize the most important software development metrics to follow. Axify also integrates with several platforms like Jira, GitLab, and GitHub. That means you can aggregate all the metrics from all your platforms in one place.
This will help you make better decisions because you can get more precise, actionable insights.
Implementing flow metrics can be complex, requiring processes, tools, and mindset changes. Organizations may struggle with integrating metrics into their existing workflows.
Start small and scale gradually. Begin with a few key metrics and expand as teams become more comfortable. Provide training and support to help teams understand and utilize metrics effectively.
Again, Axify can help you tackle all that because our intuitive metrics dashboard is easy for every team member to understand. Plus, we offer a unique well-being tracker that gauges your team’s happiness and helps each member perform better.
You can also use our software delivery forecasting to predict your delivery dates better and keep all stakeholders happy.
![]()
Ensuring that flow metrics align with broader business objectives can be challenging. Metrics that do not reflect strategic priorities may lead to misaligned efforts.
Review and adjust flow metrics regularly to ensure they are aligned with organizational goals. Engage stakeholders from various levels to ensure metrics reflect technical and business priorities.
Axify is ready to assist with a new OKR tracker that helps you monitor objectives and key results. While objectives imply a longer-term outlook or goal, key performance indicators will change more frequently. And that’s why keeping an eye on them together is essential.
![]()