DORA Metrics
18 minutes reading time

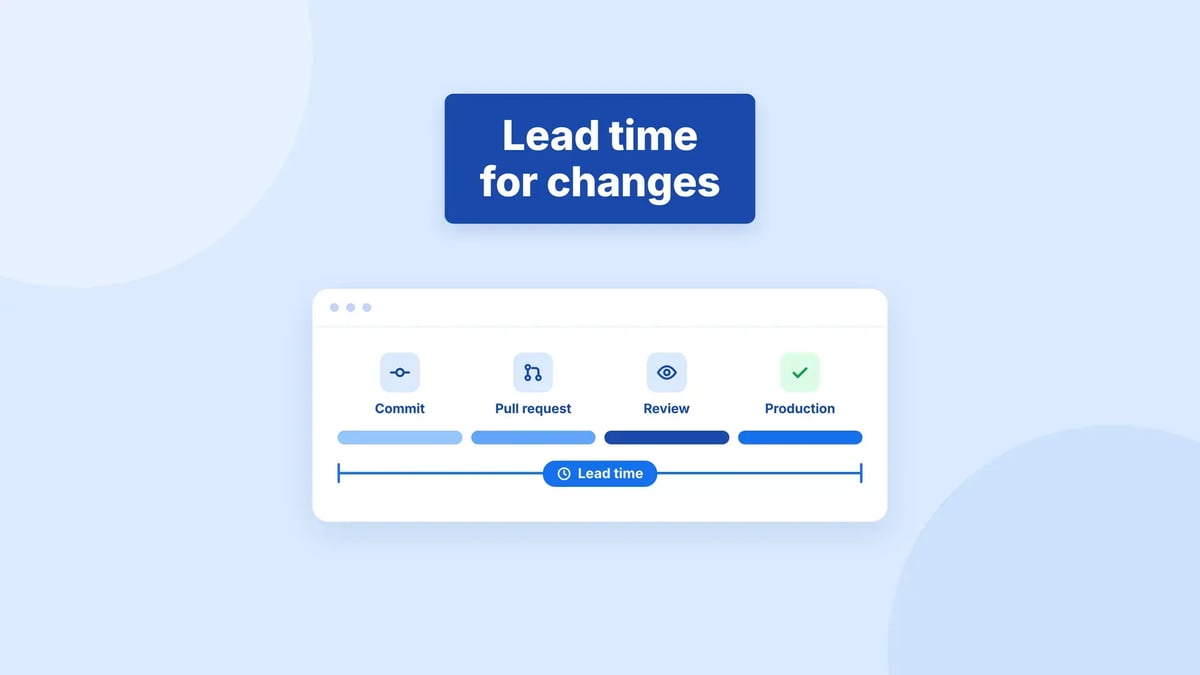
Lead time for changes (LTFC) measures the average time from the first commit in the development environment until the change is successfully running in production.
That includes time spent waiting. Engineering teams might write code faster with AI coding assistants, but a pull request can still sit for days before code review. And once it’s approved, the change may have to wait for the next scheduled release.
In this guide, we'll show you how to measure LTFC and find where changes get held up. You’ll also learn how to read it alongside the other DORA metrics and reduce delays without increasing release failures.
Let's get started!
DORA metrics are five software delivery performance metrics from the DevOps Research and Assessment program. They show how quickly your team moves code changes into production, how often deployments cause problems, and how quickly you recover.
The five metrics are:
DORA’s current framework splits these into throughput and instability. Throughput covers deployment frequency, LTFC, and failed deployment recovery time. Together, they describe the speed of delivering changes, including corrective changes after a failure.
Change failure rate and deployment rework rate describe instability. Lower values indicate more reliable releases with fewer failures and unplanned fixes.
We encourage you to read all five together. If your deployment pipeline moves changes faster while failure and rework rates rise, check what’s causing those production problems before pushing for more releases.
This leads us to the main point of this guide.
As mentioned above, lead time for changes measures how long it takes for a change to appear in the production environment.
Imagine that you are developing a feature. You took it to the sprint, then someone started working on it. After the developer is satisfied, they open the merge request, it gets reviewed, and finally, your feature lands in the main branch.
How long does it take to go from commit to main to release to production? Well, that is the lead time for that change. From our experience, less is better.
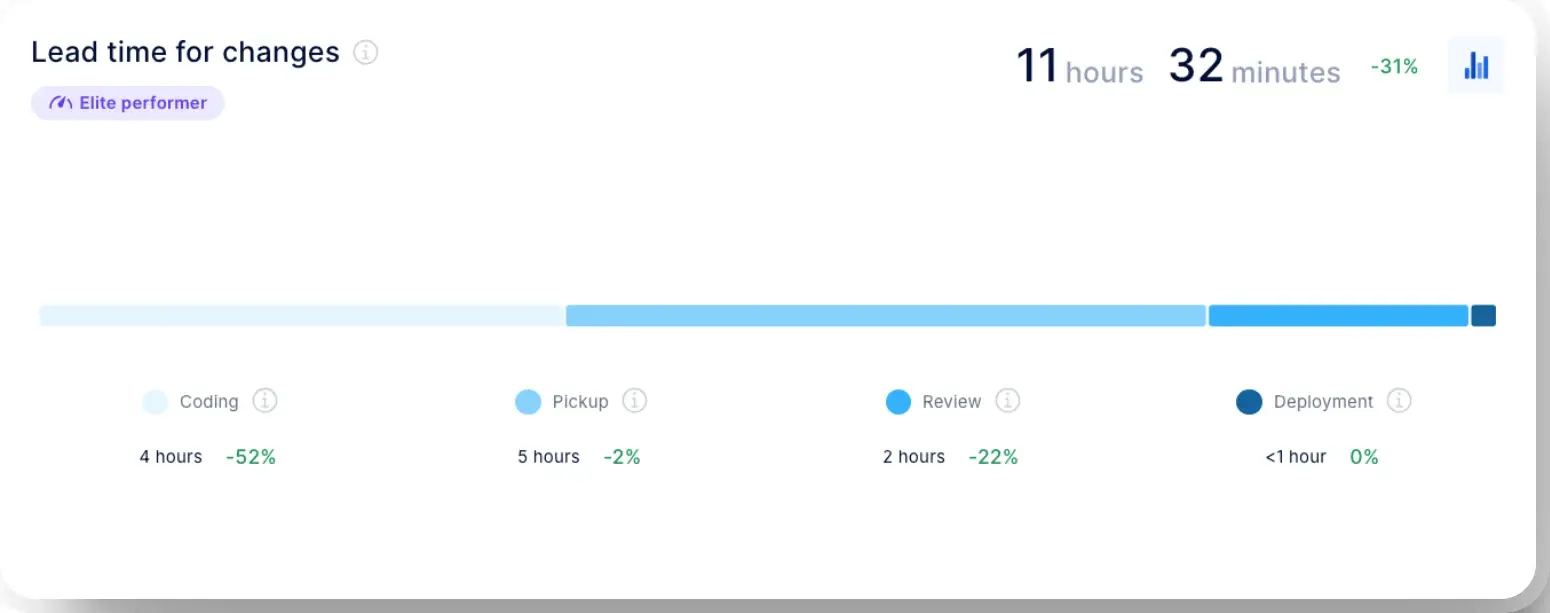
Coding, pickup, review, and deployment are the four stages that affect lead time for changes.
This metric includes both the work on a change and the time it spends waiting after the first commit. Breaking it into stages helps you see where changes get held up in your software development process.
Here are the four stages you should check:
AI coding assistants may shorten coding time, while the extra checking they create can lengthen review. DORA’s 2026 report on the ROI of AI-assisted software development calls the work of reviewing AI-generated code a “verification tax,” one of the reasons productivity can dip before the gains show up. When that review work piles up, it shows in LTFC. So, we recommend checking whether faster coding is followed by longer queues or reviews.
LTFC helps engineering leaders assess delivery velocity, set realistic release expectations, and decide which delays deserve attention first.
More importantly, it gives you evidence for staffing and process decisions.
Historical trends also help you assess delivery commitments. A rising LTFC can warn you that the current release plan needs adjusting. After changing the process, you can check whether delays actually decreased while failure rates stayed stable.
Pro tip: From what we've seen recently, measuring LTFC is becoming more important as teams use AI to write code faster. The time you saved coding can disappear if changes spend longer waiting for review, testing, or deployment. Tracking LTFC helps you see whether faster coding actually shortens delivery or just shifts the delay to another stage.
Recent research points the same way. GitLab’s 2026 survey of 1,528 developers and technology buyers found that 79% agree AI has improved individual developer productivity, but that the overall software delivery process hasn’t accelerated at the same pace. Tracking LTFC helps leaders check whether time saved writing code carries through to production.
To measure LTFC, subtract the timestamp of the first commit for a change from the timestamp of its successful production deployment. This follows DORA’s commit-to-production definition.
To calculate it manually, follow these steps:
| LTFC for one change = successful production deployment time − first commit time |
Let’s suppose you track these two changes:
The average LTFC across those two changes is 9.5 days, calculated as (14 + 5) ÷ 2.
Repeat this calculation for changes deployed during a consistent reporting period, such as a week or month. Track the same application or service over time so changes in the data reflect its software delivery process.
In Axify, you select your team, the production environment, and a reporting period, and LTFC is calculated for you from your Git and deployment data. In the example below, LTFC is 18 hours and 1 minute. Its breakdown includes six hours of pickup time and four hours of review time, which gives you specific stages to investigate.
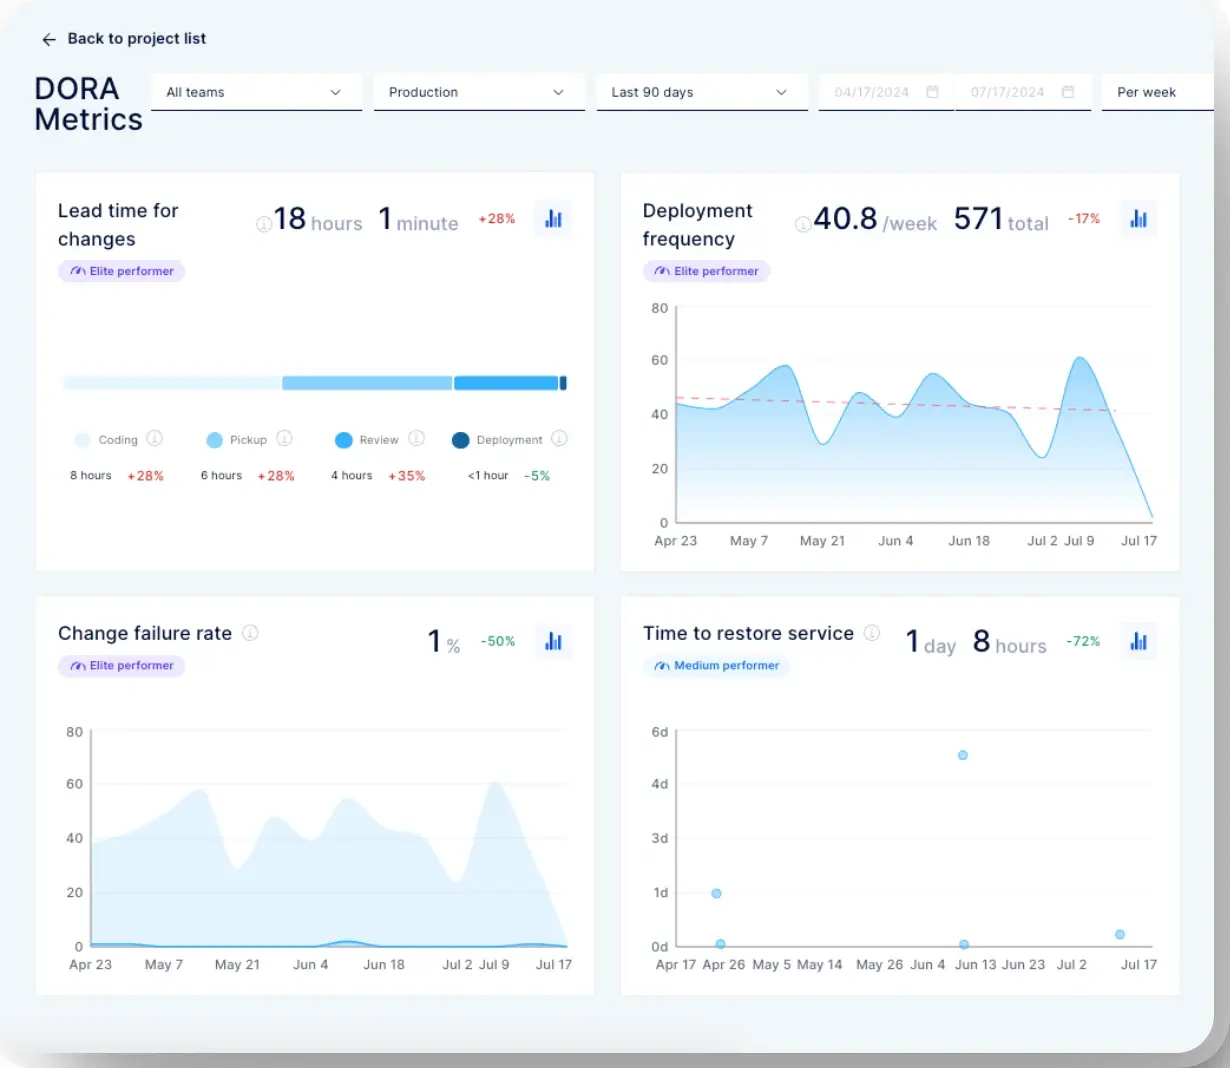
The same dashboard shows deployment frequency, change failure rate, and time to restore service, so you can check delivery speed alongside release reliability.
This is the kind of visibility that helped Newforma cut its lead time for changes by 63% and deliver 22X more often over five months, by using DORA metrics and value stream mapping to find where work was getting stuck.
To implement LTFC tracking, connect your repository and deployment records so you can follow each change through delivery. Start with one application or service, then check that the recorded times match what actually happened.
Here are the steps to set it up:
You can use this checklist before relying on the dashboard:
| Pre-production checks | Production readiness checks | LTFC incident checks |
|---|---|---|
| Confirm that CI records start and finish events for build and test stages. | Test the rollback procedure and make the instructions easy for responders to find. | Identify the latest production deployments and their associated change IDs. |
| Attach commit references, pipeline details, and build IDs to each artifact. | Check that deployment incident alerts reach the correct on-call team. | Compare deployment times with when the incident began to identify potentially related changes. |
| Record feature flag activations separately from production deployment events. | Document how changes progress through canary deployments or staged rollouts. | Review current feature flag settings and recent activation history. |
| Configure deployment health checks and readiness probes to confirm the application can serve traffic. | Include security scanning in the pipeline, with non-blocking checks only where the risk assessment permits them. | Follow the recovery procedure to roll back a deployment or change a feature flag when needed. |
| Connect deployment records with application traces so teams can investigate what changed. | Retain change histories and audit logs needed for investigation and compliance reviews. | Log the timing of recovery actions for the incident review and recovery-time calculations. |
A lead time for changes of less than one day is what DORA’s 2024 Accelerate State of DevOps report considered elite. High performers delivered changes in one day to one week.
In 2025, DORA replaced the performance tiers with seven team archetypes, while still publishing how respondents’ lead times are distributed.
| DORA report | How performance is presented | LTFC benchmarks |
|---|---|---|
| 2024 | Four performance clusters based on software delivery metrics. | Elite under one day; high one day to one week; medium one week to one month; low one month to six months. |
| 2025 | Seven team archetypes, plus survey distributions for individual metrics. | Only 9.4% of respondents reported an LTFC under one hour. 31.9% reported one day to one week, and 43.5% needed more than one week. |
The change in 2025 matters because the archetypes consider delivery speed alongside reliability, product performance, friction, and burnout. They describe different working conditions and results, without assigning an “elite” label based on the previous four-metric clusters.
To assess your software delivery performance, use the numerical benchmarks as context and compare the same application over time. If LTFC falls from five days to two while failure and rework rates remain stable, that’s useful progress. DORA itself recommends measuring one application or service at a time and improving its performance over time, not competing against other teams.
AI can shorten LTFC by helping teams finish coding, prepare tests, and review changes faster after the first commit. For example, it can draft tests for an existing change or summarize a pull request to help reviewers understand what changed.
Those gains depend on what happens next. If tests run sooner and reviewers approve the change earlier, it can reach production faster. But if completed changes still wait until Friday’s release window, faster coding may have little effect on LTFC.
The 2025 DORA report does not set separate LTFC benchmarks for teams using AI. Use your application’s own baseline to assess whether adoption has shortened delivery.
To measure the improvement, compare LTFC and its stage times before and after introducing AI for the same application. Check failure and rework rates alongside them so faster delivery doesn’t hide additional corrective work.
High LTFC usually comes from large pull requests, slow reviews, manual testing and approval queues, unreliable CI/CD pipelines, or infrequent production releases.
The table below connects these causes to the delays you’ll see and the decisions engineering leaders should review.
| Cause | What you’ll see | What leaders should investigate |
|---|---|---|
| Large pull requests | Changes take days to review and need several rounds of revisions. | Check whether work can be split into smaller, independently deployable changes. |
| Overloaded reviewers | Pull requests wait for attention while reviewers handle feature work and incidents. | Reserve review capacity and check whether approvals depend on too few people. |
| Manual testing and approval gates | Changes queue for testers or wait for sign-off after checks pass. | Separate testing time from approval wait time. Identify repeatable checks that can be automated. |
| Unreliable CI/CD pipelines | Builds fail repeatedly, tests need rerunning, or jobs wait for available runners. | Assign ownership for recurring failures and review runner capacity and test environment reliability. |
| Infrequent releases | Approved changes sit until the next release, sometimes every two weeks. | Check which constraints require fixed release windows and where smaller, more frequent deployments are practical. |
| Cross-team dependencies | A committed change stalls while another team supplies an integration or approval. | Clarify ownership and identify dependencies that repeatedly block deployment. |
CircleCI’s 2026 State of Software Delivery report found that the typical team needed 72 minutes to recover from a failed build. When a failed build blocks a release, that recovery time extends the wait before production. Recurring build failures deserve attention when you investigate rising LTFC.
To work out which of these causes is increasing your team’s LTFC, check where changes spend the most time being worked on or waiting. That gives you a starting point for investigating the delay.
If you need help doing that, Axify’s Value Stream Mapping shows how much time work spends in each stage of your workflow, so you can see where it waits. Axify Intelligence identifies bottlenecks from your delivery data and suggests next steps you can apply.
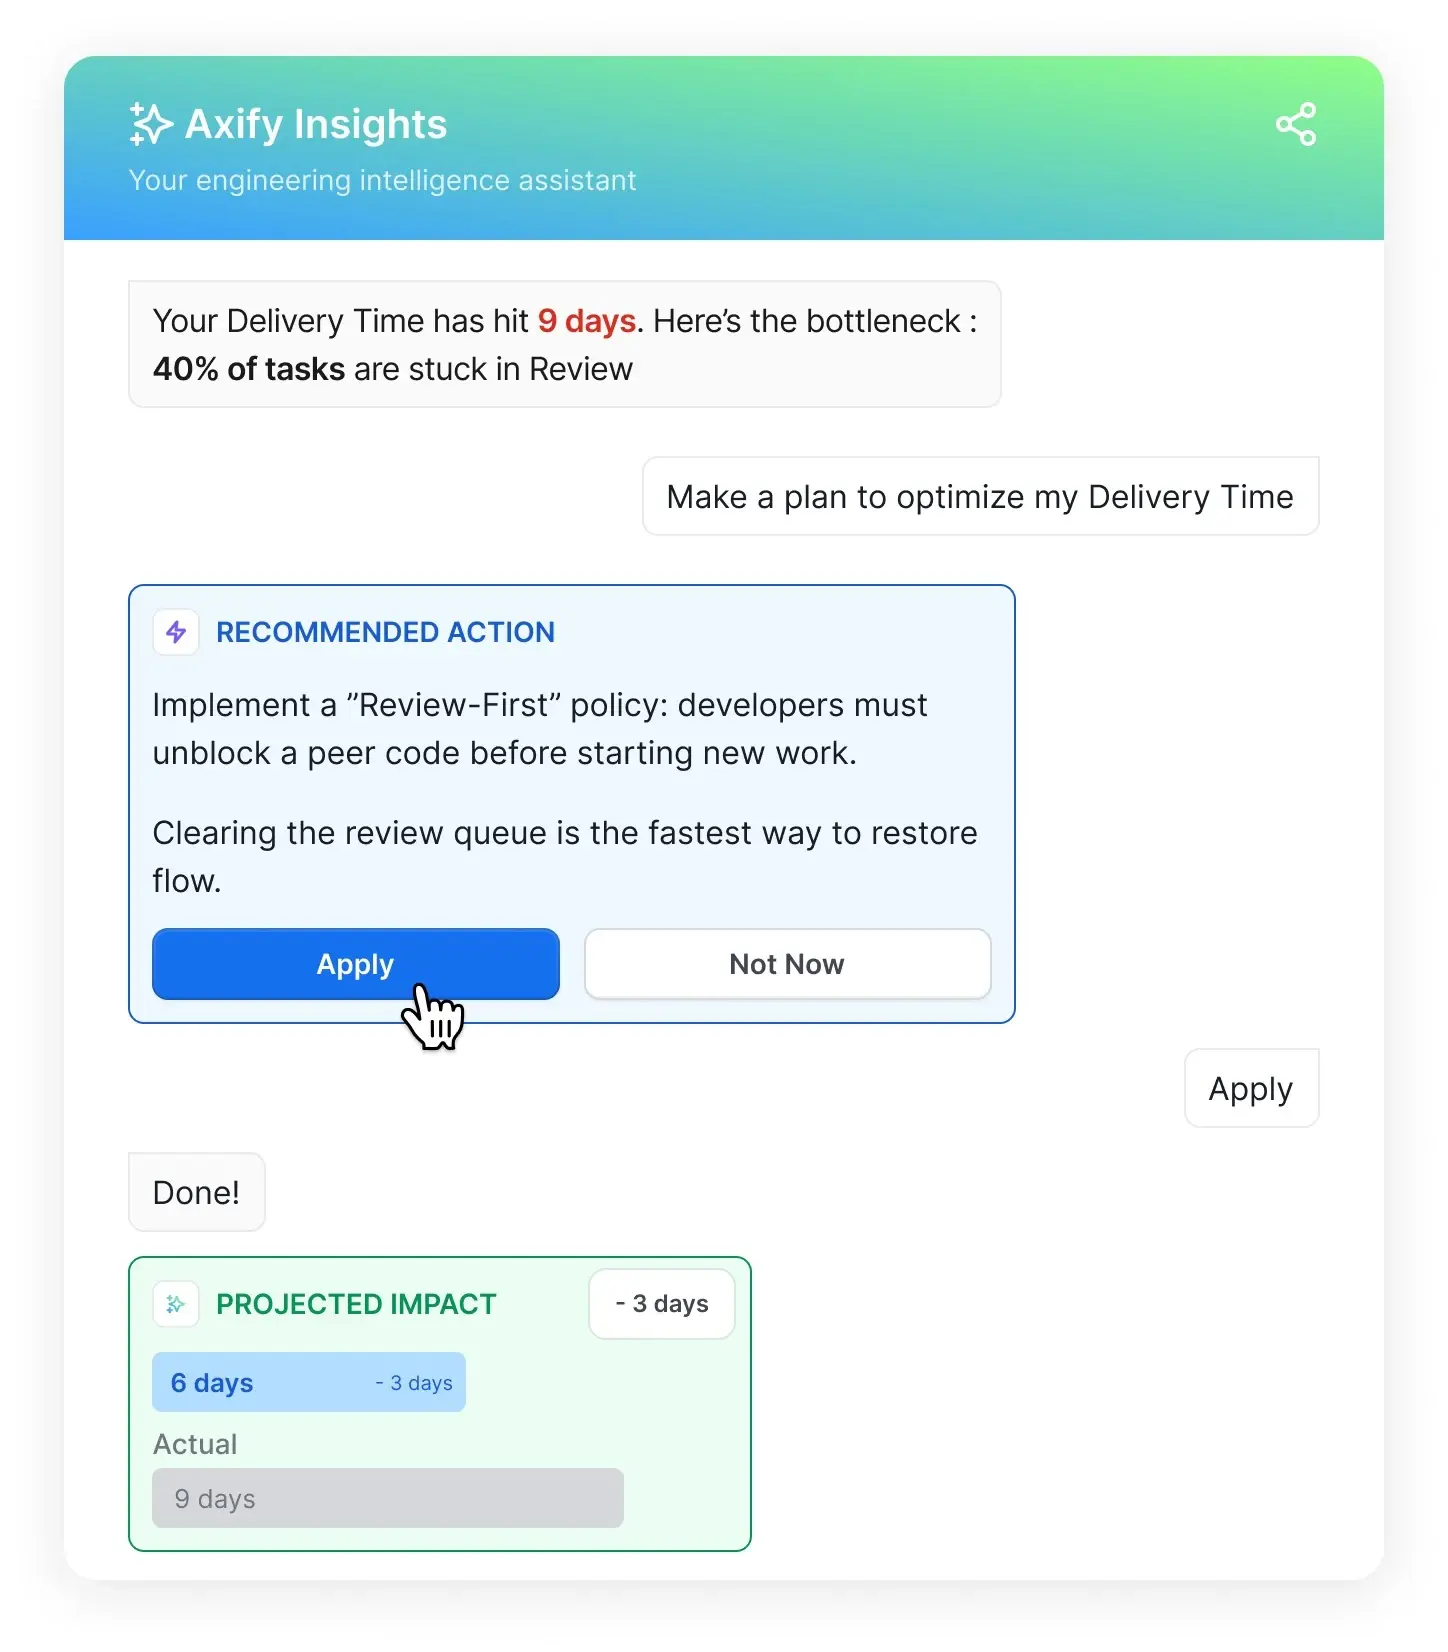
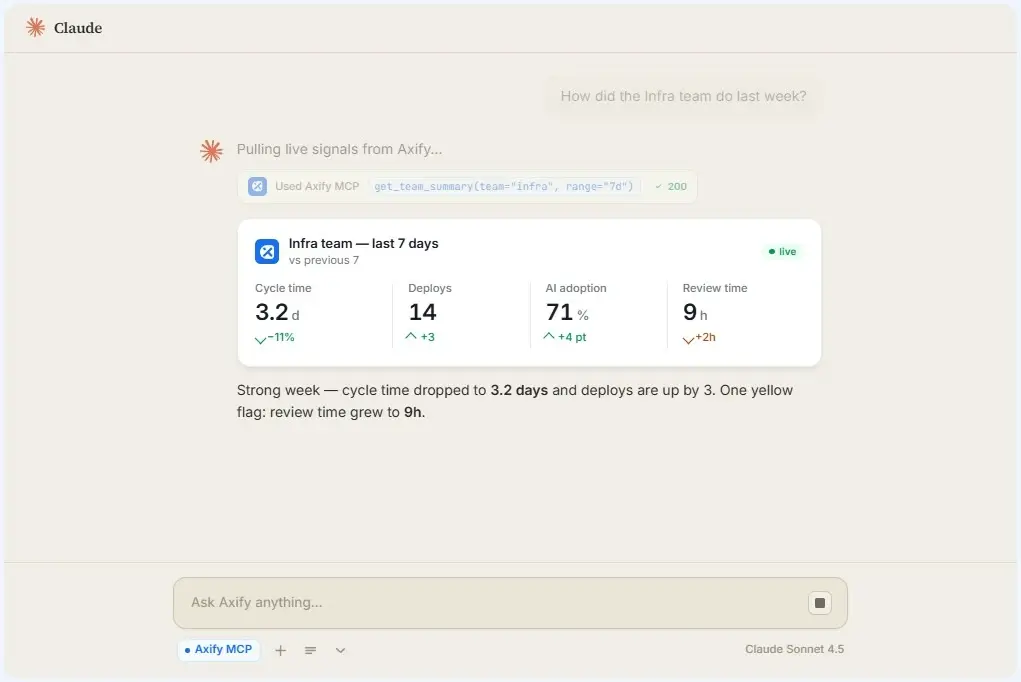
With the Axify MCP server, you can investigate delivery trends through a compatible AI assistant, with read-only access to your Axify data. For example, ask, “How have LTFC and review time changed for our infra team over the past four weeks?” This helps you check whether longer reviews coincide with rising LTFC, then investigate the affected pull requests.
Read LTFC alongside the other DORA metrics to check whether faster delivery comes with reliable releases and less corrective work. Compare the same application over matching reporting periods so the figures describe the same delivery process.
From our experience, here are four pairings and the patterns worth investigating.
Falling LTFC with rising deployment frequency suggests changes are moving through delivery faster and reaching production more often. So, you can check whether smaller batches or shorter review queues explain the improvement.
SlashData’s 2024 research for the Continuous Delivery Foundation found that 53% of respondents deploying several times a day reported LTFC below one day. Among those deploying less than once a month, that figure was 4%.
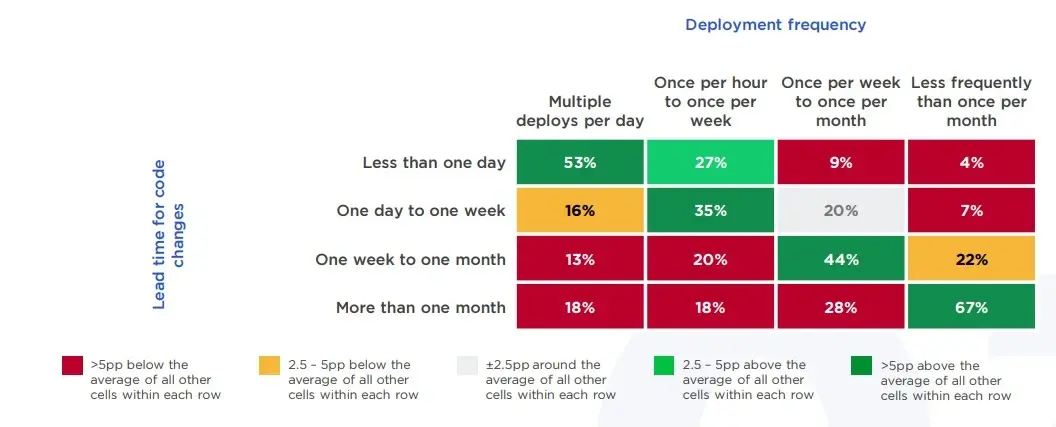
Source: CD Foundation, State of CI/CD Report 2024 (SlashData)
Rising LTFC with falling deployment frequency points to slower, less frequent delivery. Look for growing queues, unreliable pipelines, or release restrictions.
If both rise, frequent deployments may contain quick fixes while older changes remain blocked. If both fall, check change volume. Fewer changes can mean fewer deployments even when each change moves quickly.
Falling LTFC with a stable or falling failure rate suggests your team is delivering faster while maintaining release reliability.
Falling LTFC with a rising failure rate needs investigation. Check whether rushed reviews, missing tests, or larger changes are allowing more defects into production.
If LTFC rises while failures fall, additional validation may be helping, but inspect which checks catch defects and which add waiting. If both rise, examine recurring failures and repeated attempts to prepare changes for release.
Falling LTFC and recovery time suggest your team can deliver regular changes and restore service more quickly.
Falling LTFC with rising recovery time means faster delivery hasn’t carried through to incident recovery. You can check rollback procedures, diagnosis time, and approvals for emergency fixes.
If LTFC rises while recovery improves, your emergency release path may work better than the regular one. If both rise, investigate shared constraints, such as slow tests or manual deployment steps.
Falling LTFC with falling rework suggests faster delivery is accompanied by fewer unplanned deployments to address production incidents.
Falling LTFC with rising rework can mean more delivery capacity is going into corrective releases. Separate planned changes from incident fixes to check whether fast hotfixes are pulling the LTFC average down.
If LTFC rises while rework falls, check whether stronger validation explains the change or whether the mix of deployments has shifted. If both rise, investigate repeat defects and the queues holding up their fixes.
Lead time measures request to production, cycle time measures the elapsed time from starting work to completion, and LTFC measures first commit to production.
The main difference is where each clock starts. Lead time includes the wait before anyone begins work. Cycle time starts when the team actively picks up the task, while LTFC starts at the first commit.
For example, let’s assume that a stakeholder requests a feature on October 1. Work starts on October 4, the first commit happens on October 6, and the feature reaches production on October 11.
| Metric | Measurement window | Elapsed time |
|---|---|---|
| Lead time | October 1 to 11 | 10 days |
| Cycle time | October 4 to 11 | 7 days |
| LTFC | October 6 to 11 | 5 days |
This example uses production as the completion point for cycle time. Your workflow may define completion differently, so document that endpoint before comparing the figures.

To reduce LTFC, shorten the work and waiting time between the first commit and production. Start with the stage causing the largest delay.
Here's what you need to do:
Remember: AI-assisted review is a specific use case worth testing if your changes get stuck in review. Microsoft reported 10-20% shorter median pull request completion times across 5,000 repositories that adopted its AI code reviewer. Test it against your own delivery data before rolling it out.
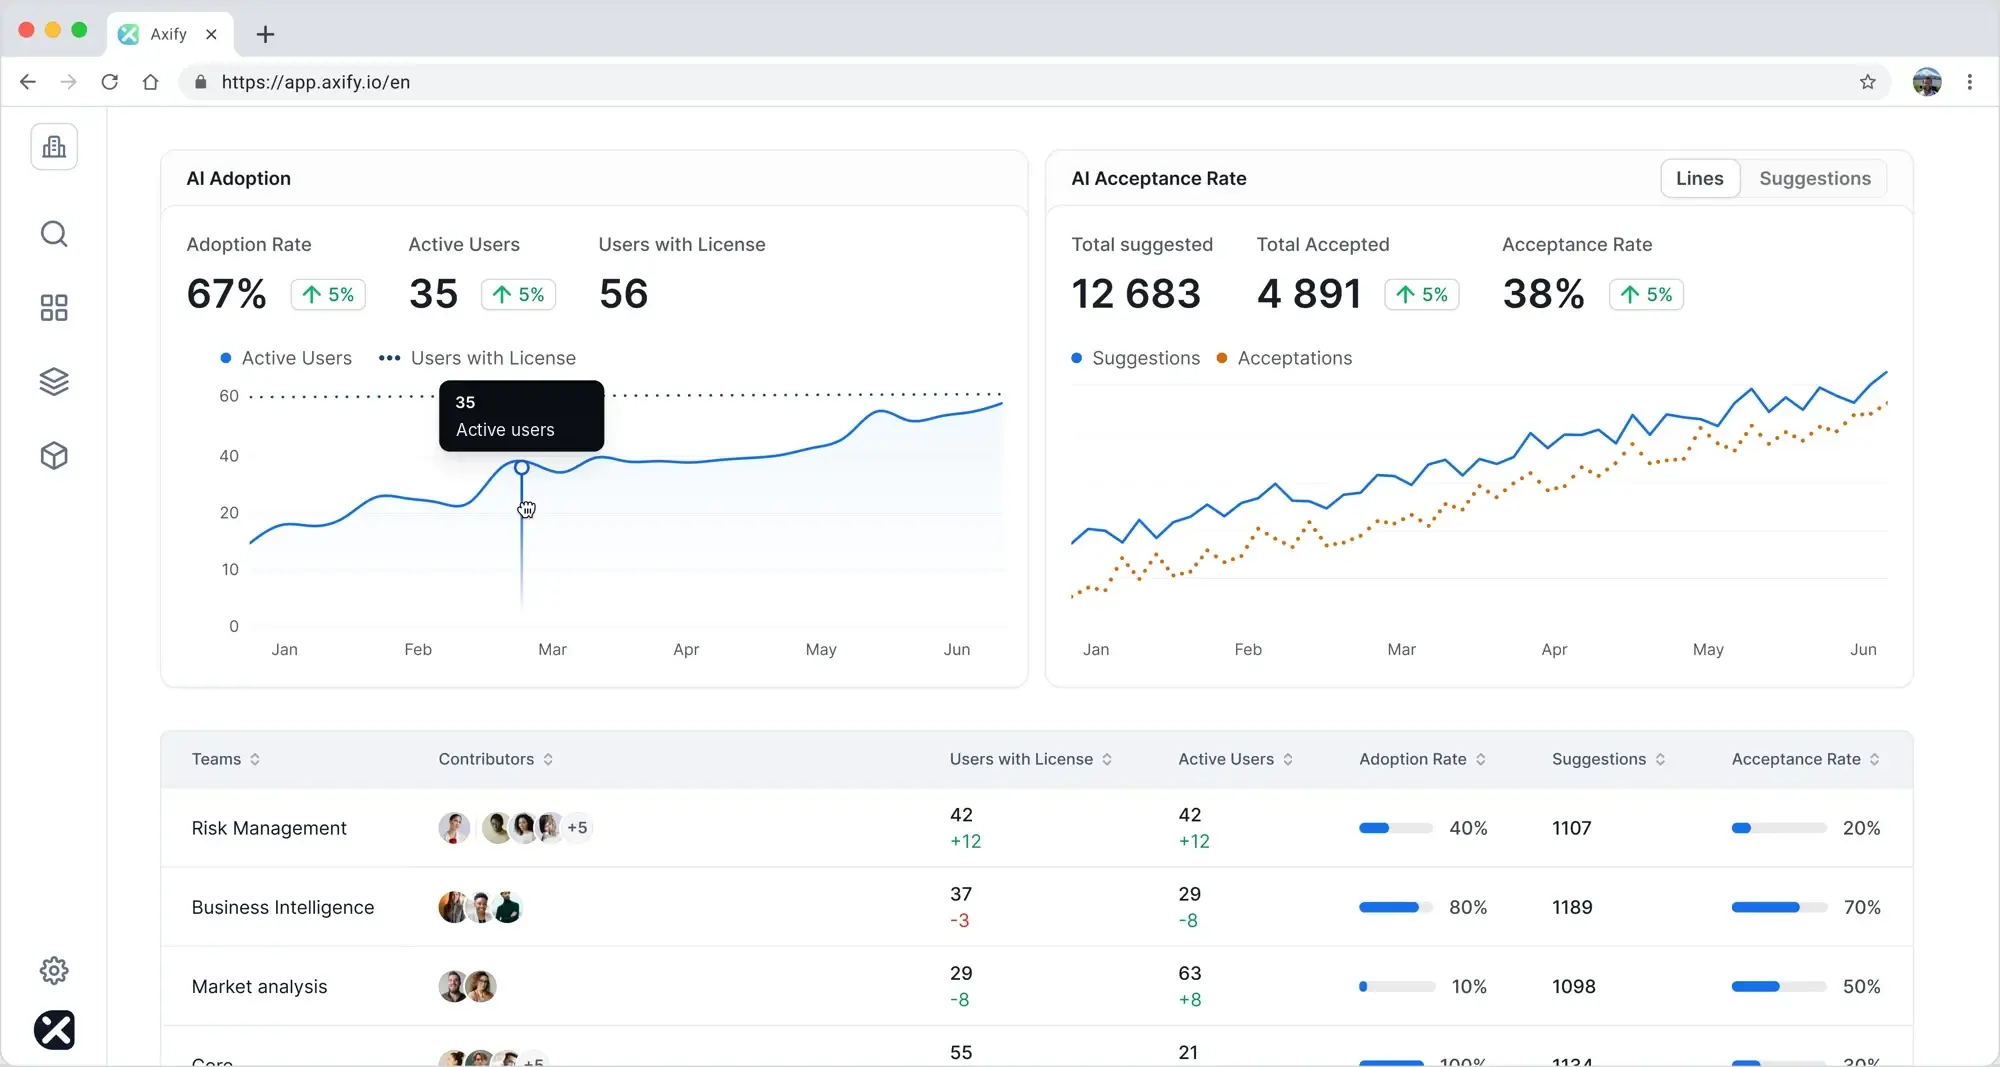
Axify, Jira, GitHub, GitLab, CI/CD tools, and DX can help you measure LTFC or collect the data needed to calculate it.
You can automate LTFC reporting using data from your development and deployment tools. Before choosing a report, check which events start and stop its clock.
Here are five options to consider.
Axify’s DORA metrics dashboard collects data from your connected tools and displays LTFC alongside the other DORA metrics. It breaks LTFC into coding, pickup, review, and deployment time, which can help you see which stage needs attention.
For example, a long pickup time points to pull requests waiting for an initial response. You can then check whether reserving review capacity reduces that delay. You can also use the other Axify features mentioned above, from Axify Intelligence and the Axify MCP to AI Adoption and Impact, to analyze your workflow and put your LTFC in context, including how AI use relates to it.
Jira’s cycle time report uses connected source control and CI/CD data to show how long work takes to move through your deployment pipeline. Jira calls this measurement “cycle time,” not lead time for changes.
To populate the report, connect your tools and include Jira work item keys in branches, commits, and pull requests. Ticket creation and completion dates alone won’t give you LTFC.
GitHub’s repository data and deployment APIs can support a custom LTFC calculation. Your workflow needs to record successful production deployments so you can connect shipped changes to their commit history.
GitLab offers built-in DORA reporting, but its LTFC calculation starts when a merge request is merged. That excludes the earlier coding and review stages, so account for this difference when comparing it with first-commit-to-production measurements.
Jenkins, CircleCI, and Azure Pipelines help you inspect the pipeline portion of delivery. CircleCI and Azure Pipelines report execution durations, while Jenkins can add timestamps to pipeline logs.
You can use these records to investigate slow builds and deployment steps. For full LTFC reporting, connect successful production deployment timestamps to the first commit for each change.
DX provides DORA reports by service and by author. Its documented lead time measurements include pull-request-open-to-deploy, merge-to-deploy, and first-pull-request-commit-to-deploy.
These help track delivery after those events, but check the selected starting point before treating the result as first-commit LTFC. Keep that setting consistent when reviewing trends.
A falling LTFC can leave some delays out of view. The calculation includes deployed changes, so a stalled pull request only enters the picture once it reaches production.
For example, several quick fixes could lower your average while a larger change spends another week waiting for approval. That makes it worth checking unfinished changes alongside your LTFC trend.
At your next delivery review, bring a list of undeployed changes ordered by their first commit date. For the oldest ones, establish what’s holding them up, who can help, and the next action. This gives you a chance to address delays before they appear in completed delivery figures.
For more ways to track unfinished work, read our guide to Agile dashboard metrics, including work item age and work in progress.
Axify shows your LTFC broken down by stage, next to the other DORA metrics and your team’s AI adoption, so you can see where changes wait and whether AI is actually speeding up delivery.
Want to see where your changes wait between commit and production? Start your 14-day free trial of Axify.

Get the mapping from your CI/CD deployment records and Git history. Record which commit or build reached production, then trace its included pull requests back to their first commits. If you squash commits, preserve that link in build metadata.
We think you should track both when possible. The mean shows average LTFC and captures the influence of unusually slow changes, while the median shows the middle value. If the mean rises but the median stays steady, investigate the changes taking much longer.
You need each change’s first commit timestamp, its successful production deployment timestamp, and a reliable link between them. Record the service, environment, and deployment status so staging runs and failed attempts stay out of the calculation. Use consistent time zones.
Use a dashboard showing LTFC trends, stage durations, and failure rates for each service. Set alerts for review or deployment waits that exceed agreed thresholds, then route them to the responsible team with links to the affected changes.
Use LTFC to assess release predictability, decide where to invest engineering capacity, and check whether process changes shorten delivery. For example, compare the same service before and after adding reviewers or automating tests, while checking failure and rework rates.