DORA Metrics
14 minutes reading time


Are your deployments as smooth as they should be? We're asking because frequent failures and slow recovery times can eat up your valuable resources, damage user trust, and delay progress.
Despite their best efforts, we know many teams that struggle with consistent deployment quality, typically leaving these issues unchecked.
Change failure rate is one of the DORA metrics that help you track these problems.
In this guide, we’ll tell you all about change failure rate (CFR). We'll cover:
So, let's get right to it.

Change failure rate measures the percentage of deployments that cause a failure in production and need to be fixed or rolled back after they are deployed. It determines how many changes that we deployed to production resulted in an incident.
For example, having a high change failure indicates gaps in testing, validation, or release safeguards. As a result, CFR serves as a signal of how reliable and stable production changes are once deployed.
Here's a YouTube video explaining this in a bit more detail:
Different organizations have different criteria for what failure means in their operations, since there is no universal definition of failure. Because of this, a need shows up to define the term failure on a high level at each organization, so all the teams will respect and intercept the failures when they occur.
Based on our expert team's insights, here are some cases that are treated as failures by the engineering teams:
Examples of failures include bugs introduced into production, system downtime, or any event that requires a 'hotfix' or rollback.
But not all issues that occur post-change are classified as failures. For instance, minor bugs that do not affect the system's overall performance or that do not impact the user (e.g., fixing a label) are not considered failures.
Development teams regularly deploy changes to production for end users. Some of these changes will cause incidents (i.e., service outage or hotfix), so the change failure rate is the percentage of changes that result in service degradation.
Along with the CFR, the DORA group defines three more metrics (called DORA metrics):
DORA metrics give you valuable insights because you can analyze the metrics to assess the team's performance. Then you can improve your development processes. Just by looking at CFR and MTTR, you can make sure that your code is solid and stable, while reducing your team's failures.
However, you need to work on speed AND stability simultaneously. You can't only improve stability or speed. For example, you could go faster, but it would likely increase the number of incidents. And you could take more time to code to improve quality, but you'll sacrifice speed and won't have a fast enough pace.

Tracking your change failure rate helps you understand the reliability of your deployment process and pinpoint areas that need improvement. Here are the key reasons why it matters.
Change failure rate is a great way to determine how frequently releases lead to problems. A high value indicates that your development or testing process has room for improvement. For example, if 30% of your deployments require rollbacks, it may be time to rethink your testing environments to catch issues earlier.
Frequent failures mean more disruptions for users, which can damage customer trust and cost you money. You can ensure smoother releases and more reliable services by tracking and taking steps to reduce the change failure rate.
Change failure rate provides concrete data on the quality of deployments. This can motivate teams to write more solid code, improve testing, and communicate better across development and operations.
Measuring change failure rate is critical to DevOps practices like continuous improvement. It gives teams a clear metric to work on reducing, which helps them get better with each release. For example, an eCommerce site that gradually reduces its CFR may see fewer cart abandonment issues caused by release-related bugs.
Monitoring the metric over time can help your team decide when it's safe to release more frequently or when to hold back and address issues. For example, a sudden spike in change failure rate to 15% after an architectural revamp may indicate that the new architecture is introducing unforeseen risks or incompatibilities.
In this case, we would likely recommend that you pause deployments, investigate the root causes of the failures, and make necessary adjustments before resuming releases.
Below is a step-by-step guide to help you calculate CFR. However, it’s easier to track it using Axify’s visual interface, which integrates data from multiple tools you already use.
Here’s what that looks like:

Here’s a breakdown of the steps you’ll need to follow:
Here are a couple of examples to illustrate how CFR works:
Example 1: If your team has 6 deployments and 2 of them cause failures, your CFR is 33% (2/6 x 100).
Example 2: For 30 deployments and 3 failures, the CFR would be 10% (3/30 x 100).
%20Calculation.webp?width=851&height=323&name=Change%20Failure%20Rate%20(CFR)%20Calculation.webp)
These examples show how CFR is used to assess deployment quality and guide improvements in your workflow.
According to the 2025 DORA DevOps Report, the ideal change failure rate is between 0% and 2%. This represents top-tier performance in software delivery. That small range indicates that a team has developed efficient workflows, strong testing practices, and smooth production releases with minimal issues.
However, only 8.5% of teams actually achieve this ideal CFR. As shown in the image below, this is a rare accomplishment. It demonstrates that even the most high-performing teams face challenges in completely eliminating deployment failures.
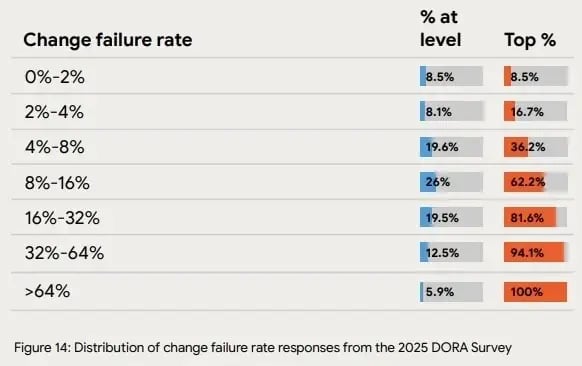
Source: 2025 DORA DevOps Report
In earlier DORA reports, the CFR is more closely correlated to the team’s performance level:
Elite performers obtain a 5% change failure rate and high performers have a 20% CFR. Surprisingly, medium-performance teams have a better CFR compared to high-performance teams: they reach 10%.
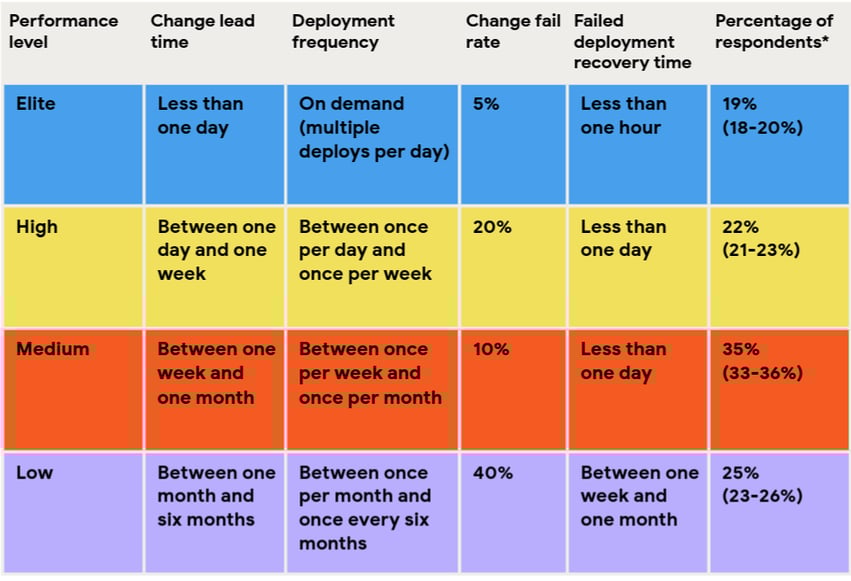
Source: 2024 DORA DevOps Report
That brings us to the next point.
While it’s understandable to aim for flawless releases, striving for 0% CFR is unrealistic in modern software development. Here are the key reasons why.
Complexity of modern systems.
Today’s software systems are highly intricate, usually involving multiple dependencies, third-party integrations, and evolving infrastructure. With such complexity, it’s nearly impossible to avoid all potential issues, no matter how much testing or precaution is taken.
Over-testing and slow delivery.
Pushing for zero failures typically leads to over-testing, which delays releases and can also lead to diminishing returns. Teams may spend excessive time running tests on already stable systems, which can slow down development speed without meaningfully improving quality.
Controlled failures and fast recovery.
The real goal isn’t to completely eliminate failure but to control it. Teams should aim to recover quickly from failures through stable processes that minimize the impact. Controlled failures, when managed well, provide valuable learning opportunities that improve long-term performance.
Healthy CFR = failure without chaos.
A healthy CFR doesn’t mean zero failures. It means having failures that can be managed effectively without disrupting business outcomes. The focus should be on maintaining operational stability and speed, even when failures occur, to ensure they don’t snowball into bigger issues.
Even though the change failure rate formula is straightforward, there are some caveats to consider to avoid inaccurate or misleading values. Here, we will discuss these caveats, along with some advice on how to calculate accurate values each time.
As discussed above, different teams and organizations can define failure differently. So, be clear on what counts as a failure (e.g., bugs, downtime, rollbacks) and ensure everyone on your team is aligned.
Pro tip: You can use automated tools like Axify to track and log these failures consistently so they don't slip through the cracks.
We believe that not all deployment failures are related to the code changes being released. For example, a deployment job may fail due to infrastructure, network, or configuration errors. These should be tracked separately and not counted as part of your change failure rate.
If a failure is caused by something outside your control, it does not reflect the quality of your code changes. This includes a third-party service outage or network issue. So, we advise you to exclude these from the CFR as well, to keep the metric focused on your team's performance.
As your system evolves, so might your definition of what constitutes a failure. We recommend that our clients establish a policy to periodically revisit their criteria and keep the change failure rate metric relevant and accurate.
Understanding how change failure rate relates to other performance metrics from DORA is crucial for tracking overall software delivery success. After analyzing these metrics, you can better identify areas where your team can improve, and that will lead to more efficient deployments and higher product quality.
Here are the key performance metrics related to CFR.
Higher deployment frequency combined with a low CFR reflects a team with strong DevOps maturity. From the 2025 DORA Survey, elite teams are those with the highest deployment frequency.
These teams deploy changes frequently and quickly, which shows that they have mastered both speed and reliability in their delivery process. 16.2% of teams release multiple times per day or on demand.
When you increase deployment frequency, you can demonstrate your ability to release small, consistent changes without causing disruptions in production. Teams that can deploy frequently with a low CFR are usually able to respond quickly to market needs while maintaining product stability.
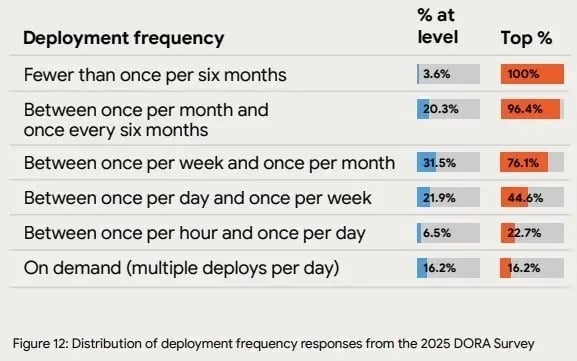
Source: 2025 DORA DevOps Report
Short lead time for changes combined with a low CFR means a reliable, well-functioning pipeline. The 2025 DORA Survey reports that 9.4% of teams can complete changes quickly, in less than one hour. Many other teams are completing changes in less than one day.
A fast lead time indicates that your team can quickly push changes from development to production, which reduces bottlenecks. This, combined with a low CFR, suggests that the changes being deployed are fast, stable, and well-tested.
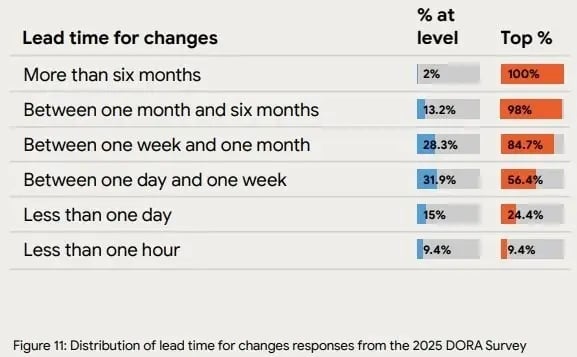
Source: 2025 DORA DevOps Report
Failed deployment recovery time is defined as the time the system takes to restore the service when an incident occurs. Together with the change failure rate, MTTR is a measure of the quality and stability of your team's delivery process.
If the change failure rate is high, MTTR usually tends to be high as well. This means a longer-than-desirable time is required to restore services to their normal functioning state. Normally, this hampers the overall software reliability and business productivity.
The 2025 DORA Survey outlines that 21.3% of teams have the quickest recovery times after a failed deployment. They can recover in less than one hour.
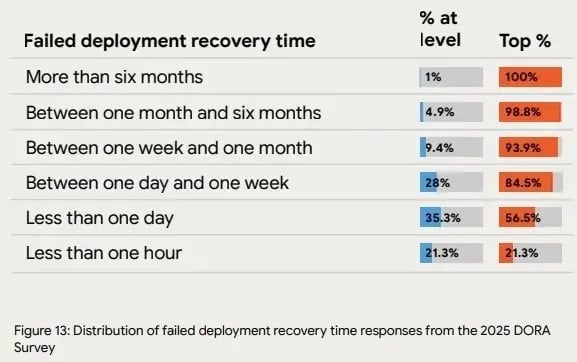
Source: 2025 DORA DevOps Report
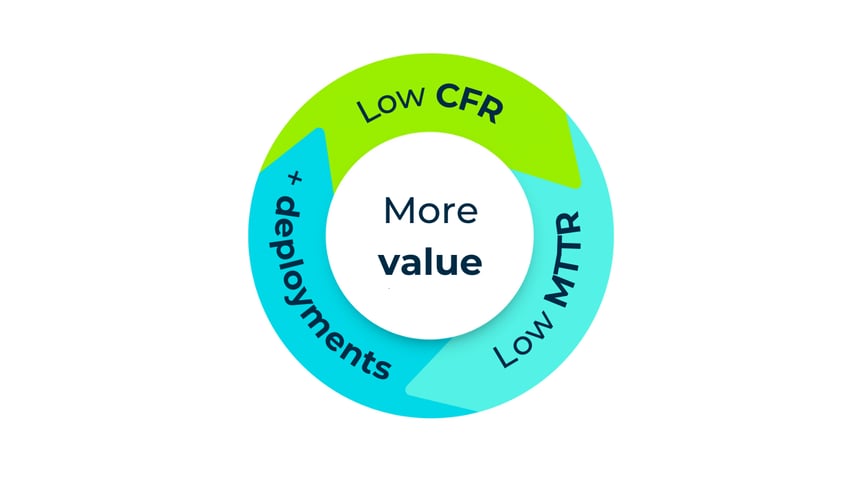
"When you improve the engineering culture, DevOps practices will lead you to smaller, but more frequent changes. With smaller changes, incidents are easier to spot and manage, hence reducing the time it takes to fix them.
It will be safer to deploy more changes. It is less risky for a business to have a team that can deploy more changes with fewer failures and can fix a mistake quickly (e.g., in less than 30 minutes).
Also, high CFR and high MTTR mean more time spent on fixing bugs and service degradation, which is a dollar spent that doesn't create more business value."
Alexandre Walsh
Co-Founder and Head of Product at Axify
Reliability is measured through service level objectives (SLO) and service level Indicators (SLI). This helps teams define and measure the level of service they are providing. Aligning these with the CFR helps track the stability of your application and its uptime.
Together, these metrics offer a comprehensive view of your team’s performance. They give insight into how well your team deploys changes, responds to issues, and ensures ongoing reliability and uptime.
Regularly monitoring and improving these metrics will lead to better DevOps practices and more successful software deliveries.
A high change failure rate can have a big impact on businesses because it can lead to increased costs across financial, operational, and product areas. Frequent failures drain resources, slow development, and increase the time spent on bug fixes, all of which affect productivity.
Also, a poor CFR damages customer trust and hurts your brand reputation, and this can potentially cause customer churn. So, we believe that identifying and managing CFR is crucial for minimizing these negative consequences and ensuring a smoother, more reliable deployment process.
Here is a list of the main issues that can arise from having a high CFR:
In financial terms, the cost of change failure rate can vary a lot depending on the severity of the issues, the type of failures, and the size and complexity of the system. It also depends on the size of your organization, the number of customers affected, and the specific industry or sector. It is difficult to define an acceptable monetary cost for a change failure rate, as this varies a lot.
According to Google’s research on the ROI of DevOps transformation, downtime costs vary based on several factors. For Fortune 1000 companies, infrastructure failures average around $100,000 per hour, while critical application outages can cost approximately $500,000 per hour.
"In order to reduce the change failure rate and its associated financial costs, it is good practice to conduct regular assessments of the CFR costs and compare them with similar organizations within your industry. By doing this, you will understand the relative costs and can set realistic goals and objectives."Alexandre Walsh
Co-Founder and Head of Product at Axify
To lower your change failure rate, you need controls that catch risk before changes reach production. That means automated testing, CI/CD pipelines, clear code review standards, and monitoring that shows failures early.
You can improve delivery stability when you treat continuous delivery as an operating model rather than a checklist. So, these practices help you reduce failed changes while keeping the release pace predictable:
Other best practices to minimize CFR include:
Along with CFR, we recommend that you track other associated details like the duration of the outage or service degradation due to the failure, and the steps you took to restore the service.
Tracking the outage duration helps your team prioritize its efforts and improve the processes. Conversely, tracking the restoration steps helps you understand the main cause of the failures.
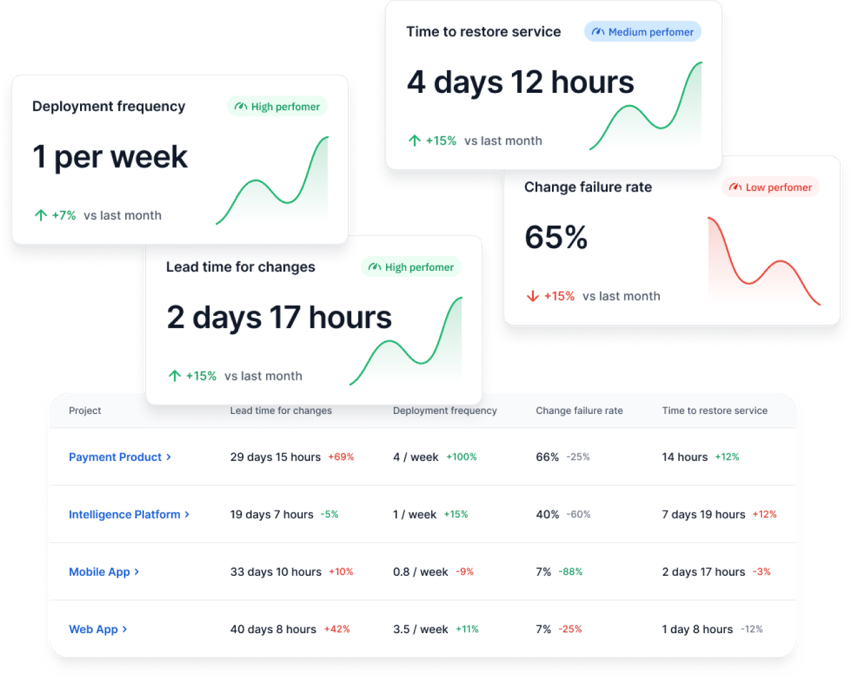
Manual calculations can give you useful insights, but an automated tool like Axify can accurately model system behaviour and track change failure rate effortlessly. Axify is a single platform to observe all the key performance indicators that will help you improve your development and delivery processes.
It is equipped with superior dashboards and provides constant tracking of DORA metrics in real-time. This can simplify the whole process and empower your team to concentrate on making improvements.
Axify automates Change Failure Rate (CFR) tracking across your entire organization, eliminating manual calculations and human error. While each team’s CFR is calculated independently to avoid unfair normalization, you can easily toggle between a per-team breakdown or an aggregated organization-level average. This flexibility allows you to analyze performance at the level that matters most to your current goals.
You can track all of the DORA metrics inside our dashboard, including change failure rate.
Apart from that, you can use Axify to measure other things as well, like reliability and other custom metrics. Reliability is a metric that was introduced to address the importance of operational excellence to a high-performing software organization.
This metric tells you how well you meet your users' expectations, such as availability and performance. It doesn't have a defined high, medium, or low clustering, as the way teams measure reliability can vary widely.
This depends on the service-level indicators or service-level objectives (SLI/SLO). Instead, teams are asked to rate their ability to meet their own reliability targets.

Our other custom metrics include issue tracking, ongoing pull requests, workflow stability, throughput of issues per sprint, and so much more.
Keeping your finger on the pulse of the change failure rate can yield revealing insights about the overall system health. When you make diligent efforts to lower this rate, stability is dramatically improved. This can create a streamlined operation and a satisfied team, which results in a win-win situation for everyone involved.
Pro tip: To find out more about software engineering metrics, you can read our article here.
So far, we’ve seen that change failure rate is a powerful metric because it provides critical insights into the health of your software delivery process. It helps you understand where improvements are needed, so you can guide your team toward more reliable and efficient deployments.
Now, let’s discuss the practical ways in which you can use CFR to improve your engineering process:
When you integrate CFR into your process, you can proactively manage the quality of your deployments, track progress over time, and align engineering teams around goals that promote continuous improvement and reliability.
This metric, when used effectively, helps in day-to-day operations and also aligns your engineering efforts with broader business goals.
Understanding and tracking change failure rate is important for improving the reliability and stability of your deployment process. Keeping an eye on CFR allows you to proactively identify weaknesses in your pipeline and work to continuously improve deployment quality.
To track CFR effectively and gain deeper insights into your team’s performance, book a demo with Axify today. Our platform helps you measure CFR so you can optimize it for smoother releases and greater operational efficiency.
