What’s New in 2026?
This guide was updated to reflect how software teams use dashboards in 2026. The update adds AI-focused metrics, including adoption, acceptance rate, and the impact of usage on delivery speed and delays across stages.
You’ll also see more real examples tied to common problems, like work getting stuck in review or incidents repeating without clear causes. On top of that, the guide walks you through dashboard implementation step by step.
And finally, we added a clearer view of available tools so you can understand what fits your setup before making a choice.
Also, you might already track pull requests, your build pipeline, and deployment failures. But those metrics don’t connect on their own. That’s where most teams get stuck during project planning and sprint review.
In this article, you’ll learn how to use a DevOps dashboard to connect these signals and understand your value delivery cycle. After that, you’ll know how to spot delays early and act on them before they affect delivery.
Pro tip: Axify Intelligence acts as your decision partner by showing you what’s slowing delivery, why it’s happening, and what to fix next. Contact Axify today
What Is a DevOps Dashboard?
A DevOps dashboard is a centralized interface that helps your DevOps team manage all the aspects of the software development lifecycle (SDLC).
DevOps dashboards gather data from various tools and systems used throughout the software development process. This includes:
- Version control systems like GitHub and GitLab.
- Continuous integration/continuous deployment (CI/CD) tools, such as Jenkins and CircleCI.
- Project management tools like Jira or Azure DevOps.
- Monitoring systems, including Prometheus and Grafana.
- AI coding tools (assistants and agents).
Platform or Dashboard?
A DevOps dashboard can be a standalone tool or part of a larger platform. Many platforms offer integrated dashboards that give you solid insights into your DevOps processes.
Where to Find DevOps Dashboards?
Multiple DevOps dashboards created by different companies are available online. You can find them as part of CI/CD tools, project management systems, and specialized DevOps platforms.
Axify can help you integrate them all.
Who Can Use DevOps Dashboards?
DevOps dashboards are helpful for many teams, including development, operations, quality assurance, and management.
These software solutions are precious for IT software development and deployment teams. But a DevOps dashboard can benefit any team looking to improve their process visibility and efficiency.
That brings us to the next point.
Types of DevOps Dashboards
If you landed in this article, it’s because you, your CTO, or other team members need more visibility on information they don’t have.
That’s why you should first figure out the right focus for your DevOps dashboard.
You should do this based on your organization’s needs and roles. This approach will help you and your software development team gain the most value.
Here’s what we advise our clients to consider:
- Stakeholder dashboard: This interface helps you share team and organizational goals, information, and links to work item templates. It’s ideal for stakeholders who need an overview of the team’s progress, goal alignment, and their ability to create bugs or feature requests.
- Personal dashboard: You can create this dashboard to focus on your backlog and current tasks. This interface helps contributors manage their workloads and track their progress.
- Team dashboard: This dashboard helps teams monitor project status, track progress, and ensure all backlog items are well-defined. Team leads and members can see how work moves across the pipeline, where tasks slow down, and how the team is performing day to day.
- Sprint dashboard: Each team can review it in daily stand-ups to ensure they’re on track to meet their sprint goals. That way, they can address any issues impacting those goals. Pick this one if you’re a Scrum Master or have Agile teams who want to stay aligned with their sprint objectives.
- Release dashboard: Use this DevOps dashboard if you have a major release involving contributions from several teams. We recommend this for release managers and coordinators because they can oversee the progress of their release plans and ensure timely delivery.
- Test and Deploy dashboard: This tool monitors continuous integration, builds, deployments, and releases. DevOps engineers and QA teams can use it to track the status of their CI/CD pipelines. That way, they can get smooth deployment processes.
| Dashboard | Focus | Use Case | Type |
| Stakeholder | For stakeholders | Track team progress, goals alignment, and info. | Project or Team |
| Personal | Helps teams members | Helpful in tackling all tasks and tracking personal progress. | Project or Team |
| Team | Designed for team leads and members | Get a holistic view of team performance. | Team |
| Sprint | Scrum Masters and Agile teams | Track sprint progress and follow sprint objectives | Team |
| Release | Release managers and coordinators | Oversee the progress of release plans. | Project |
| Test and Deploy | DevOps engineers and QA teams | Track the status of CI/CD pipelines. | Project or Team |
Key Features of a DevOps Dashboard
A good DevOps dashboard should offer you reliable visibility and support your decision-making process. Here are the key features to look for:
Real-Time Monitoring and Alerts
You need to see problems as they happen, not hours later when they already affect users. A strong dashboard helps you track infrastructure health, error rates, and system behavior in real time. But more importantly, it flags unusual patterns live.
If your deployment suddenly takes longer or error rates spike, you get alerted with context. This helps you react before small issues turn into incidents.
CI/CD and Release Pipeline Visibility
You likely check your build pipeline and review deployments regularly. But the real problem is understanding how work moves across the entire release pipeline.
That’s why a good dashboard shows you build success rates, deployment frequency, and where failures happen. More importantly, it helps you see where pipeline health breaks down.
This way, you can quickly spot if bottlenecks come from builds, approvals, or failed deployments.
Workflow and Remaining Work Visibility
Many delays happen when work sits idle. Tasks wait for review, feedback, or clarification, and no one notices until deadlines slip.
Having a strong dashboard by your side shows how much remaining work you have (through metrics like WIP and number of aging tasks) and where tasks are getting stuck. You can see if reviews take too long, if work piles up in certain stages, or if teams are overloaded.
This makes it easier to reduce wait time and keep work moving.
Infrastructure and System Performance Tracking
Delivery speed might depend heavily on infrastructure. Slow environments, unstable services, or overloaded systems can create hidden delays across your pipeline.
So, a DevOps dashboard should give you clear visibility into infrastructure health, uptime, and resource usage. When systems slow down, you can trace the impact directly to delivery delays and fix the root issue faster.
Security and Stability Signals
From our experience, you can’t treat security and reliability as separate from delivery. Failed deployments, vulnerabilities, and unstable releases all affect how fast you can ship safely.
A dashboard should surface error rates, failure trends, and risks tied to releases. This helps you balance speed with stability instead of reacting post-incident.
Integration Across Your Toolchain
Like many companies, you may use multiple tools for monitoring DevOps-related activity. Version control, CI/CD, monitoring, and issue tracking all hold part of the story.
However, a DevOps dashboard can connect these metrics into one view. This reduces context switching and helps you understand how decisions in one stage affect the rest of your workflow.
How Does a DevOps Dashboard Work?
A DevOps dashboard works by collecting data from your tools, turning it into structured metrics, and showing what’s happening across your delivery system in real time. It connects signals from different stages of work so patterns, delays, and risks become visible.
To understand how this actually happens, we'll break it down into three parts.
Data Collection
Every stage of delivery generates signals. Code changes, builds, deployments, incidents, and infrastructure events all produce data.
A DevOps dashboard pulls this information through integrations, APIs, and webhooks. It connects to version control, CI/CD pipelines, monitoring tools, and issue trackers. And each system contributes a piece of the timeline:
- Pull requests show when work is reviewed.
- Pipelines show when builds run or fail.
- Monitoring tools show how systems behave after deployment.
Instead of checking each tool separately, everything flows into one place. This creates a continuous stream of events tied to how work actually flows.
Data Processing and Analysis
Raw data on its own doesn’t explain much. A dashboard organizes it into metrics that reflect how delivery performs.
Events are grouped into stages such as coding, review, testing, and deployment. From there, the system calculates timing, frequency, failure rates (and more) across those stages.
Dashboards track changes over time. The difference is in how those changes are analyzed.
If review time increases or deployment frequency drops, the system surfaces the change and quantifies it so you can see patterns emerging. More advanced systems go further by linking that change to likely causes, like so:
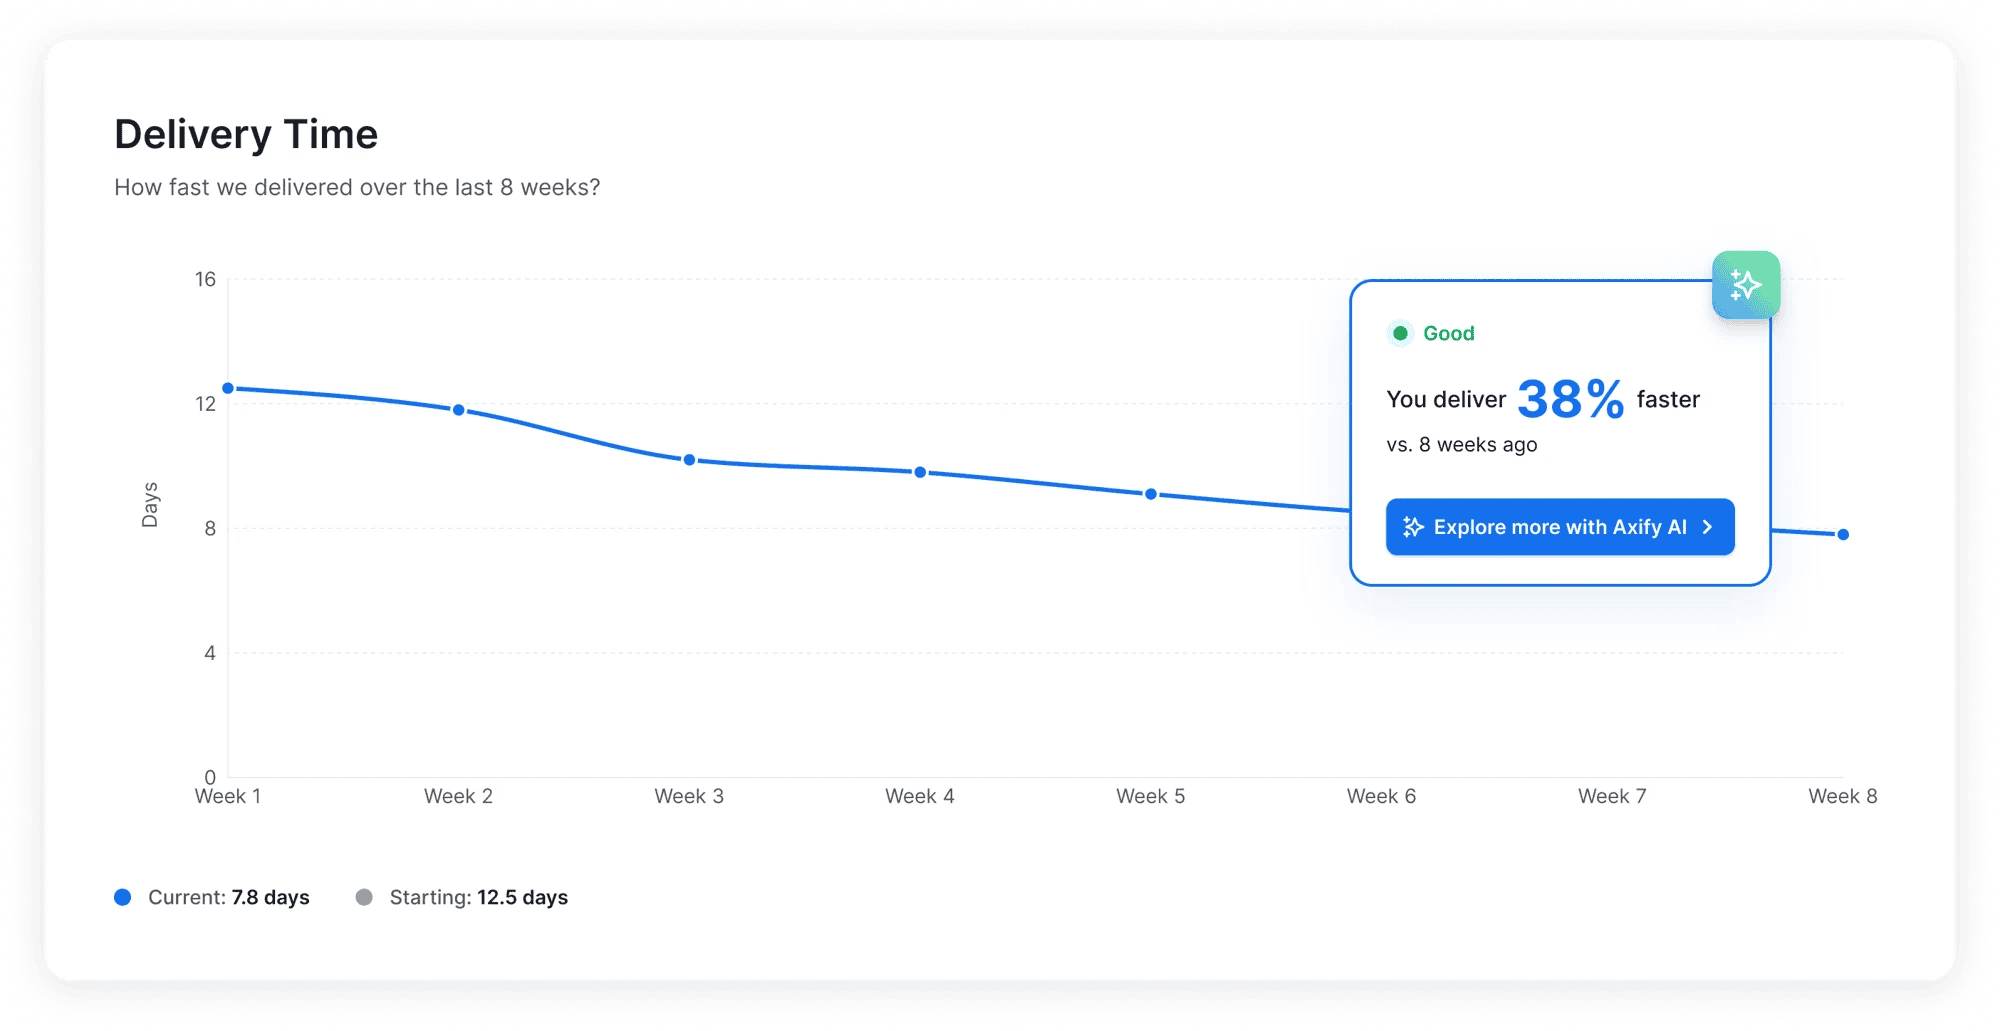
Even better dashboards give you recommendations based on those insights, but we’ll discuss more about that option below.
Data Visualization and Alerts
Once the data is structured, the dashboard presents it in a way that can be acted on quickly.
Metrics are displayed as timelines, charts, and stage breakdowns. This makes it easier to see how work flows from start to finish. A delay in one stage stands out immediately when compared to others.
Alerts play a key role here. When something deviates from expected patterns, notifications are triggered with context around the change. That context points to the cause instead of merely highlighting the symptom.
With everything in view, teams can start addressing issues early, before they affect delivery timelines.
Which Metrics Should You Include in a DevOps Dashboard?
A DevOps dashboard is most effective when it includes the right metrics. So, we advise you to choose variables that give you solid insights into the performance of your software development and delivery processes.
Pro tip: Align this selection with your organization’s goals and the maturity of your DevOps practices.
Here are the critical metrics you should consider including in your DevOps dashboard:
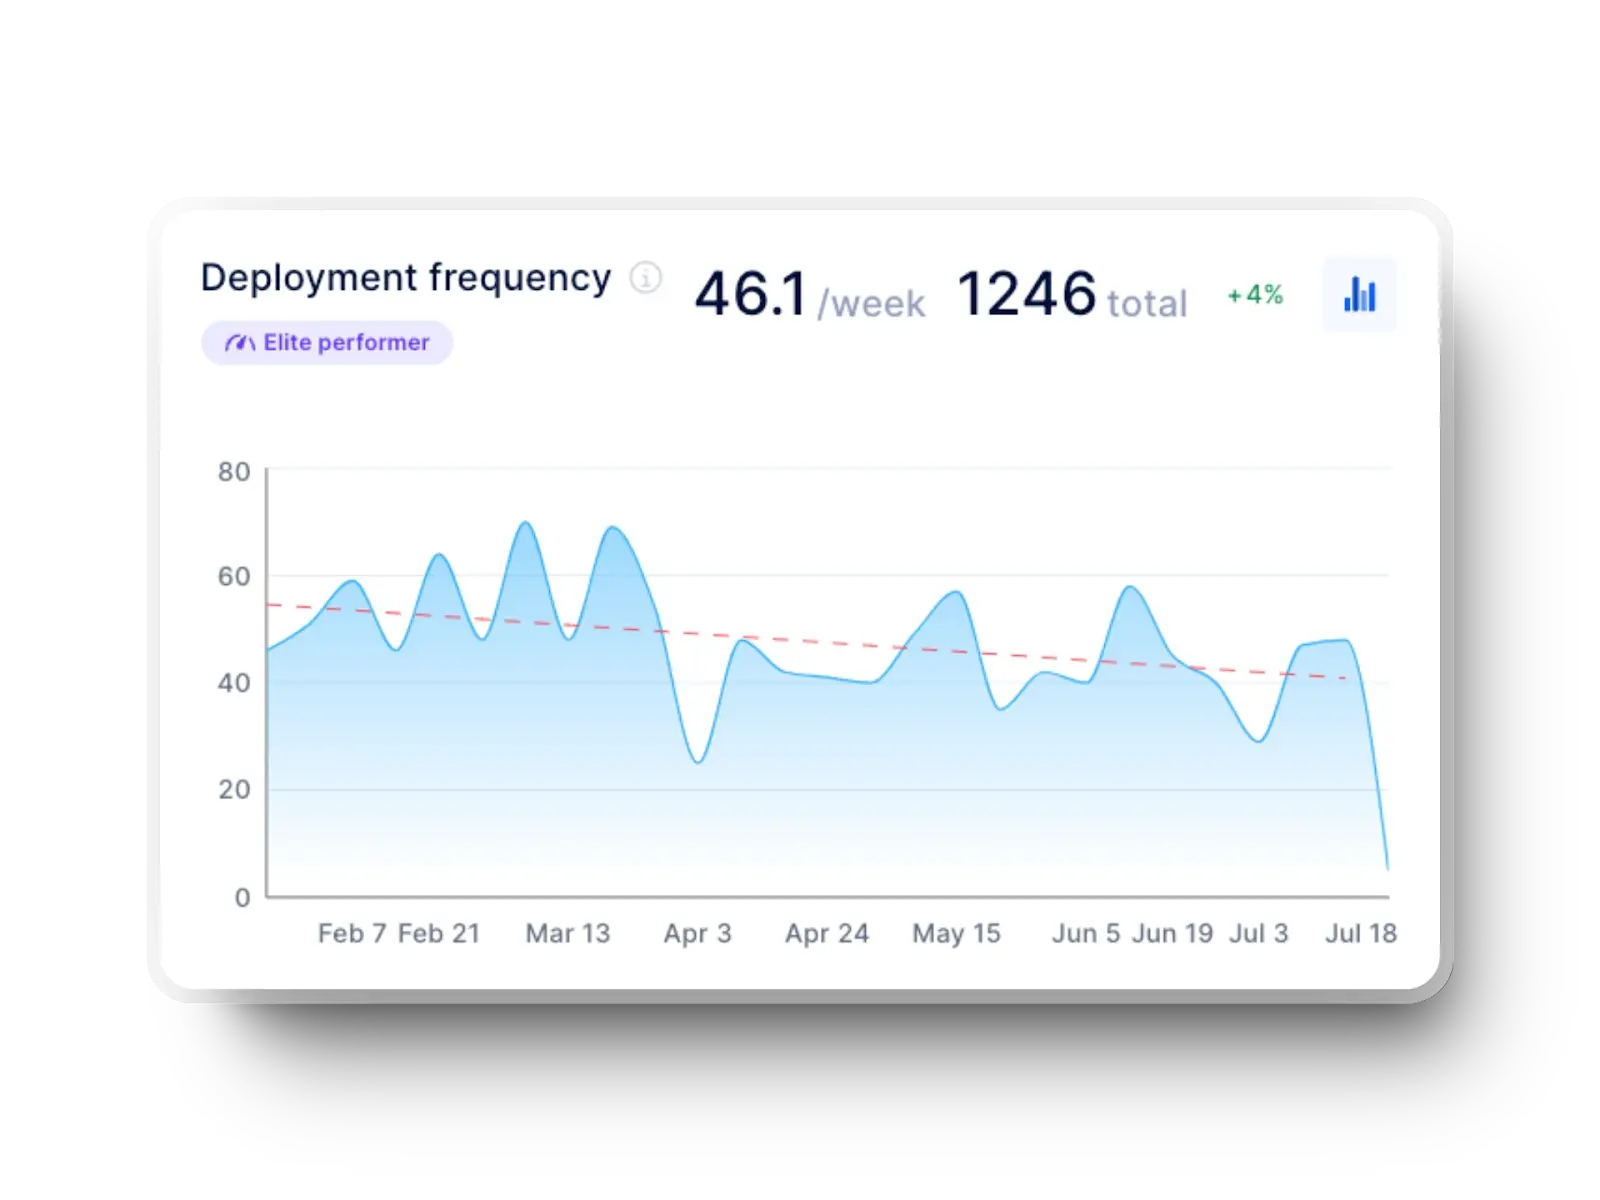
1. Deployment Frequency
What it is: How often does your team deploy code to production?
High deployment frequency means your team can quickly deliver new features and updates. That speed is important for maintaining a competitive edge and responding to user needs.
Source: Axify and Continuous Integration/Continuous Deployment (CI/CD) tools like Jenkins, CircleCI, or GitLab CI.
2. Lead Time for Changes
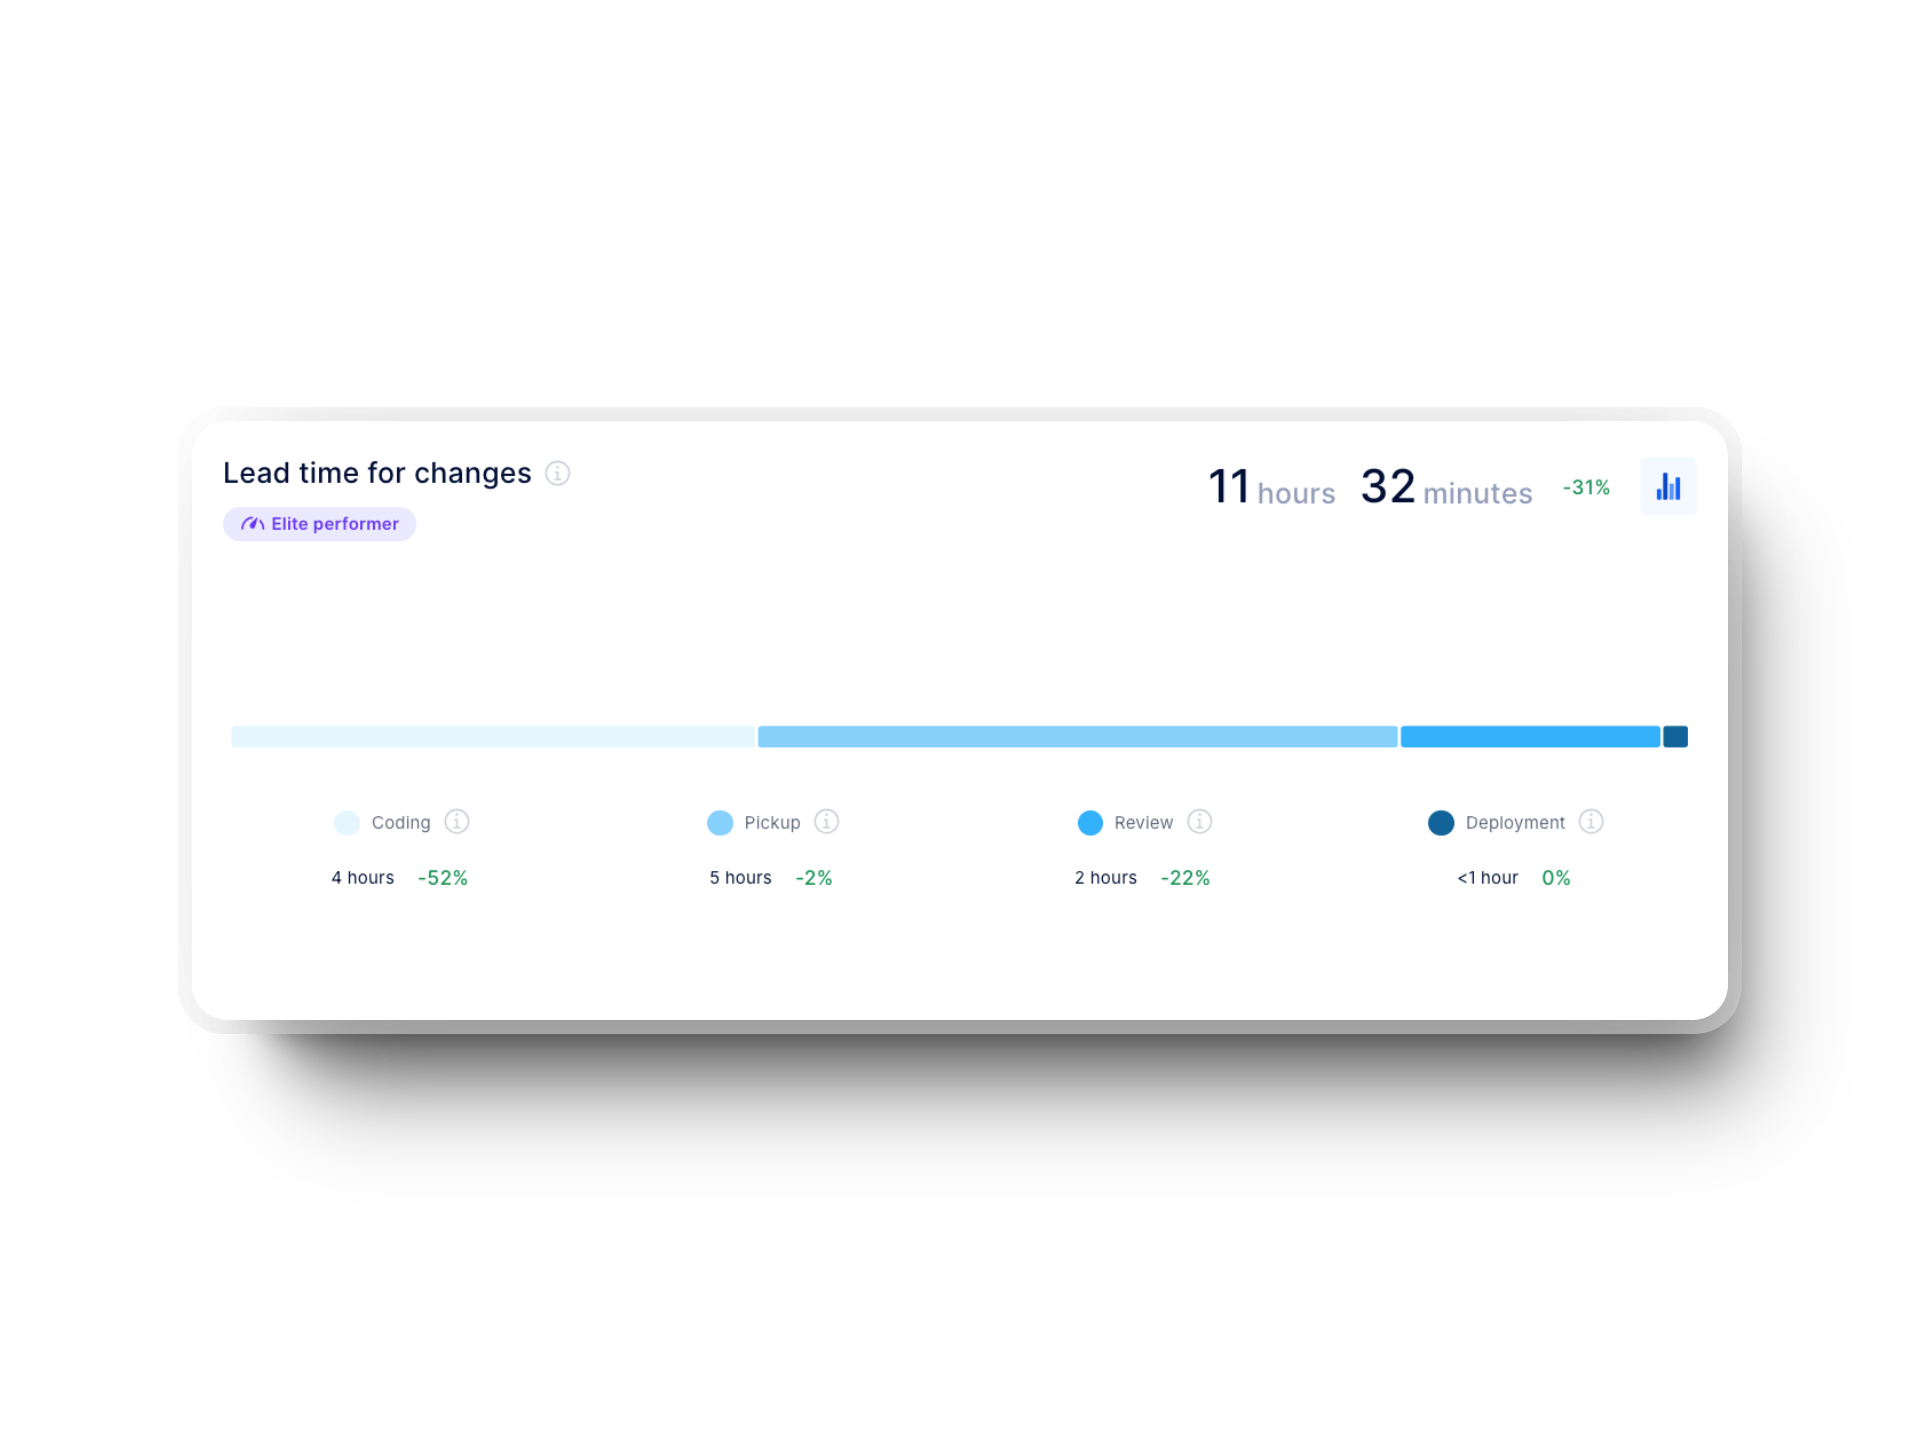
What it is: The time it takes for a code change to go from commit to production.
Short lead times for changes suggest a smooth and efficient development pipeline. It means you can implement and deploy changes quickly.
Source: Axify and version control systems (e.g., GitHub, Bitbucket) and CI/CD pipelines.
3. Failed Deployment Recovery Time
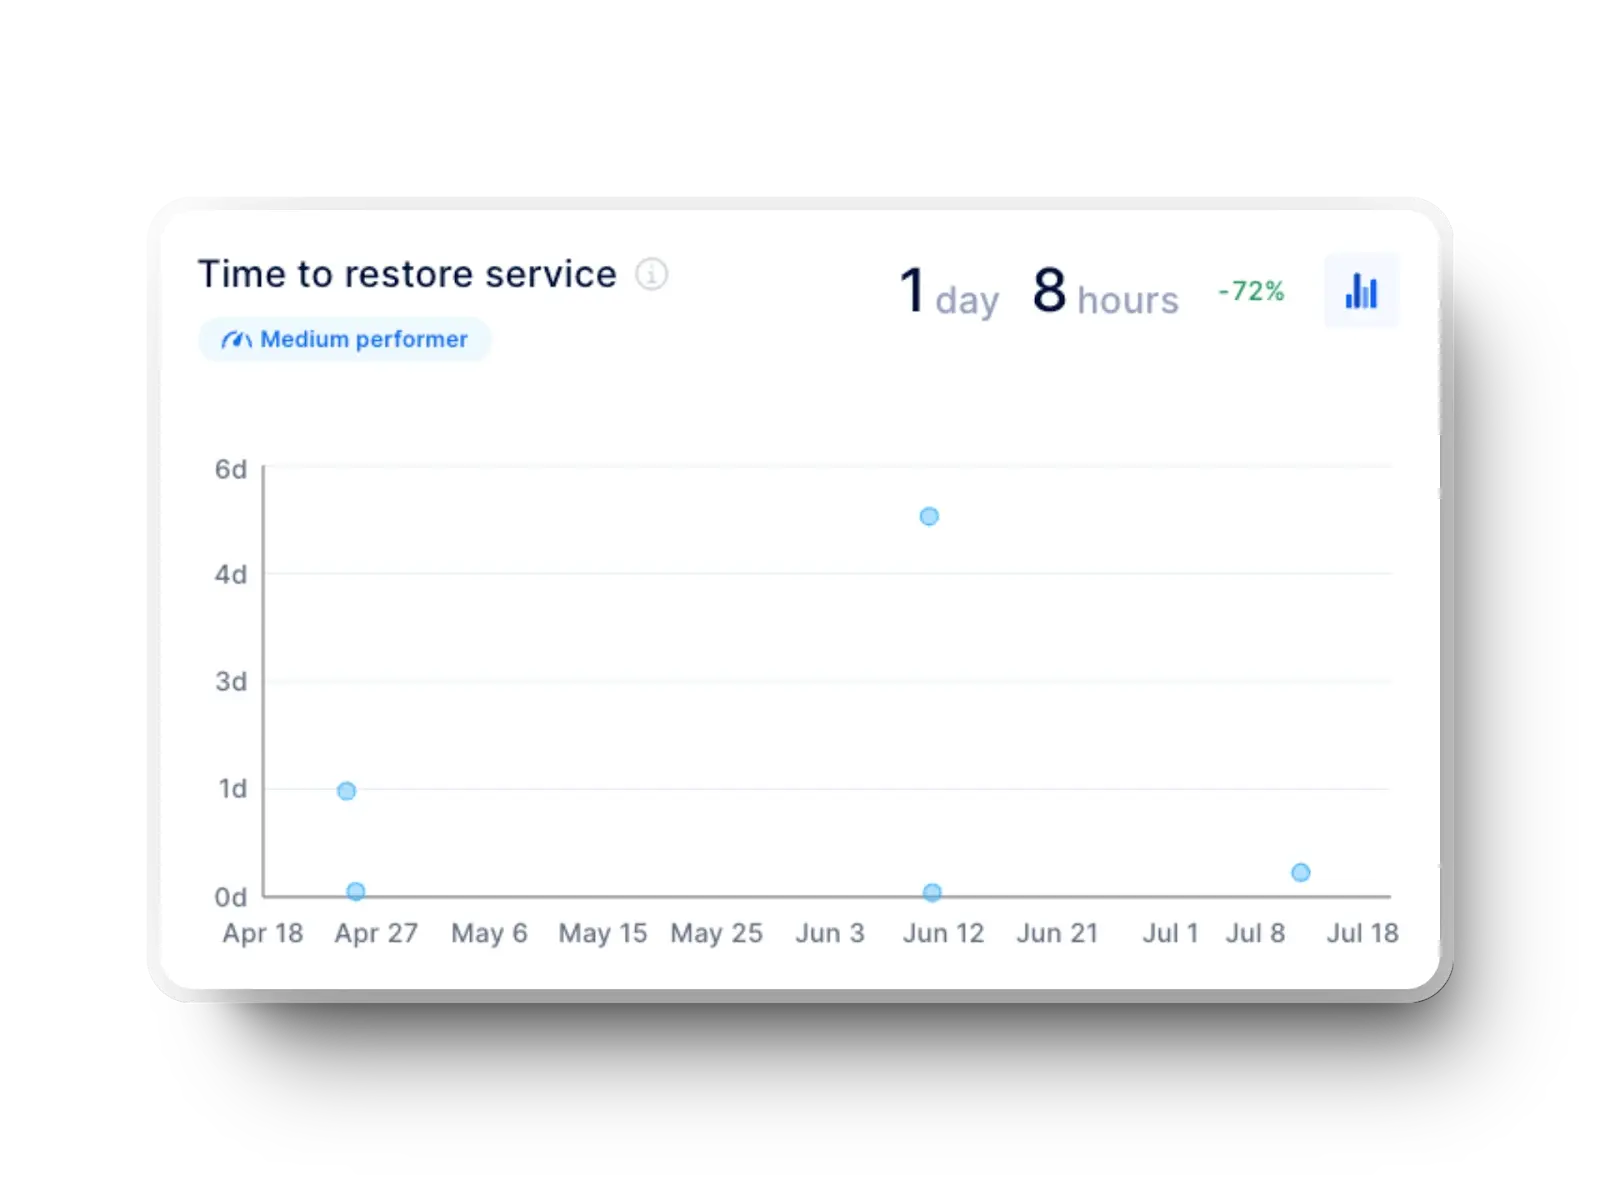
What it is: The average time it takes to restore service after an incident or failure. It’s also called “time to restore service” or “mean time to recovery (MTTR)”.
A lower failed deployment recovery time means you have a solid incident response and recovery process. This streamlined process minimizes downtime and impact on users.
Source: Axify and incident management tools (e.g., PagerDuty, Opsgenie) and monitoring systems.
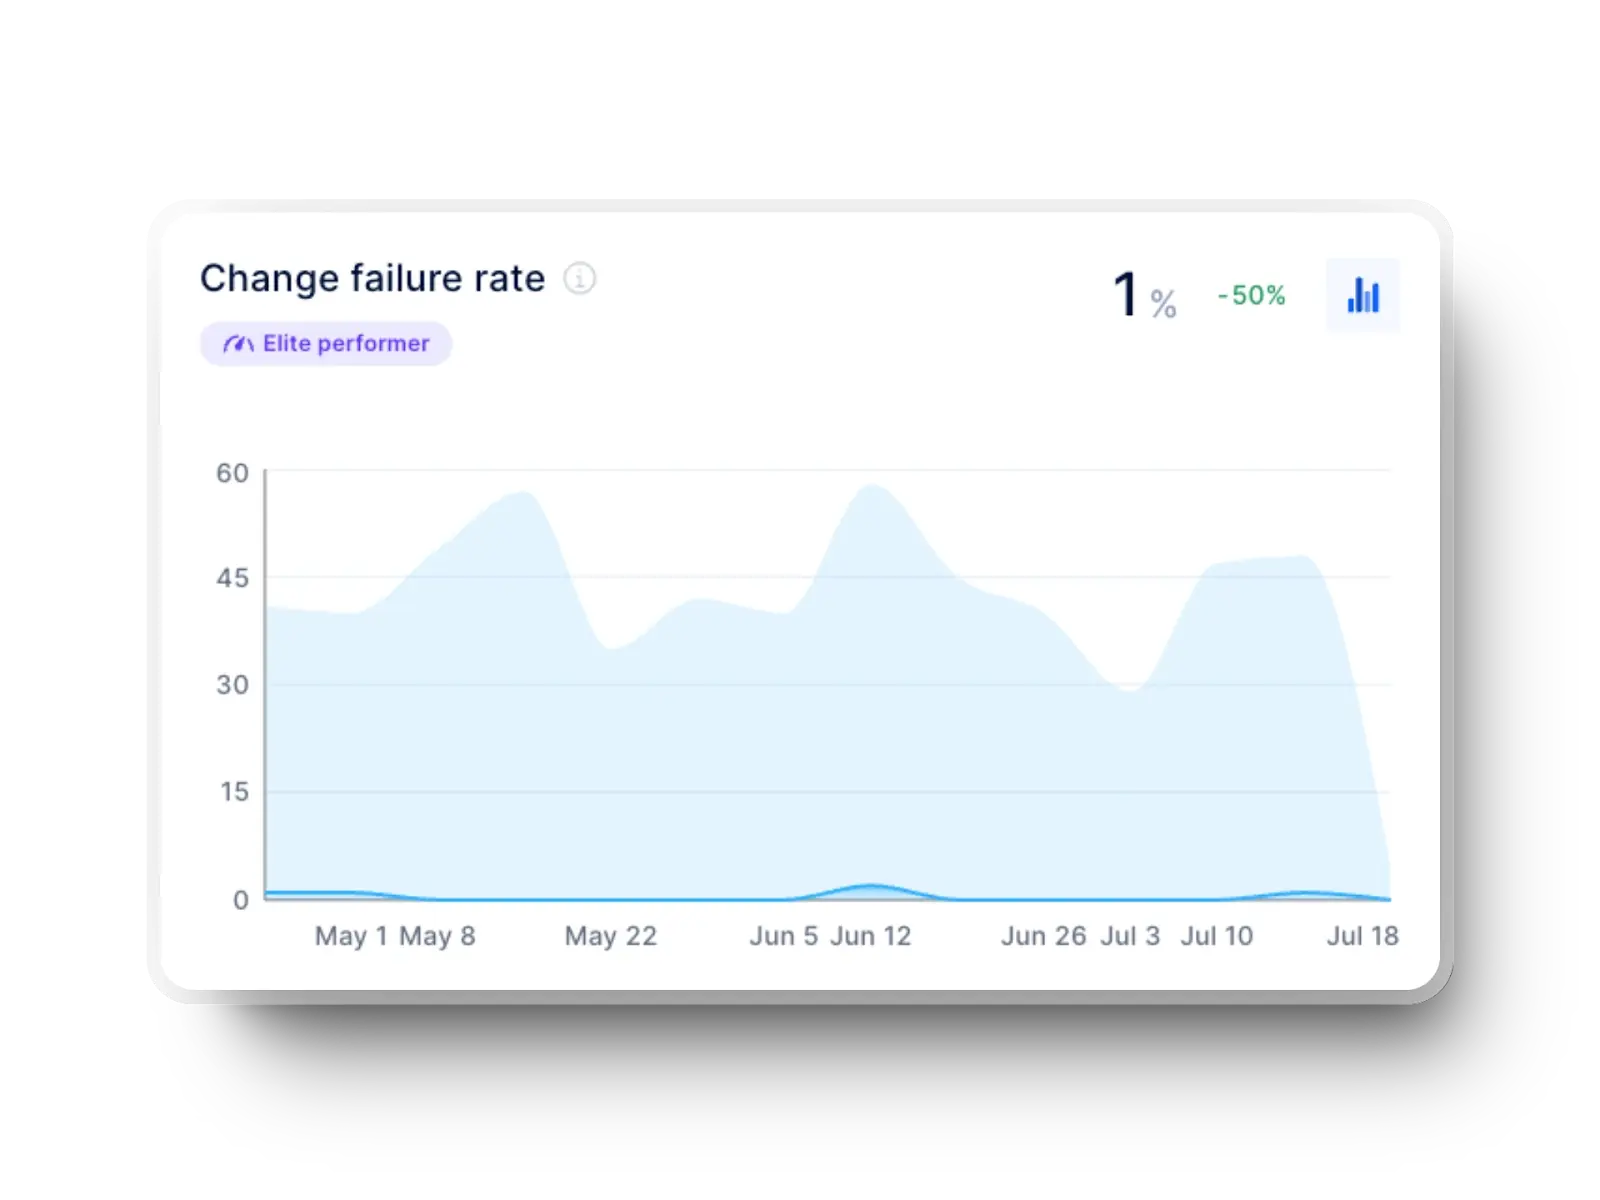
4. Change Failure Rate
What it is: The percentage of deployments that fail in production.
This metric helps assess the quality and stability of releases. A high change failure rate means you must improve testing and validation processes.
Source: Axify, CI/CD tools, and production monitoring systems.
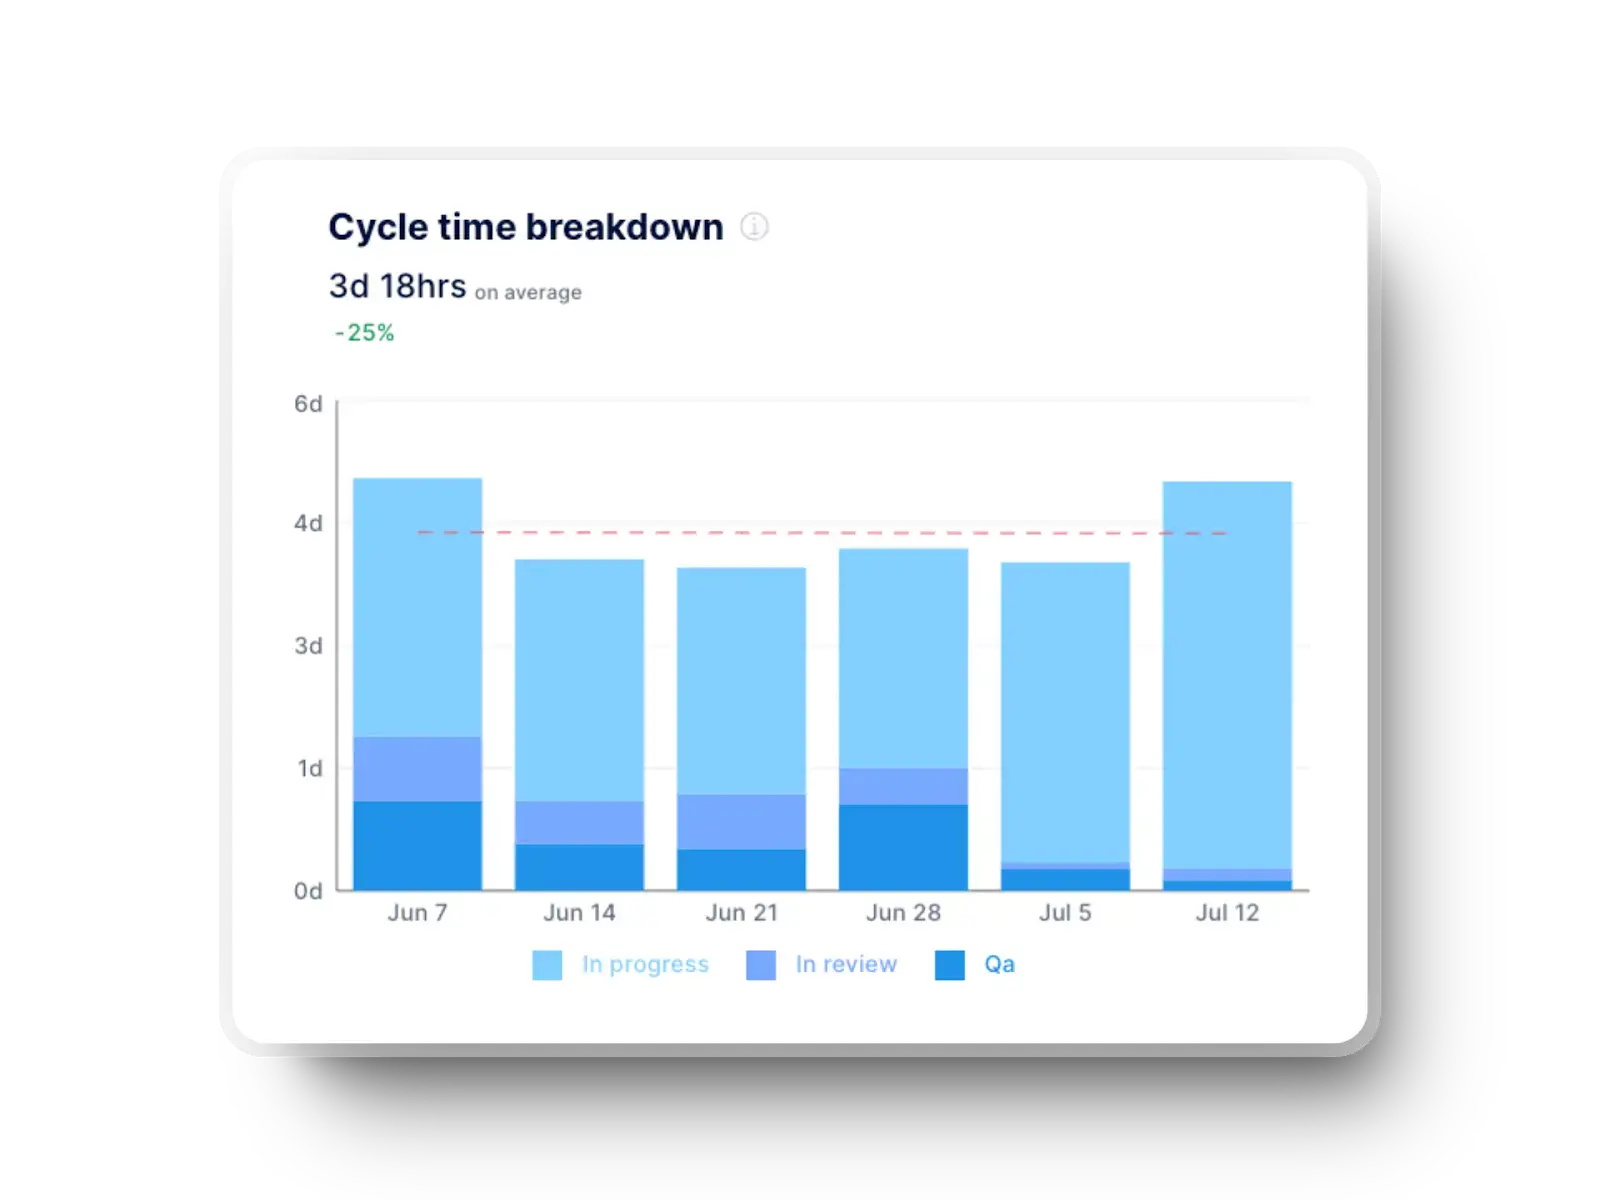
5. Cycle Time
What it is: The time taken from when a task is started to when it’s completed.
Cycle time indicates delays or interruptions. When broken down by stages such as coding, review, and QA, it reveals where time accumulates and where delays occur, like so:
Source: Project management tools (e.g., Jira, Azure DevOps) and Axify.
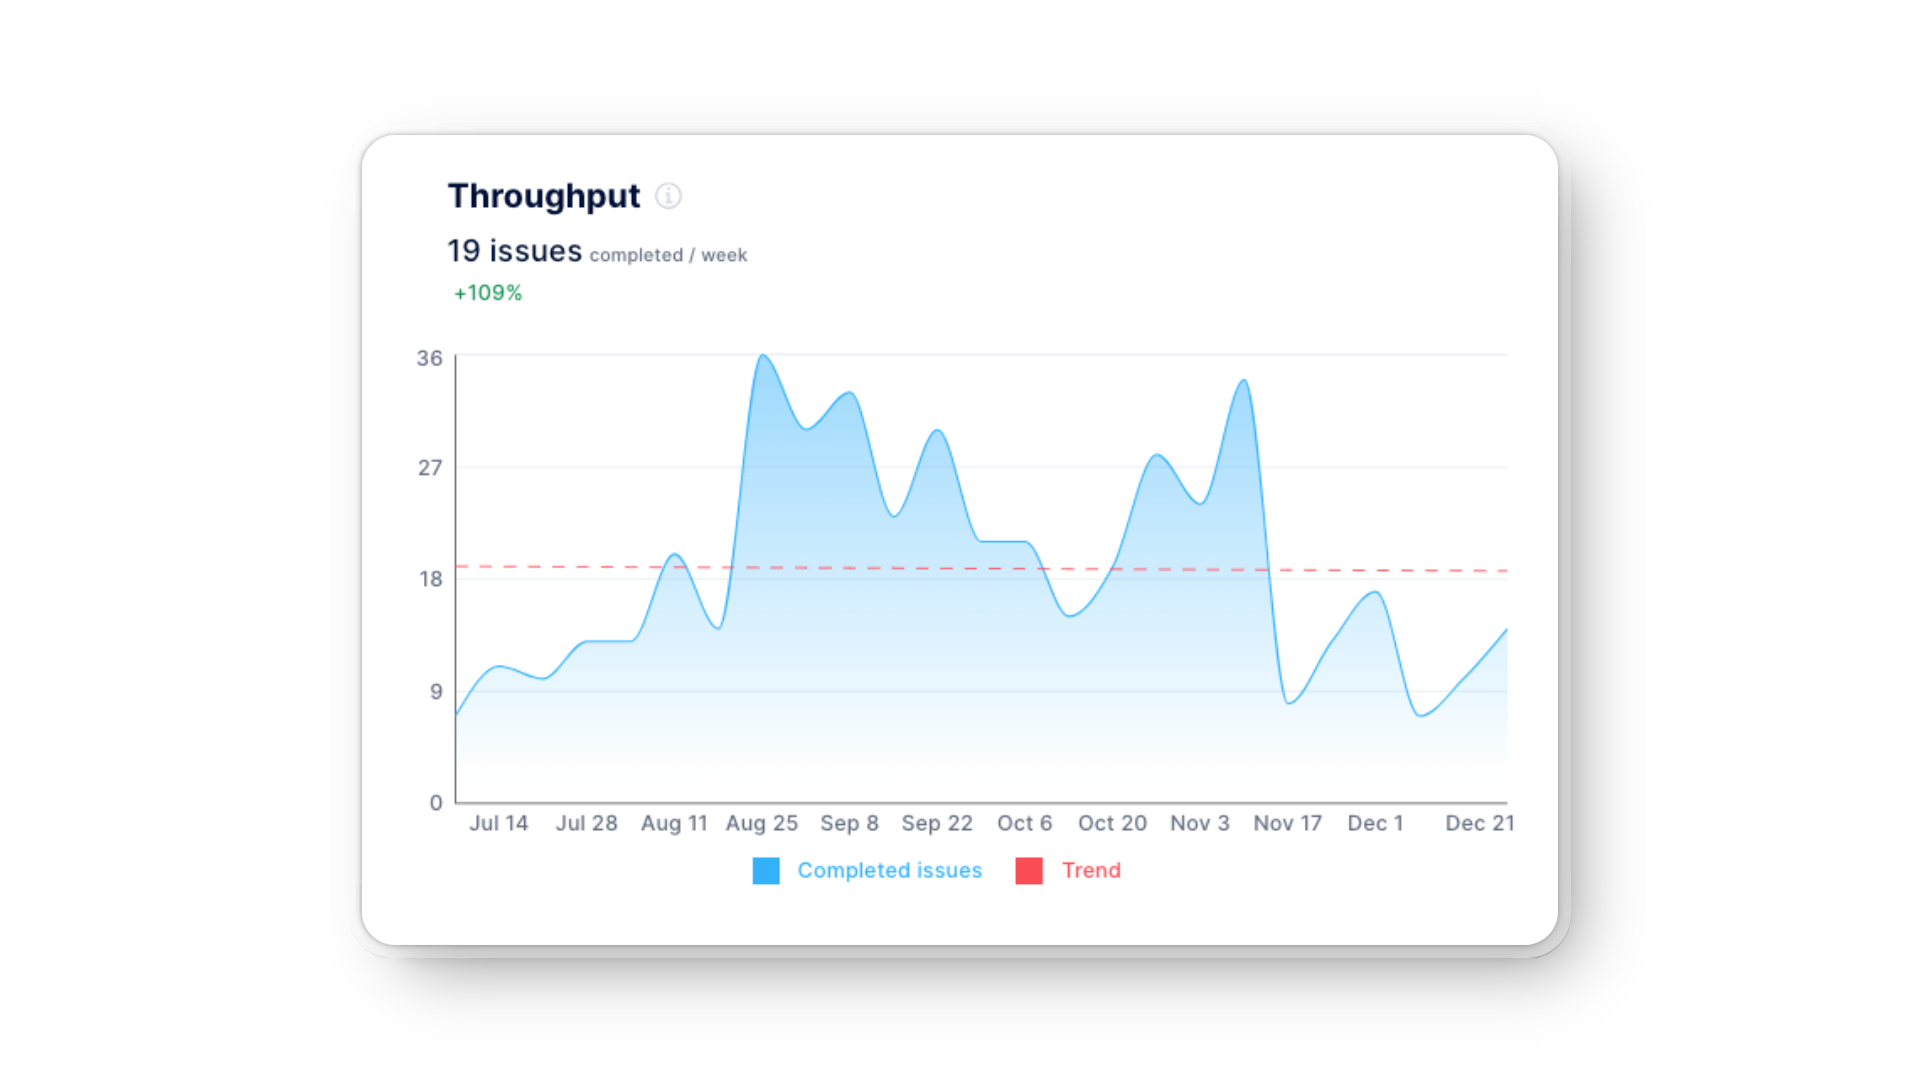
6. Throughput
What it is: The number of work items (e.g., features, bugs) completed in a period.
Throughput reflects your team’s productivity. More importantly, it can help you forecast future work.
Source: Project management tools, CI/CD systems, and Axify.
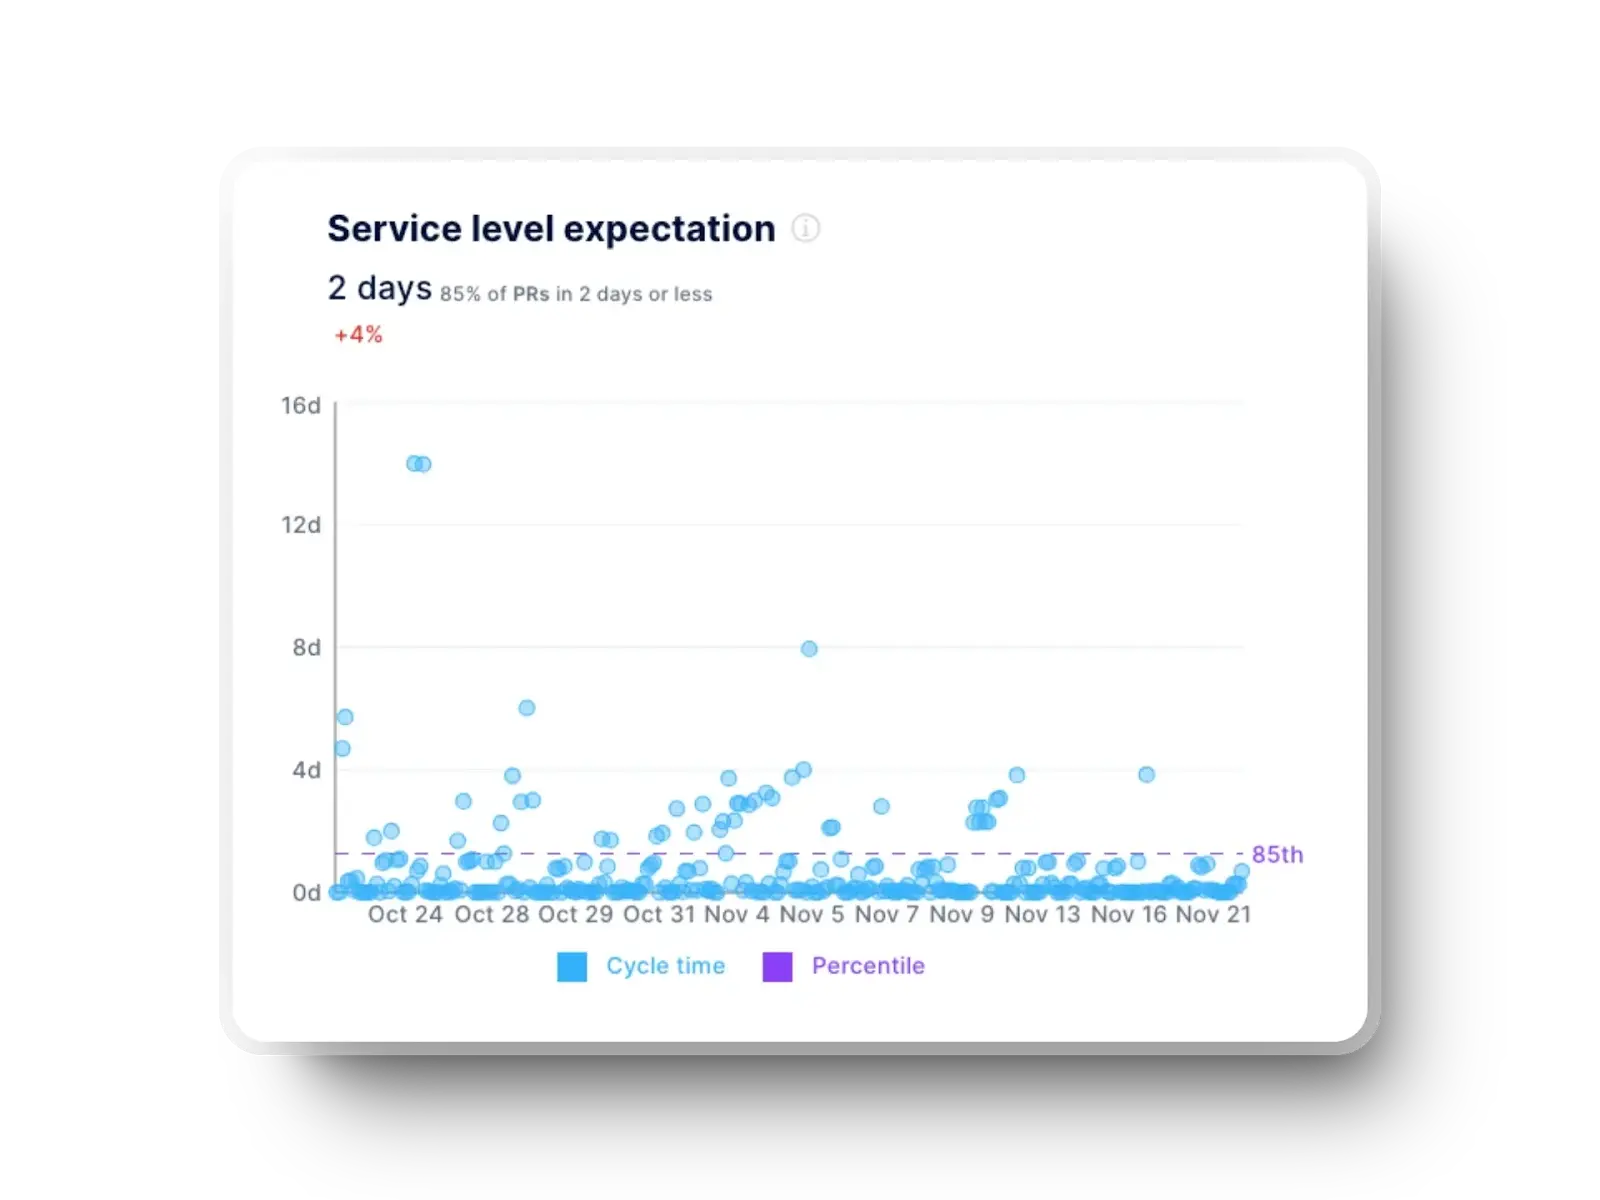
7. Service Level Objectives (SLOs) Compliance
What it is: Service Level Objectives measure how well your service meets predefined performance targets.
Good SLO compliance ensures customer satisfaction and meeting service agreements.
Source: Monitoring and alerting tools (e.g., Prometheus, Datadog).
8. Error Rates
What it is: The frequency of errors occurring in the production environment.
Tracking error rates helps you understand software stability and reliability.
Source: Application performance monitoring (APM) tools (e.g., New Relic, Dynatrace).
9. System Uptime
What it is: The time the system is operational and available.
High uptime leads to better service reliability, so the ultimate goal is user trust.
Source: Infrastructure monitoring tools (e.g., Nagios, Zabbix).
10. Code Quality Metrics
What it is: Code quality metrics is an umbrella term for metrics such as code coverage, cyclomatic complexity, and technical debt.
High code quality ensures maintainability and readability and reduces the likelihood of defects.
Source: Code analysis tools (e.g., SonarQube, CodeClimate).
11. Customer Satisfaction (CSAT)
What it is: Measures how satisfied users are with the product.
High customer satisfaction indicates that the product meets user needs and expectations.
Source: Surveys and feedback tools (e.g., SurveyMonkey, Qualtrics).
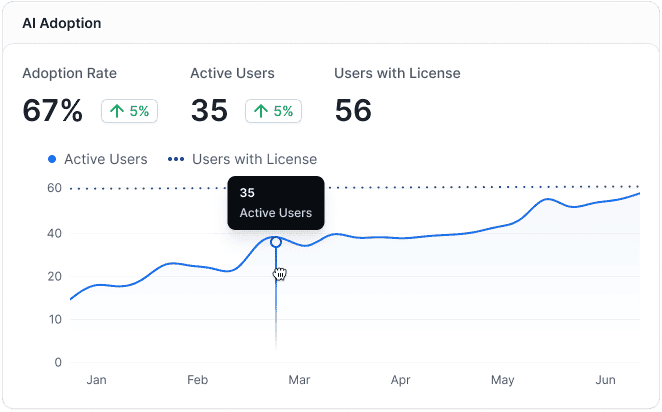
12. AI Adoption
What it is: Measures how actively your team uses AI tools in daily work.
AI adoption shows whether tools like Copilot or Claude are actually part of the workflow or just enabled in the background.
Axify tracks real adoption through usage frequency, interaction volume, and how recently developers used AI. This helps you see if AI is truly integrated into development or ignored after rollout.
Source: Axify AI Impact and AI development tools (e.g., GitHub Copilot, Cursor, Claude Code).
13. AI Acceptance Rate
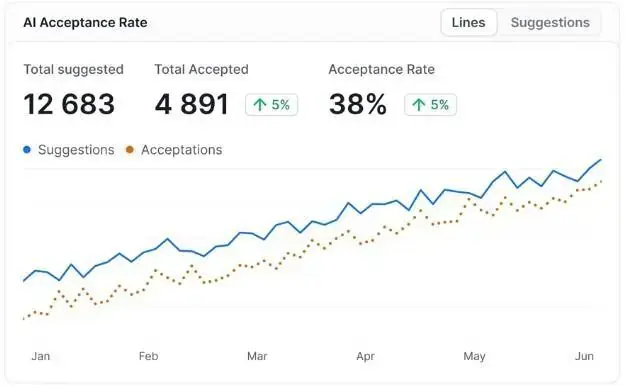
What it is: The percentage of AI-generated suggestions that developers accept.
Acceptance rate reflects trust in AI outputs and how useful those suggestions are in real tasks.
A low acceptance rate typically points to poor suggestion quality or misalignment with your codebase. A higher rate shows that AI is helping developers move faster without adding friction.
Source: Axify AI Impact and AI development tools (e.g., GitHub Copilot, Cursor, Claude Code).
14. AI Impact on Delivery Metrics
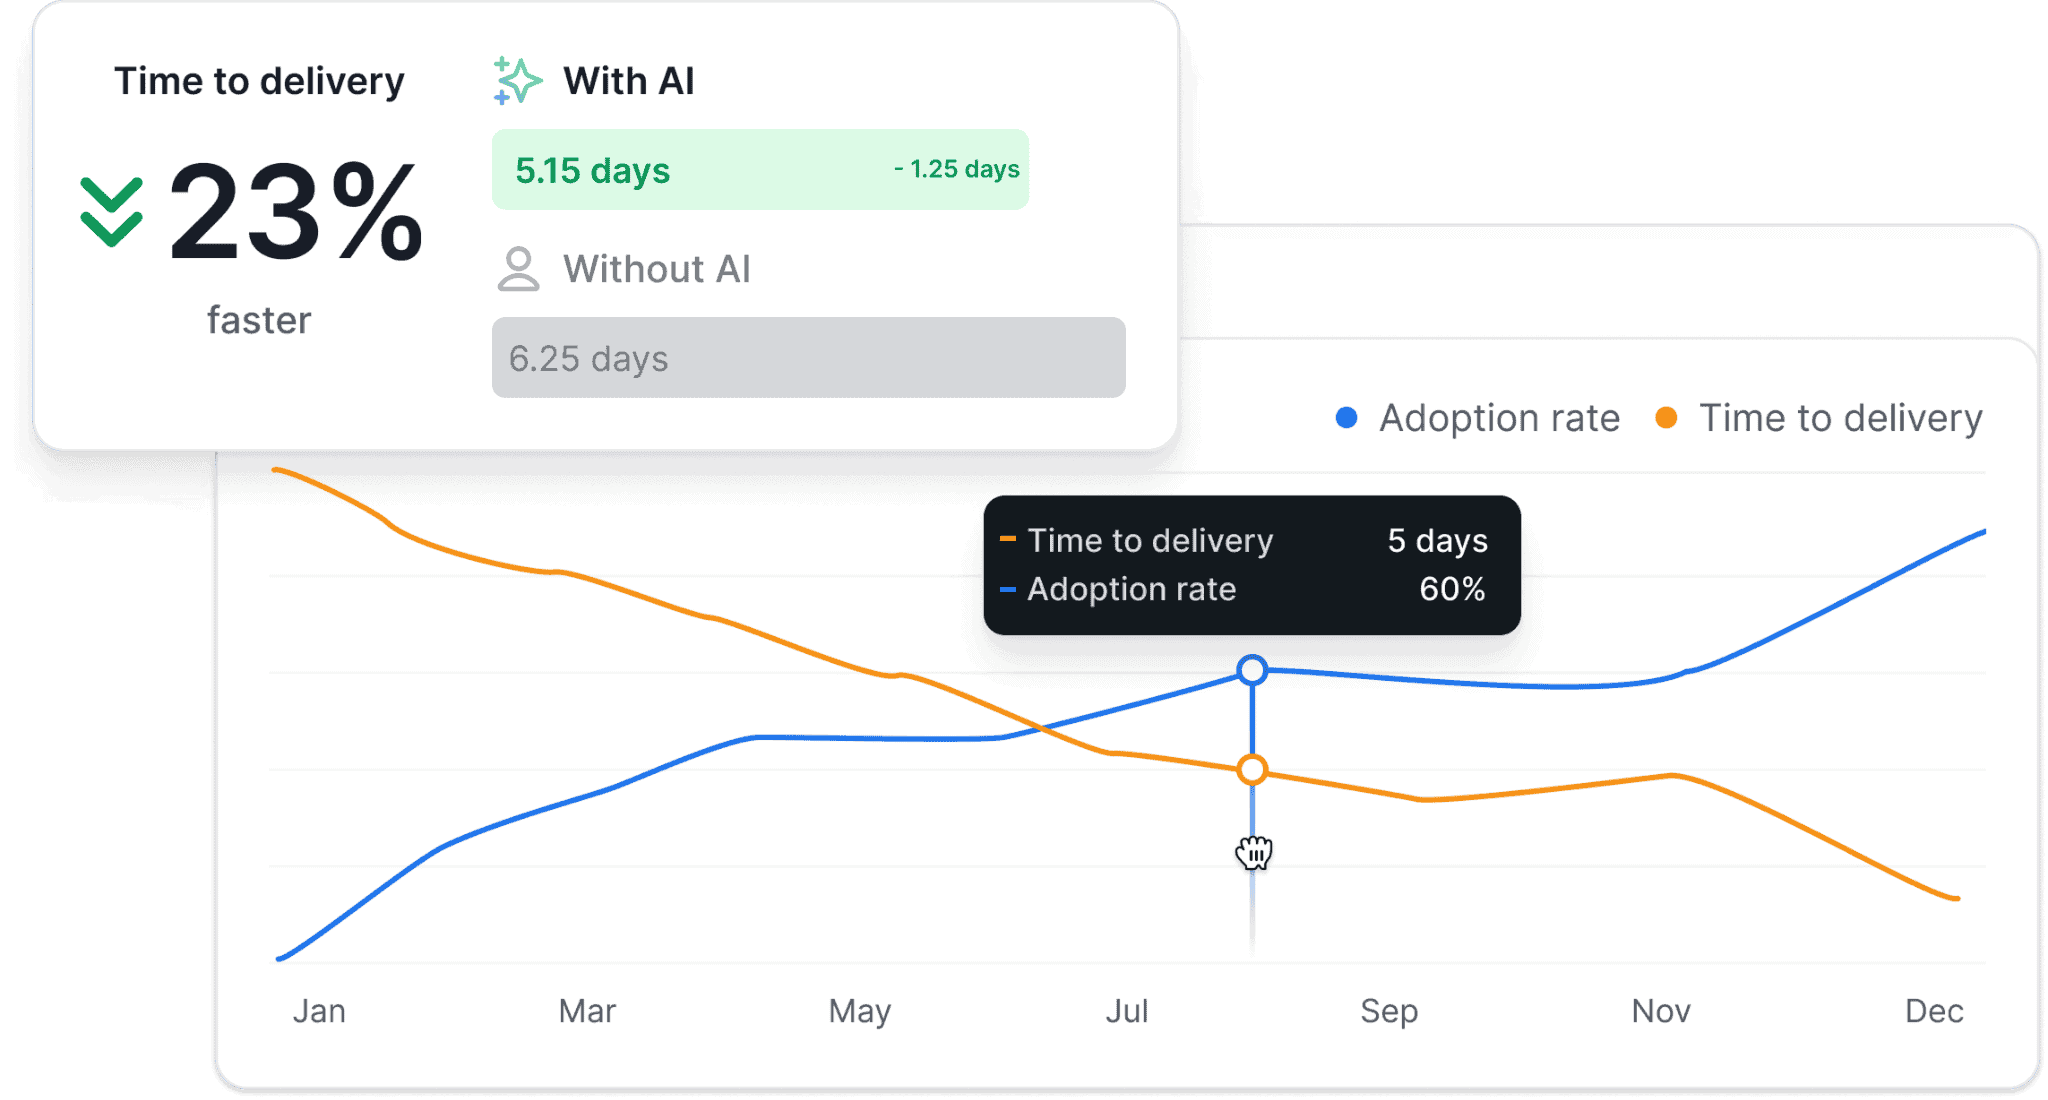
What it is: Measures how AI usage affects key delivery metrics like cycle time, throughput, rework, and delays.
AI tools can speed up coding, but their real impact shows across the entire workflow.
Axify connects AI usage with delivery outcomes. It shows whether AI reduces review delays, improves pull request quality, or introduces new bottlenecks. This makes it easier to understand if AI improves flow or shifts problems to later stages.
Source: Axify AI Impact, project management tools (e.g., Jira, Azure DevOps), and CI/CD systems.
Why Use a DevOps Dashboard?
A DevOps dashboard is a must-use tool for modern software development and operations teams because it streamlines workflows and improves visibility. The result is better software quality and enhanced customer satisfaction.
Let’s review all the benefits of a DevOps dashboard:
- Enhanced visibility: A DevOps dashboard gives you a centralized view of all essential metrics and data points. And you’ll get them across the entire software development lifecycle. Therefore, your teams can easily monitor their projects’ status and progress.
- Real-time monitoring: When changes occur within the development pipeline (such as code commits, builds, tests, and deployments) they’re instantly reflected on the dashboard. Real-time monitoring helps teams respond quickly to any issues that arise, ensuring smoother and more reliable software delivery.
- Improved decision-making: Real-time information and insights enable better decision-making. Your team can react promptly to any issues based on the most current data. This means more effective problem-solving and strategic planning.
- Increased efficiency: A DevOps dashboard streamlines processes and reduces manual data collection, resulting in better operational efficiency. Your team will now focus more on development and less on administrative tasks. The advantage here is accelerating the delivery cycle to improve user satisfaction.
- Enhanced collaboration: A unified platform improves communication between team members. Everyone can coordinate their efforts and solve issues more effectively when they have access to the same information.
- Continuous improvement: Tracking and analyzing your performance metrics helps you improve continuously. Your teams can quickly identify areas for improvement. They can also implement these changes and measure their impact, constantly honing their approach.
- Proactive issue resolution: Dashboards can highlight bottlenecks and inefficiencies in real time. That means every team can address issues before they escalate. This proactive approach minimizes disruptions and maintains your development pipeline flow.
- Alignment with business goals: DevOps dashboards help you track workloads, processes, and key performance indicators. And they’re all related to your business goals. Leveraging your DevOps dashboard correctly ensures your development process supports your broader organizational aims. The result is delivering more value to your stakeholders and end users.
- Enhanced accountability: With detailed tracking of tasks and metrics, team members can see how their contributions affect progress. This transparency promotes accountability and encourages team members to take ownership of their work.
DevOps Dashboard Examples
Different teams use dashboards in different ways depending on their role and priorities. What matters is if the dashboard reflects real work and supports your daily decisions.
Here are a few DevOps dashboard examples that show how this looks in practice.
Personal Focus Dashboard
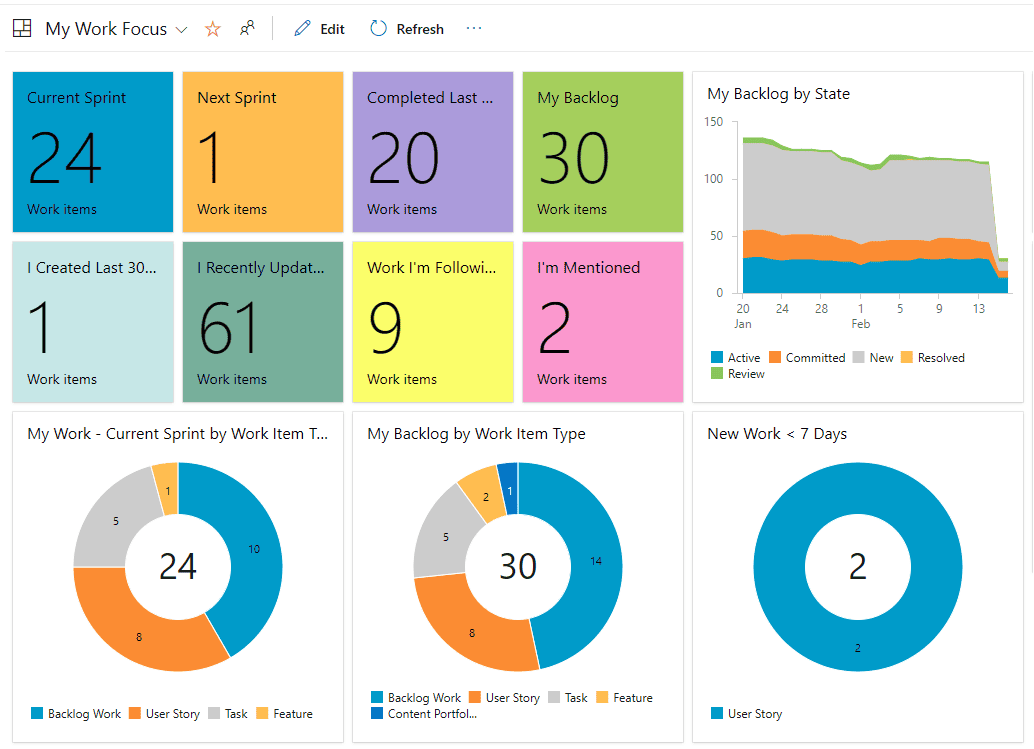
A common challenge during a sprint is deciding what actually deserves your attention next. Work keeps coming in, priorities shift, and it’s easy to spend time on tasks that don’t move anything forward.
This dashboard helps you stay focused on what matters most. You can see what’s in your current sprint, what’s already completed, and what’s still sitting in your backlog. That makes it easier to spot unfinished work that should be closed before starting something new.
For example, if several items are already in progress while new ones keep getting picked up, you likely have a prioritization issue. That usually leads to slower completion and more context switching.
Since each section shows your workload, recent activity, and pending tasks, you can decide what to finish first and keep your work moving without spreading attention too thin.
Here’s what that might look like:
DORA Metrics Dashboard
Let’s say delivery starts to slow down, but the cause isn’t obvious. Releases take longer, incidents take more time to resolve, and it’s unclear which part of the process is responsible.
This DORA metrics dashboard helps you trace that back to a specific stage of the SDLC, like so:
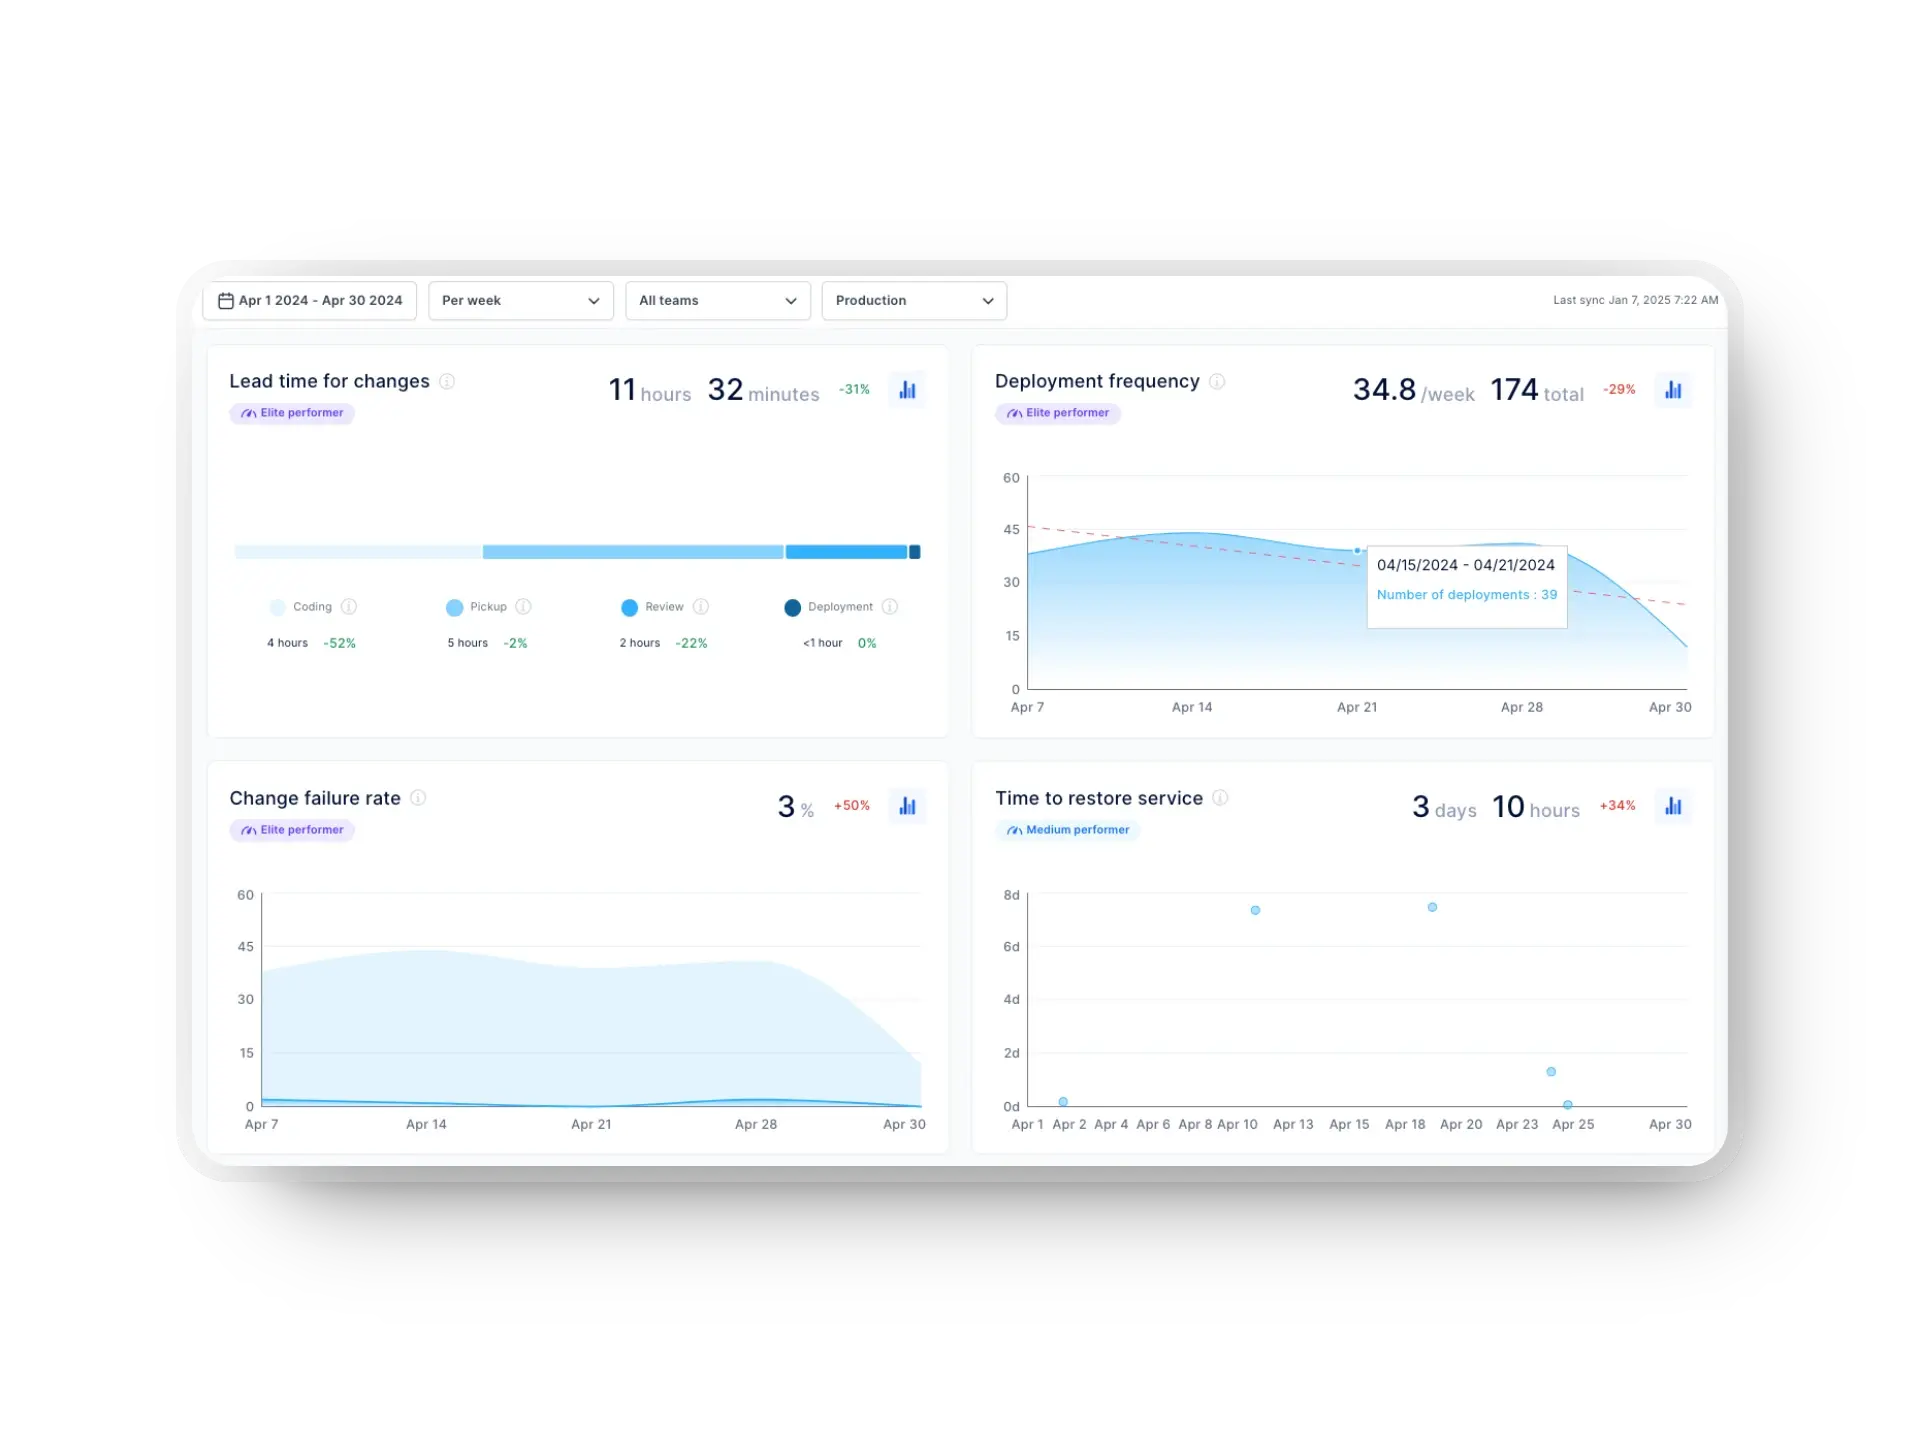
In the image above, you can see lead time for changes broken into coding, pickup, review, and deployment, which shows where delays actually happen. If review time increases while other stages stay stable, the issue sits in pull requests.
Now look at deployment frequency, which shows how often code reaches a production environment. A drop here usually points to friction in the release process.
Change failure rate shows how often deployments introduce problems, while time to restore service (now called failed deployment recovery time) reflects how quickly the team recovers.
Analyzing these metrics connects cause and impact.
That means you can identify the exact stage creating problems and adjust how work moves through the system.
Besides, DORA metrics are most useful when you read them together. That matters because they show the balance between delivery speed and software stability. Deployment frequency and lead time for changes show how quickly work reaches production. Change failure rate and failed deployment recovery time show whether that speed is creating production risk.
Sprint Dashboard
Work can appear active during a sprint without progressing. Items move through the workflow, but some remain in the same stage while others complete.
A sprint dashboard focuses on active work.
It shows where current items sit in stages such as planning, development, and post-development, and how long they have been there.
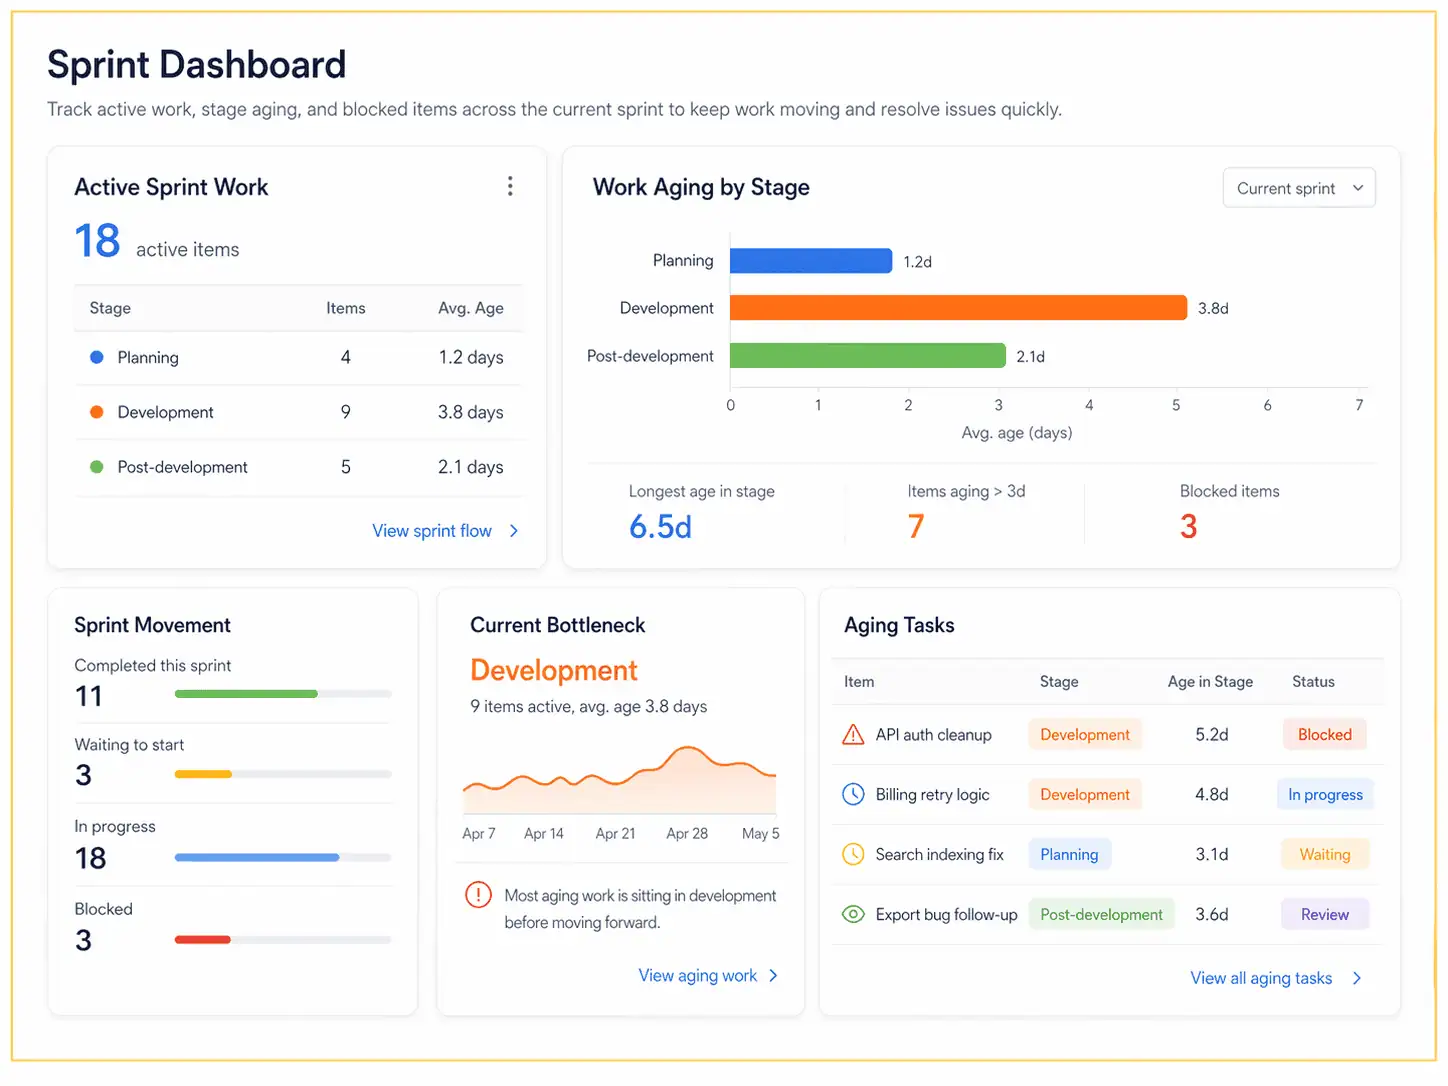
If several items remain in development without completing, or wait too long before starting, the issue is within the current sprint. The goal is to identify blocked or slow-moving work and resolve it immediately.
This changes how stand-ups are used. Instead of reviewing status, the team focuses on which items are not moving and what needs to happen to unblock those aging tasks.
Value Stream Mapping Dashboard
Delivery can feel slow even when individual items move. The issue is not always in active work, but in how the system behaves over time.
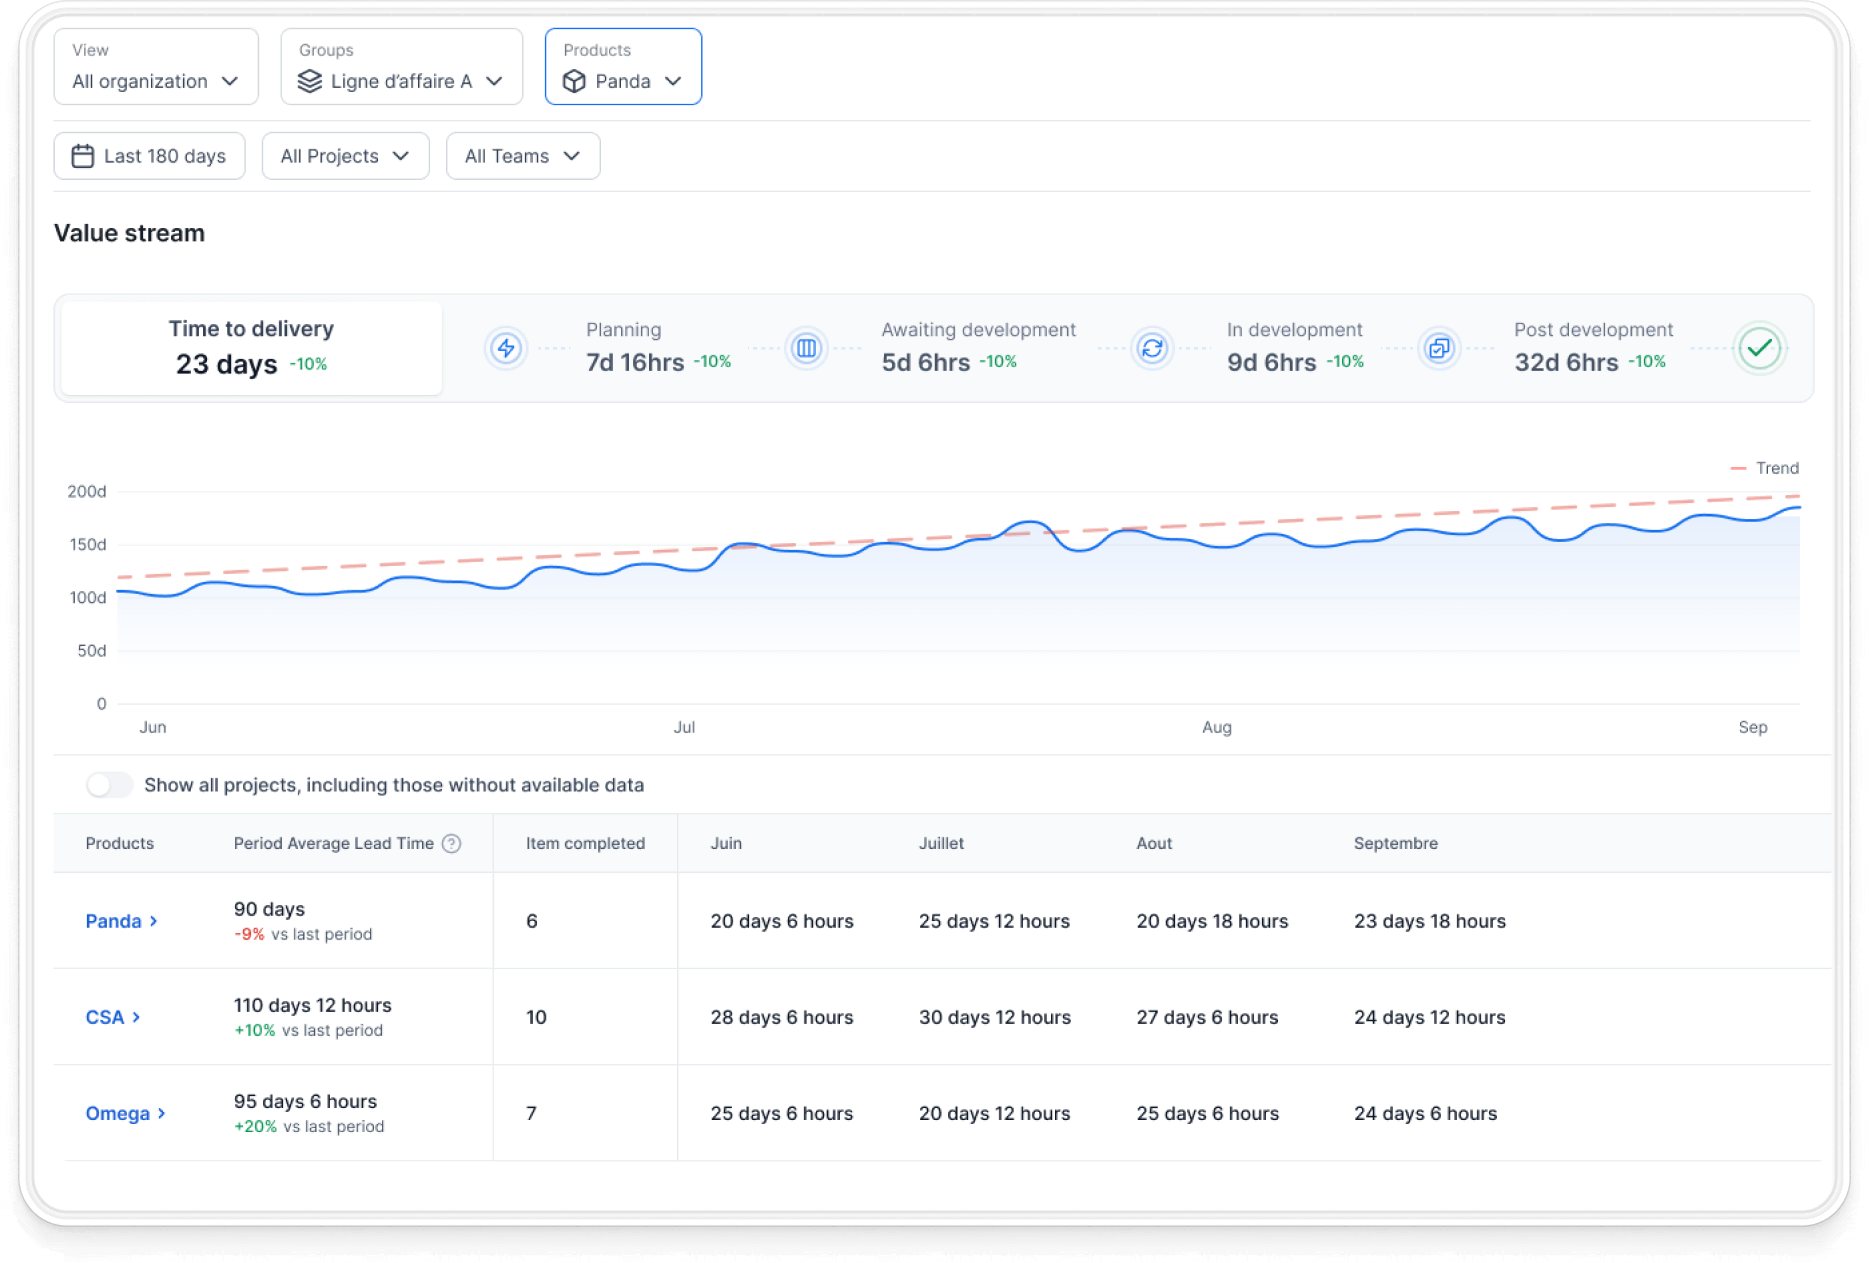
Unlike the sprint dashboard, a value stream mapping dashboard analyzes flow across the entire process. It measures how long work spends in each stage, such as development, review, and QA, across many items.
For example, if tasks spend more time waiting in review than in development, the delay comes from approvals rather than coding. Each item also shows how long it stayed in each stage. That helps connect overall delays to specific work, instead of relying on averages.
With that view, teams can focus on reducing wait times between steps and keep work moving across the entire process.
AI Impact Dashboard
AI tools may be implemented across the organization, but usage alone does not show whether they improve delivery. One team may use AI often and move quickly, while another may have low adoption and longer cycle times.
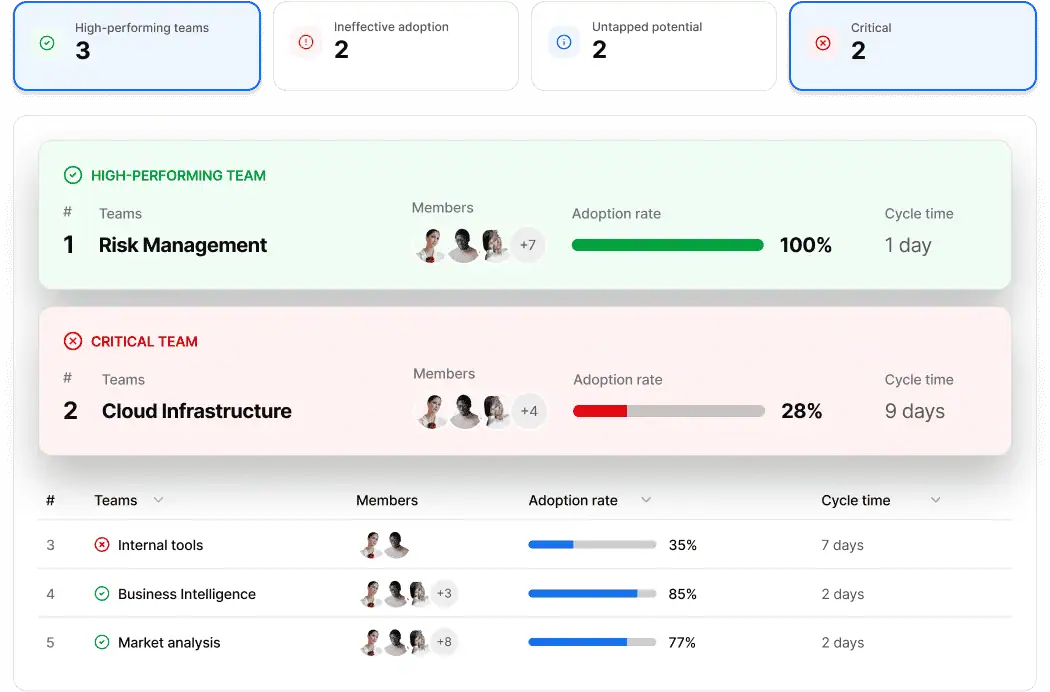
This dashboard groups teams based on that relationship.
It shows which teams are high-performing, which ones have ineffective adoption, which still have untapped potential, and which are in a critical state. That gives leaders a faster way to see where AI is translating into shorter cycle times and where it is falling short.
For example, a team with a 100% adoption rate and a one-day cycle time suggests that AI usage is well integrated into day-to-day work. A team with low adoption and a nine-day cycle time points to a very different situation. That may signal low trust in the tools, poor rollout, or workflow issues that AI has not improved.
This view makes it easier to compare teams, spot gaps in adoption, and decide where to intervene first.
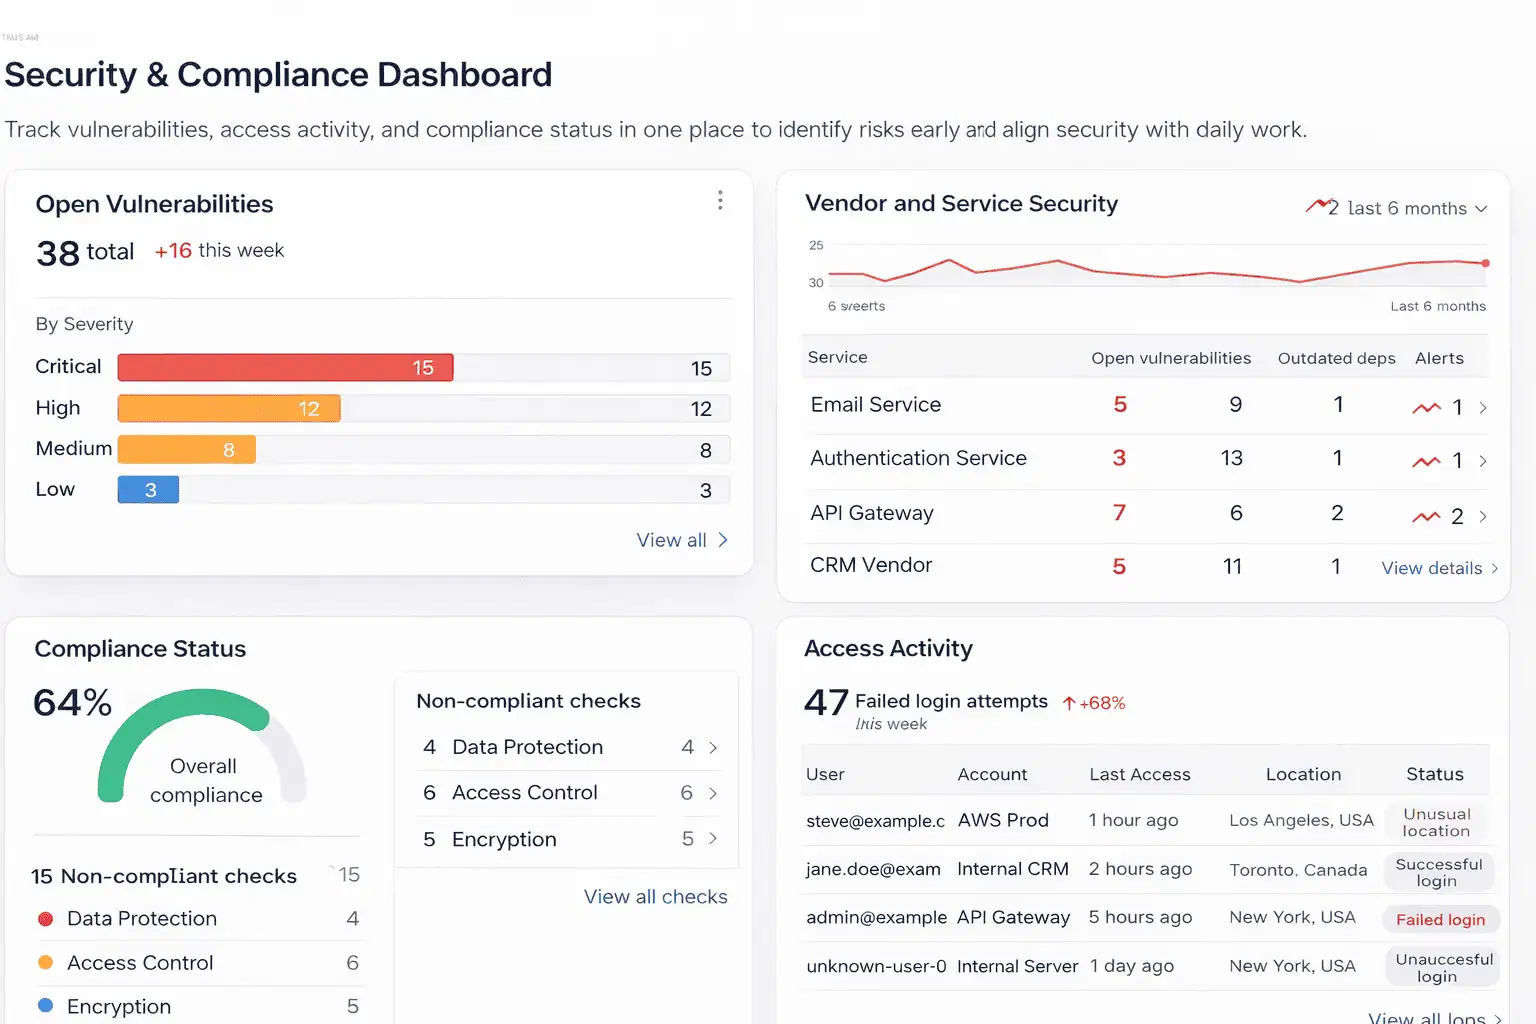
Security & Compliance Dashboard
Security issues tend to surface late, usually during audits or after a failure exposes them in production. At that point, fixing them becomes slower and more expensive.
This dashboard helps teams track vulnerabilities, access activity, and compliance status in one place. It points to risks such as outdated dependencies, misconfigurations, or unusual access patterns.
For example, if a service shows repeated vulnerabilities across releases, it signals a gap in how security checks are handled during development. That gives the team a clear area to fix before it affects production.
With this view, teams can address risks earlier and keep security aligned with daily work instead of treating it as a separate step.
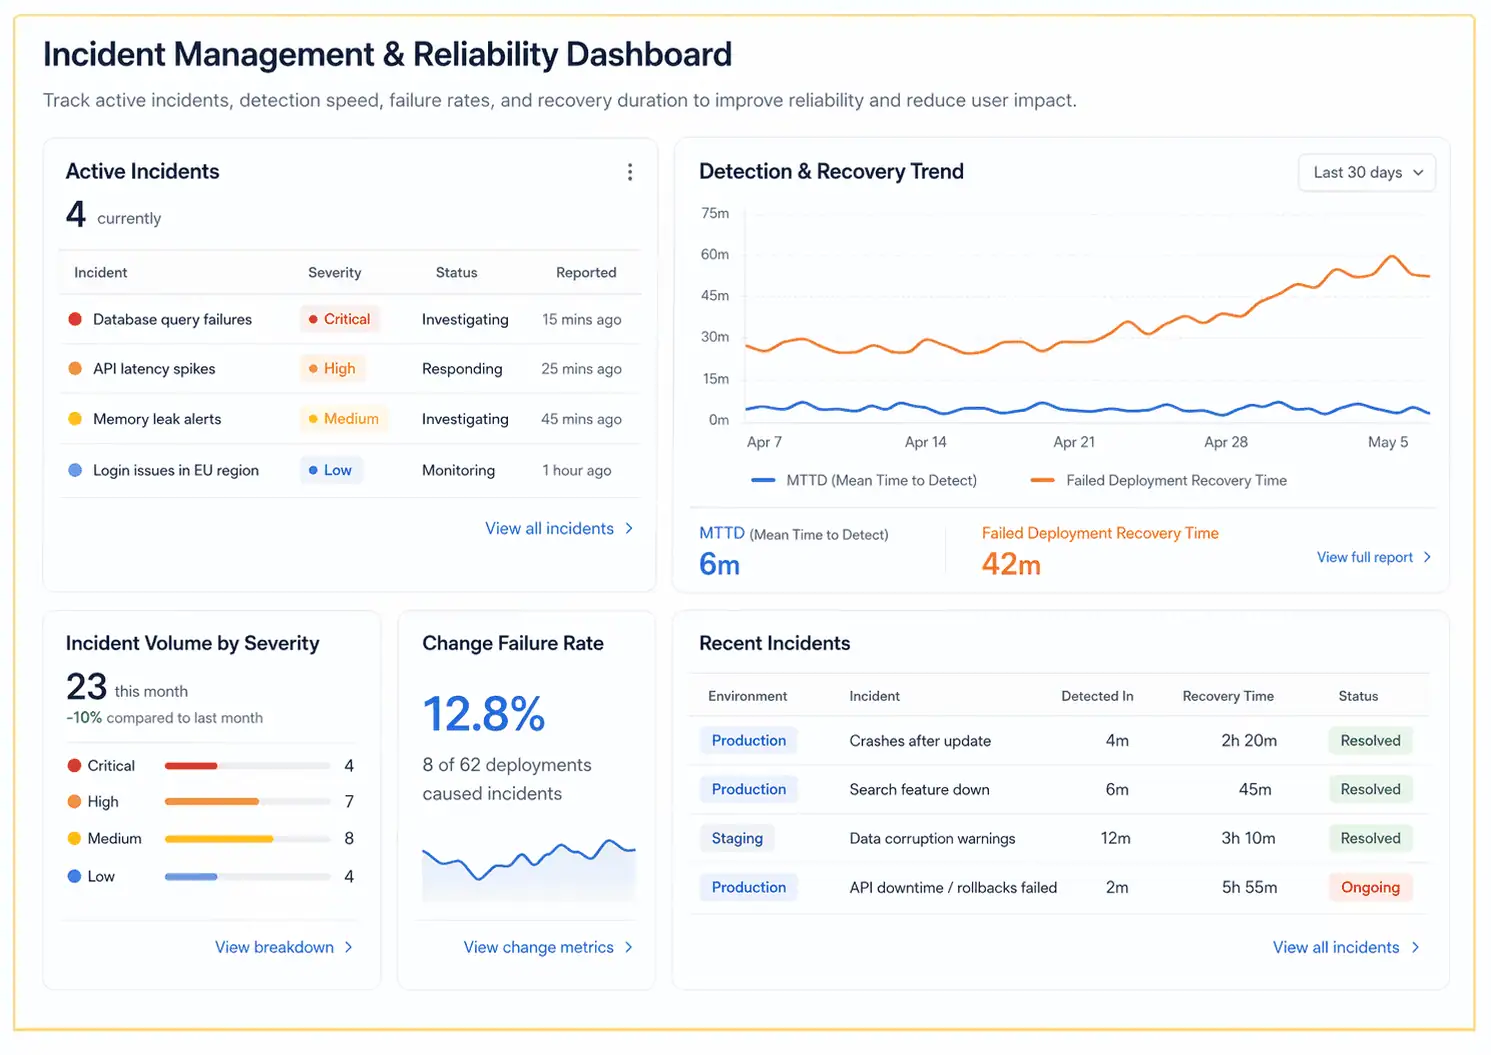
Incident Management & Reliability Dashboard
Incidents happen, but the real challenge is understanding how frequently they occur and how long recovery takes. Without that visibility, the same issues tend to repeat.
This dashboard shows active incidents, response times, and recovery duration across systems. It helps teams track patterns, such as recurring failures or slower responses during specific periods.
For example, if recovery time increases after certain deployments, it points to issues in rollback or incident response processes. That makes it easier to adjust how incidents are handled.
With this insight, teams can improve response speed and reduce the impact of failures on users.
How to Implement a DevOps Dashboard
Getting value from a DevOps dashboard should be your main goal. A clean interface means little if it doesn’t reflect how your team plans, builds, and delivers software.
These steps below show how you can set it up correctly, to maximize visibility and make sure it supports your engineering decisions.
Define Goals
DevOps adoption is already common, but clarity usually isn’t. That’s why over 50% of teams apply DevOps practices only sometimes or inconsistently. That gap usually comes from unclear goals, which makes it harder to know what to measure or improve.
So, we recommend starting with a clear question: what problem needs to be solved? That could be slower delivery, frequent incidents, or unclear priorities across teams. Without that focus, dashboards turn into collections of disconnected charts.
Choose Metrics
Once the goal is clear, it's time to pick metrics that reflect how your work moves. Focus on metrics tied to speed and quality.
Each metric should answer a specific question. For example, cycle time shows how long work takes, while failure rate shows how frequently releases cause issues. This makes it easier to connect data to real decisions.
Integrate Tools
Your data is likely recorded by multiple systems. This typically includes issue tracking (Jira), version control (GitHub, GitLab), CI/CD pipelines, and incident management tools.
Each system captures a different part of the workflow, and gaps between them break traceability.
So, integrate the systems that reflect how work moves through your delivery process to make sure metrics are calculated reliably.
For example, if deployments are not linked to commits or tickets, you cannot determine which changes caused failures. If incident data is isolated, you cannot connect reliability issues to delivery behavior.
Remember: This step is not about adding more tools. You’re making sure existing tools produce a consistent, connected view of how work moves from idea to production.
Axify is a great way to integrate tools easily (from project progress monitoring to coding assistants and incident response tools). That way, you get a single source of truth for the entire team with essential metrics, insights, and live decision support.
Set Alerts
Of course, some issues or changes in your metrics need your immediate attention. Alerts can help surface those moments without constant manual checking.
Start by defining conditions that indicate a meaningful change in system behavior. These should be tied to metrics that reflect delivery and reliability, such as DORA metrics.
We also advise you to set alerts for deviations from normal behavior. Otherwise, a high number of alerts reduces trust and slows response.
For example, an alert that shows increased recovery time after recent deployments is useful because it links cause and impact. An alert that only shows a metric value without context is not.
Monitoring and Sharing
Dashboards should be visible and used regularly, so don’t open them only during reviews. Sharing them across teams keeps everyone aligned on what’s happening.
Still, consistent monitoring is not common across all teams. Only 30% of developers actively track software or infrastructure performance as part of their daily work. That gap tends to lead to delayed reactions and missed early signals.
Decision-Making
The final step is turning insights into action. Data should point to what needs to change, whether that’s adjusting workflows, reducing work in progress, or improving incident response.
Follow a simple loop:
- Look for deviations from normal behavior. For example, lead time increases or deployment frequency drops.
- Break the metric down. Find where time or failures accumulate, such as review, testing, or deployment.
- Check what changed in that stage. This could be larger pull requests, unclear ownership, or gaps in validation.
- Apply a specific adjustment. For example, limit work in progress, adjust review ownership, or add validation before release.
- Measure the effect by tracking the same metric to confirm whether the change improved flow or introduced new issues.
Alternatively, you can use a DevOps dashboard that shows you live recommendations you can implement right from its platform. We’ll discuss that below; for now, let’s see:
Popular DevOps Dashboard Tools
Some DevOps dashboard tools emphasize flexibility and customization, while others offer more structured views with built-in integrations. Open-source options give you control and lower upfront cost, but they usually require setup and ongoing maintenance. Commercial platforms usually connect faster and provide ready-made views, though they come with licensing costs.
Here are a few commonly used options:
- Grafana: Open-source dashboarding tool used to visualize metrics from multiple data sources. Teams typically use it with Prometheus for infrastructure and system monitoring.
- Datadog: Commercial platform that combines monitoring, logging, and dashboards in one place, with strong integrations across cloud services.
- Azure Monitor: Native monitoring solution for Azure environments, used to track application performance and infrastructure metrics.
- New Relic: Observability platform that provides dashboards for application performance, logs, and traces across services.
- Prometheus + Grafana: Popular open-source combination for collecting and visualizing time-series data in real time.
Each option gives a different level of control, setup effort, and visibility depending on how your team works.
Axify DevOps Dashboard: From Visibility to Implementing Decisions
Most DevOps dashboards have a major limitation: they focus on visibility (which is great), but can’t help you make decisions. Many engineering leaders monitor metrics, see delivery patterns change, discuss them in meetings, and still feel unsure what action actually changes the outcome.
Axify expands the role of DevOps dashboards. It connects what you see with what you should do next, based on how work actually flows through your SDLC.
Let’s explain how that works in practice.
DORA Metrics Dashboard
Have you ever experienced delivery slowing down, and every team has a different opinion on why? Well, this dashboard can align everyone.
It tracks deployment frequency, lead time for changes, change failure rate, and failed deployment recovery time in one place, so you can see how delivery behaves over time.
You can also connect these metrics to real changes in your process. For example, if recovery time increases while deployment frequency stays stable, the issue points to how incidents are handled rather than how often you ship.
Axify automates data collection across your tools, so the view stays accurate without manual input.

Value Stream Mapping Dashboard
This dashboard breaks delivery into stages and shows exactly where time builds up across the flow.
You can see how long work spends in development, review, testing, or waiting between steps. That makes delays visible at the exact stage where they happen.
Axify also uses historical data to surface where inefficiencies appear and suggest where to focus first, so improvements target the part of the process that actually limits flow.

AI Adoption and Impact Dashboard
After you implement AI tools, the real question is whether they improve your delivery speed and stability. This dashboard connects usage with outcomes to answer this question.
It tracks adoption rates, active users, and acceptance of AI suggestions, then compares delivery performance with and without AI support.
You can see which teams actually ship faster with AI and which ones show no change. That turns AI from a usage metric into a delivery signal tied to cycle time and throughput.
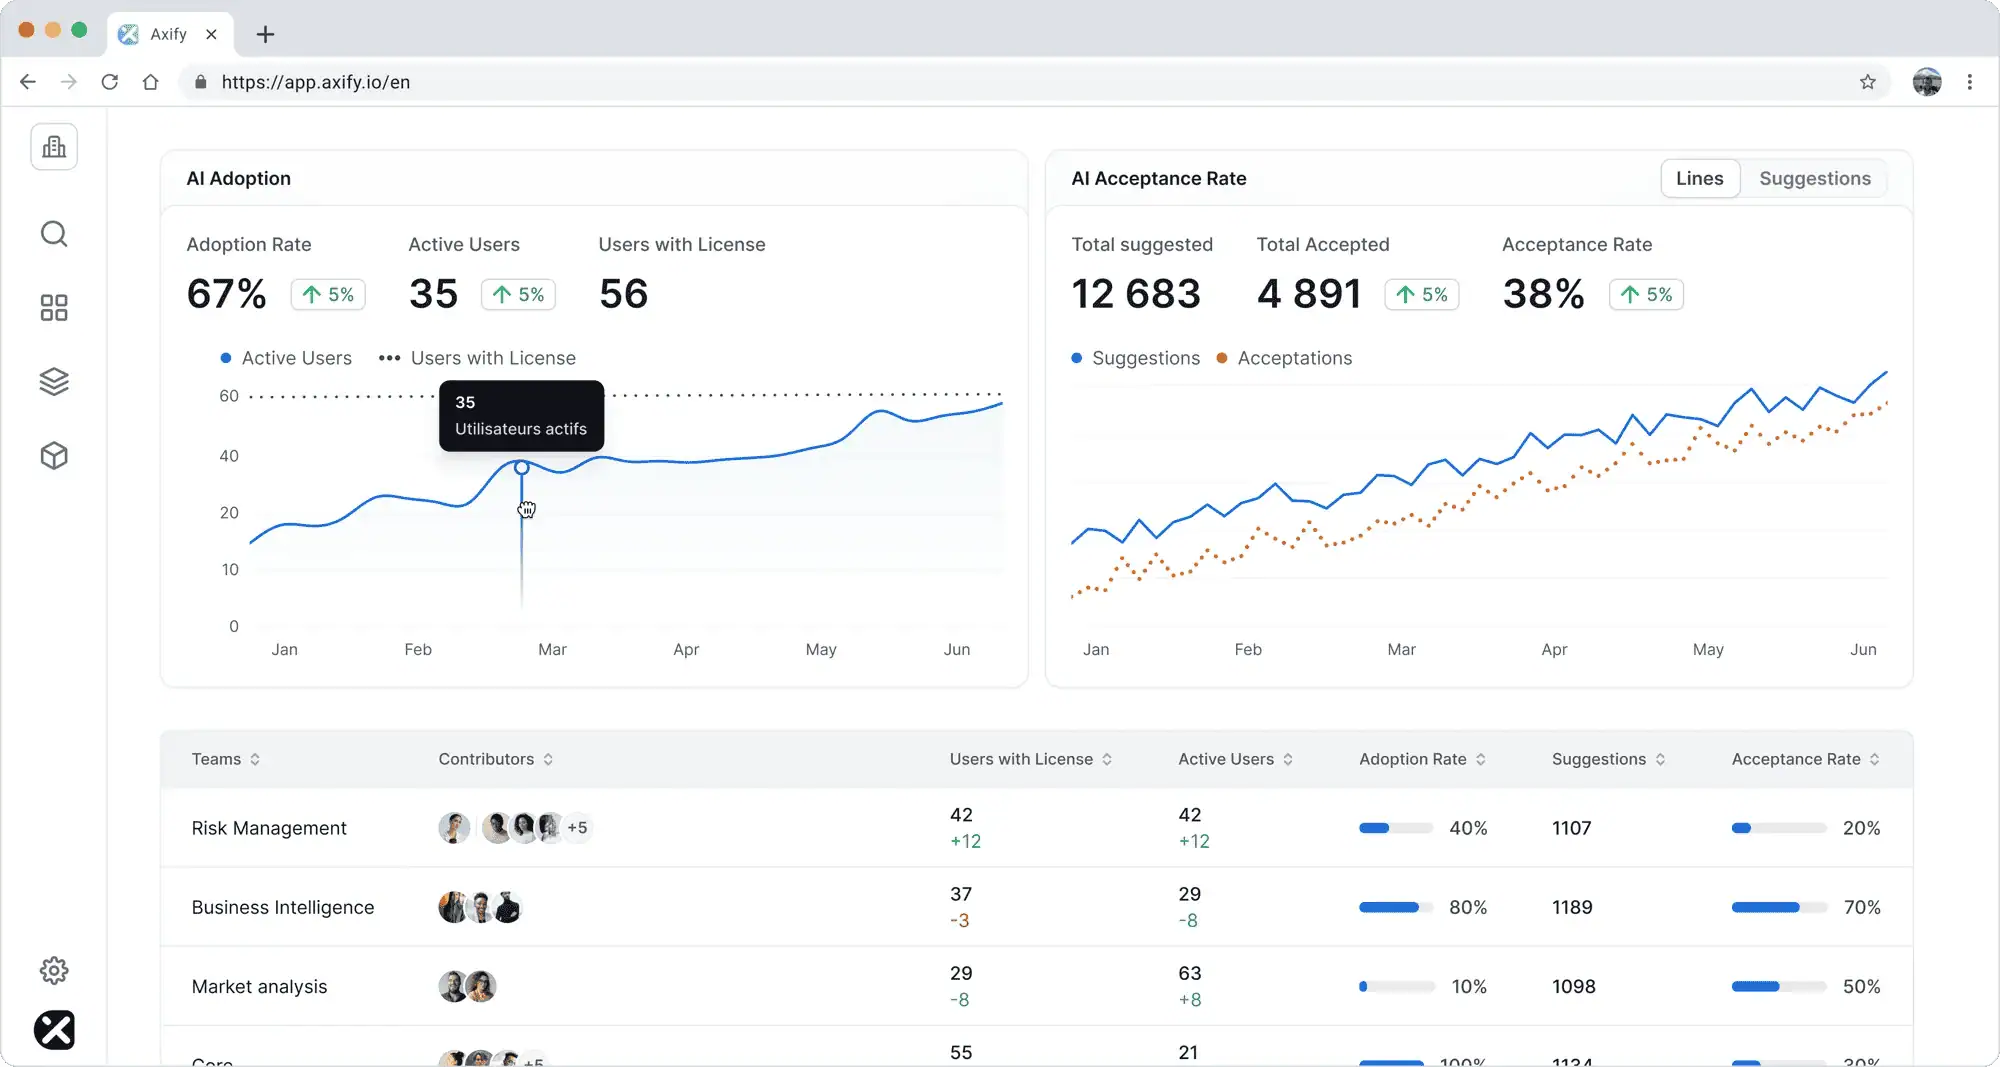
You can also see how AI adoption reflects in your delivery metrics, before and after adoption. This lets you analyze trends, identify potential bottlenecks, and demonstrate AI ROI to management.

Axify Intelligence
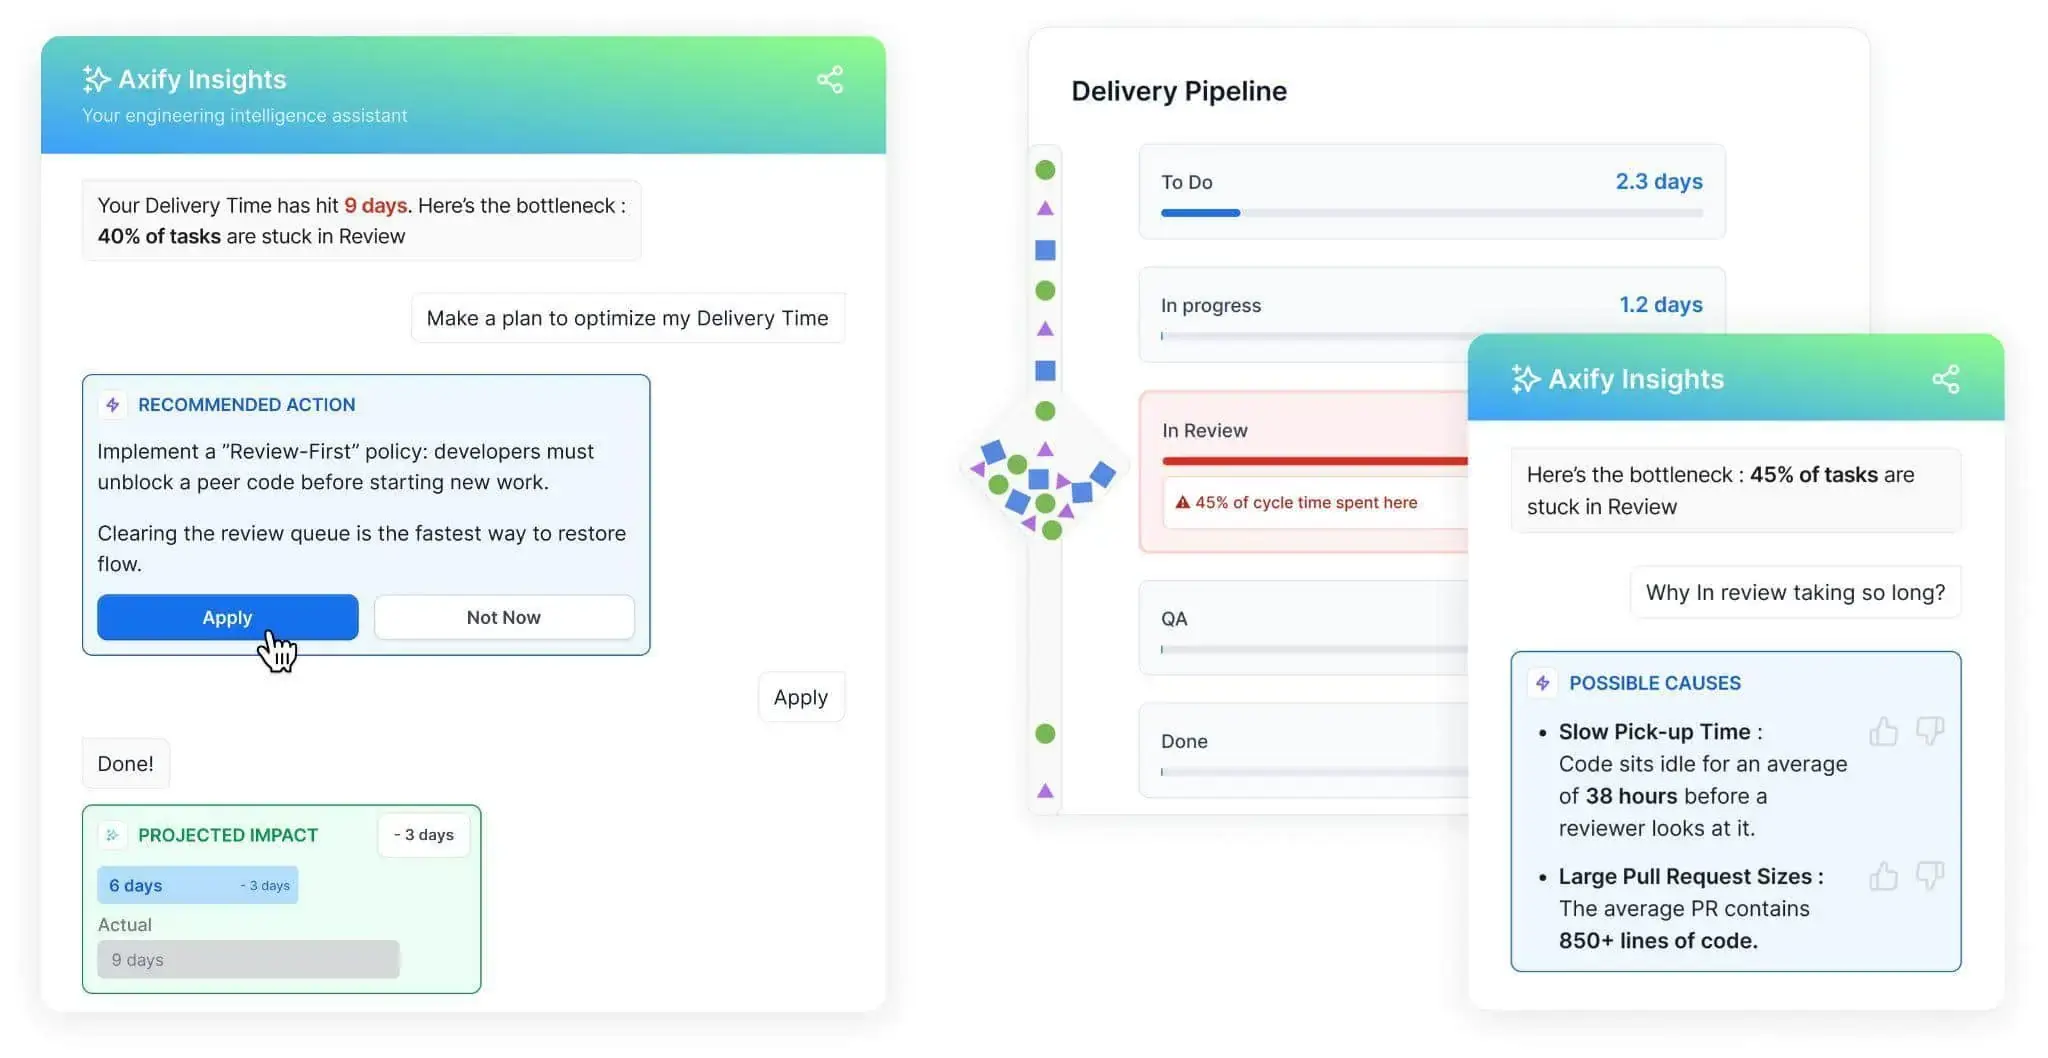
Even with all this data, the hardest part is deciding what action to take. This is where Axify Intelligence comes in. It continuously analyzes your delivery flow, detects where work gets stuck, explains why it happens, and suggests specific actions that you can take to fix all of your issues.
For example, if a large portion of tasks sits in review, it can recommend changing review policies or reducing parallel work. Instead of reviewing dashboards and debating next steps, you move straight from insight to action with context behind every recommendation
Ready to Turn Dashboard Data Into Better Engineering Decisions?
A DevOps dashboard should do more than summarize what has already happened. It should help leaders understand whether delivery is getting faster, where reliability risk is increasing, and which constraints deserve attention first.
As a bonus, Axify helps engineering leaders build a decision layer on top of delivery data, so dashboards become part of how you prioritize improvements, align on tradeoffs, and measure progress.
If that’s the missing piece in your workflow, it’s worth seeing how it works in practice. Schedule a free strategy call, and we’ll help you get the most out of your DevOps dashboard.
FAQs
How do you choose the right DevOps dashboard for your team?
Choose the right DevOps dashboard by mapping it to your actual workflow, from planning to deployment, and checking if it reflects each step clearly. Look for a tool that breaks lead time into coding, review, and deployment so you can see where work slows down.
What makes a DevOps dashboard effective?
A DevOps dashboard is effective when it is aligned with well-defined goals and shows whether your delivery system is moving toward them. Clear stage-level visibility, consistent data, and context behind changes make the difference. Without that, metrics stay surface-level and hard to use.
What tools integrate with a DevOps dashboard?
DevOps dashboards integrate with tools your team already uses, such as Jira, GitHub, GitLab, Azure DevOps, and CI/CD systems. These integrations pull real activity data like commits, pull requests, deployments, and incidents. That keeps your dashboard aligned with actual work instead of manual updates.
How often should you review your DevOps dashboard?
Review your DevOps dashboard daily for team-level execution and weekly for broader delivery patterns. Daily checks help spot blocked work and stalled progress, while weekly reviews help track trends across the system. That rhythm keeps both short-term execution and long-term flow under control.
Can a DevOps dashboard improve team performance?
A DevOps dashboard can improve team performance when it points directly to delays, bottlenecks, and coordination gaps. Clear visibility into how work moves helps teams adjust priorities and reduce waiting time. Over time, that leads to faster and more predictable delivery.
What makes the Axify DevOps dashboard different?
Axify stands out by connecting metrics to clear actions instead of leaving interpretation to the team. It analyzes delivery data, explains why changes happen, and suggests what to do next.
What metrics does the Axify DevOps dashboard show?
Axify shows delivery metrics like DORA, along with value stream data and AI adoption and impact. You can see these metrics at team, project, and organizational levels. This gives a full view of how work moves from idea to production.
How does Axify track DevOps metrics?
Axify tracks DevOps metrics by integrating directly with your tools and collecting data automatically across the delivery pipeline. It connects activities from planning, coding, review, and deployment into one system. That creates a continuous view of performance without manual input.


.png?width=60&name=About%20Us%20-%20Axify%20(2).png)


