DORA Metrics
11 minutes reading time


Today, technology companies struggle to evaluate the performance of their software development teams. So, among all the studies conducted to make engineering teams more Agile and efficient, the DORA group's study defined the key metrics crucial for the software process's effectiveness.
But the question is how to measure these metrics.
In this article, we'll show you how to create a DORA metrics dashboard for your organization. One that you can use to measure the quality of your development and deployment processes.
You'll also learn the role of DORA dashboards in tech companies and the need to identify and manage the key progress metrics appropriately.
So, let's get to it!
DORA metrics are four engineering performance indicators used to measure how effectively your team ships and operates software. They are deployment frequency, lead time for changes, change failure rate, and time to restore service.
These metrics were originally defined by Google’s DORA team to distinguish elite performers from average ones. They show how well your delivery process supports reliability, speed, and operational stability.
DORA metrics matter because high-performing teams that consistently score well on them tend to deliver software faster, recover from issues sooner, and maintain higher system reliability. This directly affects business outcomes by helping teams:
The most effective way to track DORA metrics is to use a dashboard that visualizes team performance across all four metrics. The dashboard has to be integrated within your development / DevOps environment.
Then you'll use it to track daily activities, including failures, fixes, deployments, etc. Your dashboard will collect and present information from your process tools, such as Jira, Slack, GitHub, Azure DevOps, Microsoft Teams, etc.
DORA metrics focus on the parts of your delivery process that directly influence engineering performance and system stability.. You use them to understand where work slows down, where risk increases, and where teams need support.
These are the four metrics included in every DORA assessment:
To make your DORA metrics reliable, you need a dashboard that updates automatically, pulls data consistently, and reflects what’s happening across your software development lifecycle.
Manual dashboards require constant data pulls and spreadsheet maintenance, while tools like Axify automate these updates through live integrations. So, here's how to build a DORA metrics dashboard:
Start with a dashboard that requires no coding and can be configured with a few connections. Instead of vague “intuitive analyses,” you should expect clear visual breakdowns. For example, spotting a sudden spike in lead time that aligns with a recent change in PR review rules.
Link your Git provider (GitHub or GitLab) and your project management system (Jira Cloud or Azure DevOps). This gives the dashboard the context it needs to map commits, pull requests, deployments, and incidents to the same timelines without interrupting workflow.
A DORA metrics dashboard should measure the flow from commit to production and recovery. To understand why your DORA metrics look the way they do, the dashboard also needs visibility across the full SDLC — including coding, pickup time, reviews, merging, deployments, and incident resolution. This end-to-end view makes it possible to pinpoint where delays originate and where work gets stuck.

If your team wants to explore manual setup, there are open-source resources that show what it takes to configure DORA metrics without a SaaS platform. For example, there's this Middleware OSS guide that walks through running PostgreSQL, Redis, analytics servers, and manual data pipelines to calculate DORA metrics without automation.
Engineering teams rely on DORA metrics dashboards to monitor delivery speed, stability, and operational reliability. But each platform approaches integrations, data sources, and visualization differently.
Here are the leading dashboards and how they differ.
|
0 Feature |
Axify |
Azure DevOps |
Plandek |
GitLab |
GitHub |
Google Cloud |
Harness |
Datadog |
|
Setup Time |
<10 min |
High (custom) |
Moderate |
Low |
Manual |
High (GCP setup) |
Moderate |
Moderate |
|
Integration Approach |
Unified |
Azure-only |
Broad |
Native |
Actions/3rd-party |
Open-source |
CD/SEI |
Obs-first |
|
All 4 DORA Metrics |
✅ |
⚠️ Workarounds |
✅ |
✅ |
⚠️ Actions |
✅ |
✅ |
✅ |
|
Real-Time Data |
✅ |
⚠️ |
✅ |
✅ |
⚠️ |
⚠️ |
✅ |
✅ |
|
Value Stream Mapping |
✅ |
❌ |
Limited |
⚠️ |
❌ |
❌ |
SEI |
❌ |
|
Team Well-being |
✅ |
❌ |
❌ |
❌ |
❌ |
❌ |
⚠️ |
❌ |
|
Forecasting |
✅ |
❌ |
✔️ |
❌ |
❌ |
❌ |
⚠️ |
❌ |
|
Incident Integration |
⚠️ |
⚠️ |
✔️ |
⚠️ |
⚠️ |
⚠️ |
✔️ |
✔️ |
Axify provides a unified dashboard that captures DORA metrics, flow metrics, VSM, throughput, time-investment insights, and team well-being signals in a single interface.
Setup takes less than 10 minutes, with automatic data ingestion and no custom configuration required. Axify integrates with GitHub, GitLab, Azure DevOps, Jira, Slack, and Teams. It also updates DORA metrics continuously through live sync rather than manual data pulls.
Best for: Teams needing an end-to-end DORA metrics tracking dashboard that consolidates delivery insights, workflow data, and team health in one place and at an affordable price.
Pricing: Starts at $19 per contributor per month.
Azure DevOps allows teams to build custom DORA dashboards through Analytics Views and Power BI. However, Analytics Views only support work-item data and exclude pipeline, test, and deployment data. This means DORA metrics must be assembled manually or through third-party tools.
Best for: Microsoft-centric teams willing to build their own dashboards.
Limitations: Heavy manual setup, strict data-type restrictions, and limited historical time windows.
Pricing: Free tier for up to five people.
Plandek aggregates DORA metrics with 50+ additional engineering indicators. Also, it supports Jira, Azure DevOps, GitHub, GitLab, CI/CD tools, and custom APIs. The platform emphasizes deep customization for leadership reporting.
Best for: Organizations needing highly customizable dashboards tied to business outcomes.
Limitations: Setup complexity and limited connectors for uncommon tools.
Pricing: Starts at $25 per contributor per month.
GitLab embeds DORA metrics directly into its value streams dashboard. Metrics auto-generate from native GitLab pipelines without third-party tools. Advanced features appear only in the ultimate tier.
Best for: Teams fully operating inside GitLab.
Limitations: Less flexible for mixed toolchains and limited granularity for complex multi-repo setups.
Pricing: Has a free tier available for five users.
GitHub has no native DORA dashboard but supports DORA tracking through GitHub Actions, custom workflows, and third-party integrations (Oobeya, LinearB, Swarmia, Sleuth, CTO.ai). Most GitHub-based DORA scripts analyze only the last 100 PRs or workflows.
Best for: Teams comfortable building a DIY DORA metrics dashboard (open source) or using marketplace actions.
Limitations: Manual maintenance, limited sampling, and incomplete incident context.
Pricing: Offers a free plan.
Google Cloud’s Four Keys is the official open-source DORA implementation from the DORA research team. It collects data via Cloud Functions, BigQuery, and Looker Studio dashboards.
Best for: Teams wanting an open-source DORA implementation aligned with Google’s research.
Limitations: Requires technical setup, ongoing maintenance, and GCP billing.
Pricing: Free tier available.
Harness provides two layers: the CD DORA dashboard (pipeline-centered) and Software Engineering Insights (SEI) for full SDLC tracking with correlation engines, sprint predictability, and AI insights.
Best for: Companies using Harness pipelines or wanting broad SDLC analysis.
Limitations: The CD dashboard is narrow, and SEI requires more configuration.
Pricing: Offers a free tier for small teams and individual developers.
Datadog captures DORA metrics through deployment tracking, APM, incident response, and CI/CD integrations. It correlates delivery performance with runtime system health.
Best for: Organizations prioritizing the link between deployments, observability, and reliability.
Limitations: High cost at scale, and it requires broad Datadog adoption for full value.
Pricing: Offers a free tier up to five hosts.
The DORA metrics dashboard will provide team leaders with truthful insights, as they can analyze the metrics to assess team performance. The dashboard allows you to:
When looking at CFR and TTRS, teams can ensure their code is stable while reducing failures. On the other hand, monitoring DF and LTFC ensures that the team is working well. But when combined, DORA metrics provide crucial information on team speed and software quality.
Axify can help you visualize the different DORA metrics effectively. It can integrate and synchronize data from various platforms for accurate, real-time reporting.
A well-structured DORA dashboard lets you see how your engineering workflow behaves in real time, not just how it looks on paper. These views turn abstract performance metrics into concrete signals you can respond to.
Below are the four core dashboards you’ll typically work with and how to interpret them.
If you want to see how quickly ideas move from development to production, this view gives you that signal. Lead time for changes tracks the duration from the first commit to successful production deployment. It reflects how smooth your coding, review, and deployment processes are end-to-end.
Elite performance: Elite teams keep lead times extremely short. In the 2025 State of AI-assisted Software Development report, 24.4% ship changes in under one day, and 9.4% reach the under-one-hour category. These teams avoid long multi-week or multi-month lead times entirely.

Your view of release stability depends heavily on this metric. Change failure rate shows the portion of deployments that introduce bugs, outages, or require rollbacks after reaching production. It reflects testing quality, review depth, and deployment reliability.
Elite performance: Elite teams cluster tightly in the lowest failure bands. The 2025 State of AI-assisted Software Development report notes that 8.5% operate in the 0-2% range, while 16.7% fall in the 2-4% range. Higher failure brackets rise sharply for lower performers, but elite teams remain heavily concentrated at the bottom end.

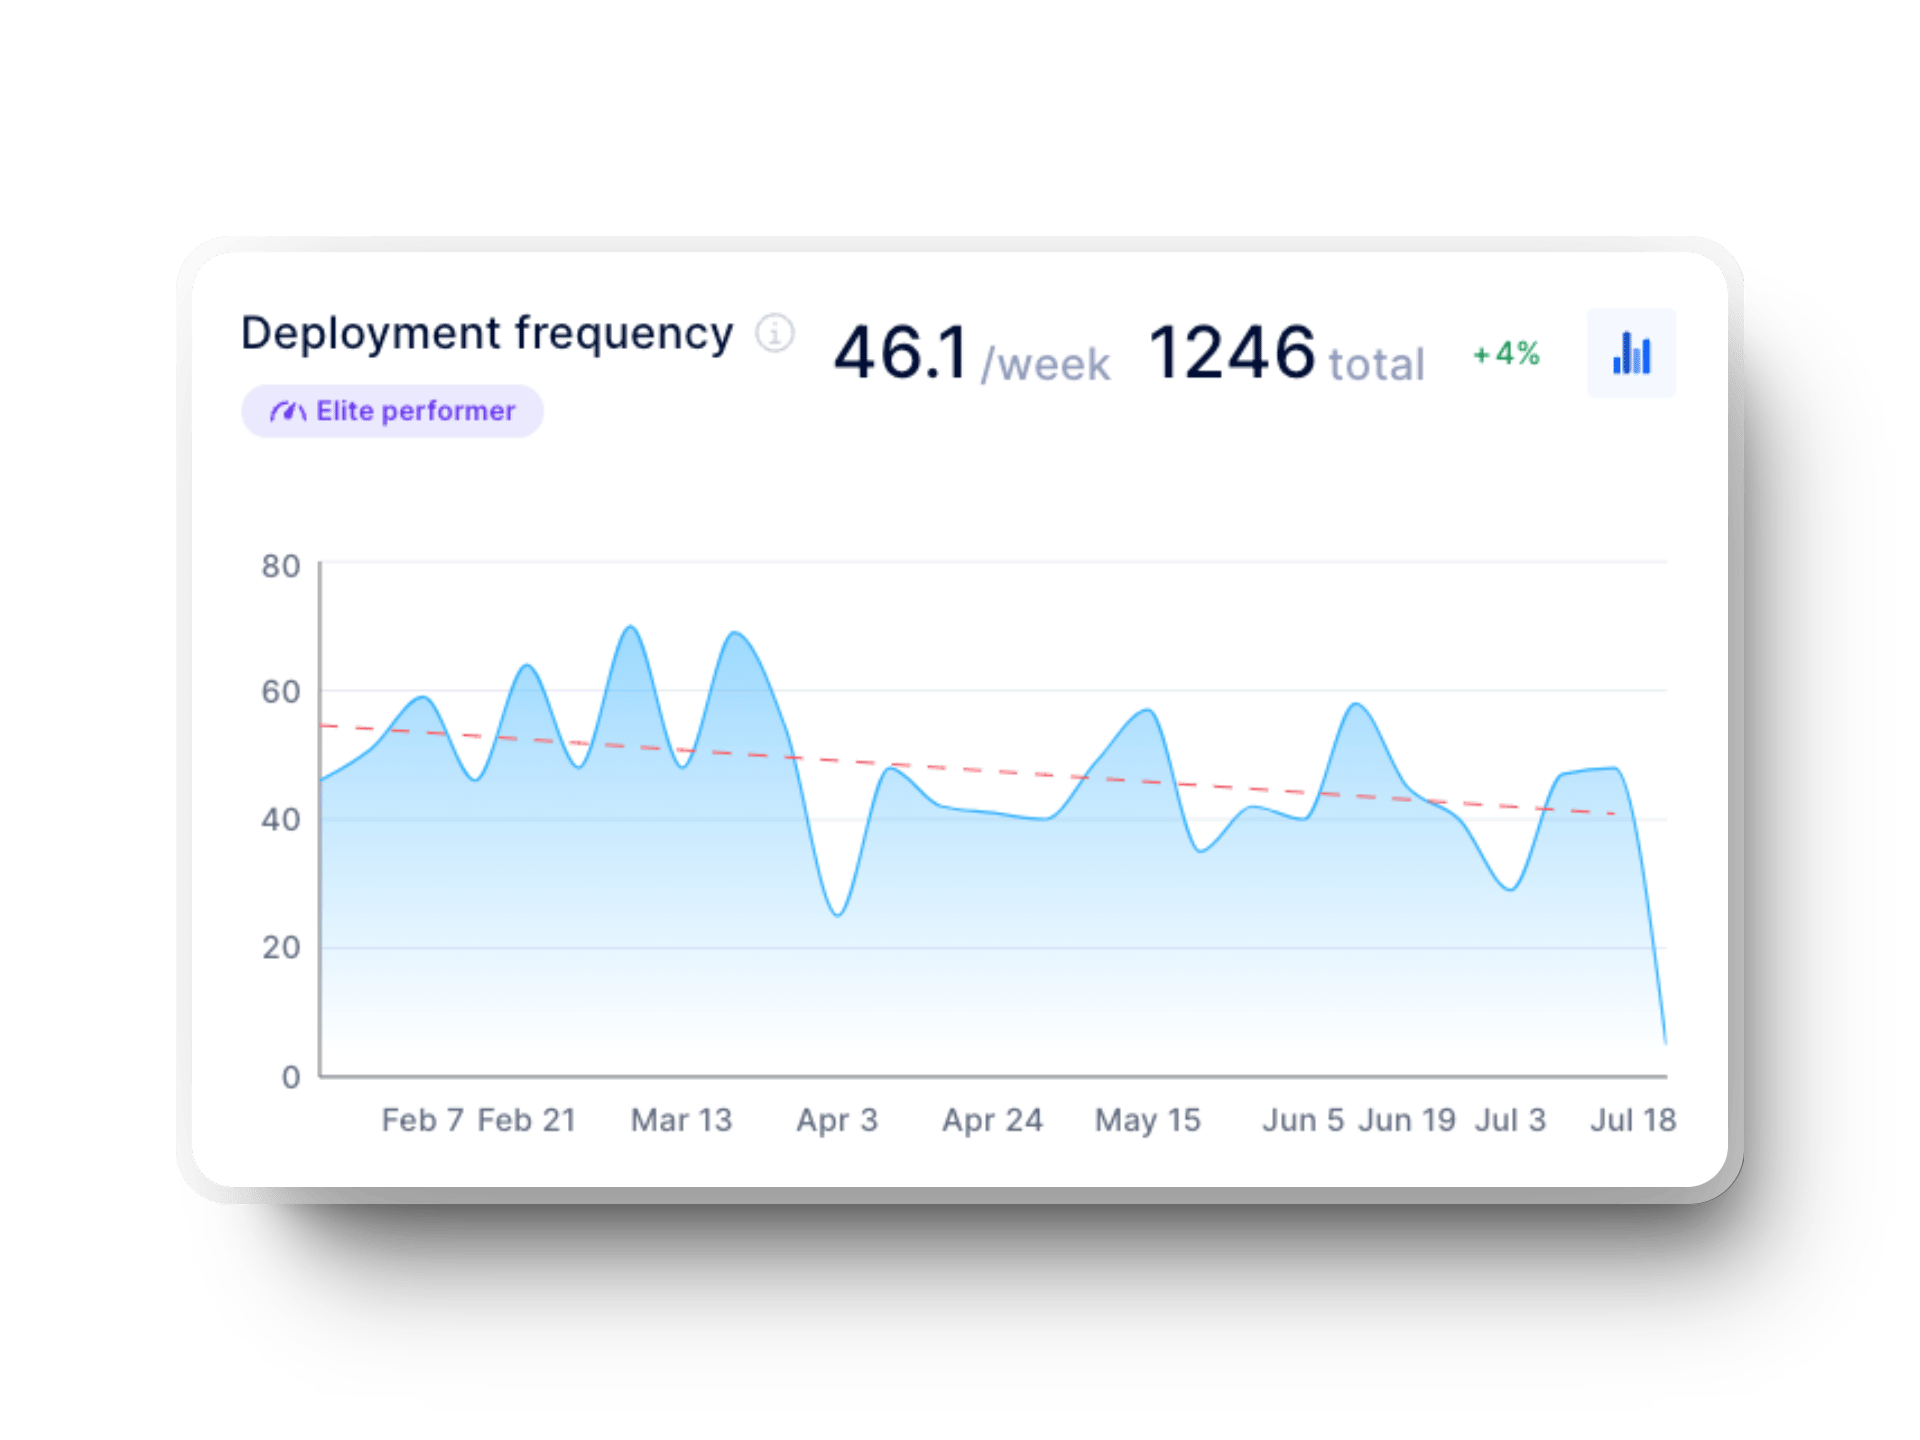
Understanding how consistently your team delivers value starts with deployment frequency. It measures how frequently new code successfully reaches production, revealing how healthy and repeatable your CI/CD pipeline is.
Elite performance: High performers release far more often. Data from the 2025 State of AI-assisted Software Development report shows 16.2% deploy on demand (multiple times per day) and 22.7% deploy between once per hour and once per day. Elite groups do not fall into slower monthly or quarterly deployment patterns.
If you're trying to evaluate how quickly your team restores service after a failure, this is the metric to watch. Failed deployment recovery time captures the duration from an incident occurring to full service restoration. This gives you a clear picture of operational resilience.
Elite performance: Strong incident-response maturity shows up in rapid recovery. Based on findings in the 2025 report, 21.3% of elite teams restore service in under one hour, and 56.5% recover in less than a day. Longer multi-week or multi-month recovery windows are almost nonexistent among elite performers.

Building a reliable DORA dashboard sounds simple, but most teams run into the same issues once they try to aggregate data, standardize definitions, and present everything clearly. Each challenge slows down measurement and affects trust.
Here are the areas where teams usually struggle and how to approach them.
Pulling DevOps data manually is slow and error-prone. When you lack automation, you will most likely:
This leads to inconsistent timelines and partial views.
For example, a team may track deployments from GitHub but rely on Jira timestamps for incident detection. When those systems drift, the dashboard shows conflicting results. Automated ingestion avoids this mismatch by pulling aligned timestamps directly from source systems.
Even when data is accurate, dashboards can quickly become cluttered. Teams often end up with complex spreadsheets, overloaded charts, or views that require interpretation instead of providing clarity.
Axify addresses this by simplifying the operational view.
Each metric appears in clean, separate views. For example, a team can immediately see a spike in lead time for changes after new PR review rules were introduced, without digging through multiple charts.
This also ensures that every role gets the right level of insight: engineers stay focused on delivery flow, while managers get a clear, high-level view of DORA performance.
Data integrity becomes a challenge once teams scale and pipelines multiply. DevOps data lives in different tools (GitHub, GitLab, Jira, Azure DevOps, cloud logs) and in different formats. When teams update processes or change workflow rules, dashboards can break or lose historical consistency.
For example, if a team switches from a single-repo setup to multiple services, a manual dashboard might treat each repository as a separate metric source, which can break CFR calculations. An automated system prevents this because it aligns metadata, timestamps, and failure signals across all repos.
Axify removes this problem entirely by syncing data continuously and standardizing it before calculating DORA metrics, so definitions stay consistent even as workflows change.
Manual calculations can help you get started, but they’re difficult to maintain and often incomplete. Axify automatically models how your delivery system behaves and keeps DORA metrics up to date — with no manual effort required.
Axify is a single platform to observe all the key performance indicators that will help you improve your development and delivery processes. It provides superior dashboards and constant tracking of DORA metrics in real time. This can simplify the whole process and enable teams to focus on improvement.
Here's how you can do that:
Once configured, your DORA dashboard updates automatically without any manual data refresh or CSV imports needed.
A DORA dashboard gives you four strong indicators of delivery performance. Axify tracks them well, but it also gives you several other views that help you better understand your team’s flow, workload, risks, and delivery capacity. These extra views make your analysis deeper and far more accurate.
Here are the most popular Axify metrics and dashboards that go beyond DORA, along with what they help you see.
Value stream mapping shows how work moves from idea to completion. It breaks the workflow into clear stages and exposes where time is spent, where work slows down, and which phases create bottlenecks. Axify calculates cycle time for each stage so you can see exactly where delays appear.
What this view lets you see:
This gives you a clear snapshot of how work actually progresses day to day.

Axify includes several flow-based indicators that show how work moves through the system and how predictable your delivery is. Here's what you can also track:
Cycle time (including idle time): Axify includes waiting time, which gives a more realistic view of how long work actually sits before completion.
Flow predictability: This shows how consistent your delivery is by comparing cycle times over time. It helps teams plan work more reliably.
Work in progress (WIP): High WIP usually slows teams down. Axify visualizes this clearly so teams can limit WIP and stay focused.
Workflow stability: This compares how much work starts vs. how much finishes. Large gaps are a sign that the process is overloaded or poorly balanced.

Throughput: This metric counts flow velocity by following completed items rather than story points. It shows real output and avoids the inconsistencies of point-based estimation.
Teams use throughput to:
Axify also translates throughput changes into approximate full-time-equivalent (FTE) gains so leaders can interpret impact in plain terms.
![]()
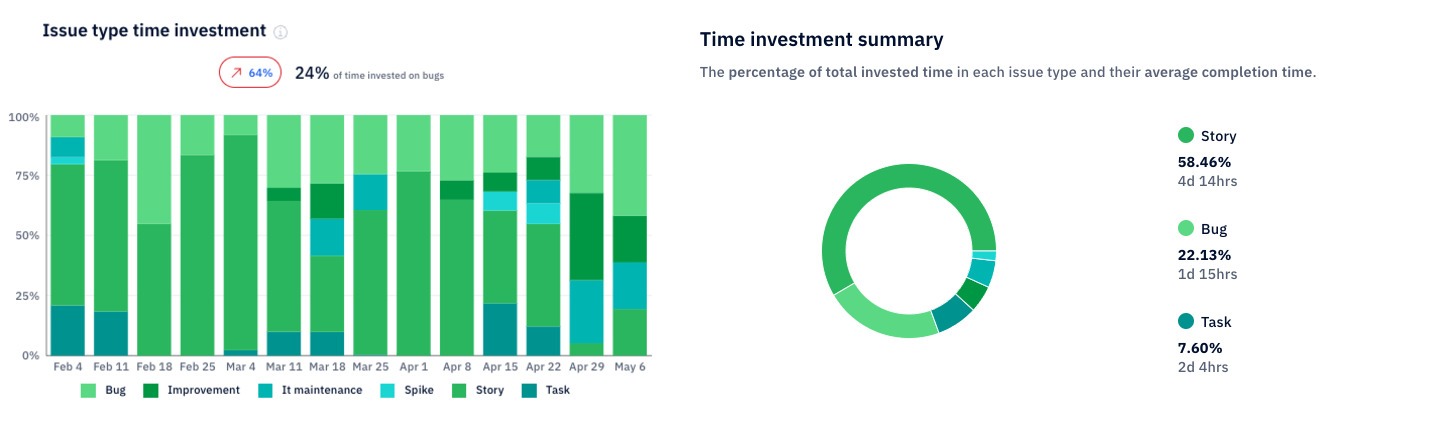
Axify shows how much time your team spends across different categories of work (bugs, tasks, improvements, spikes, and more). This reveals whether your effort matches your priorities.
You get two different lenses:
Both views make it easier to see where engineering time goes.
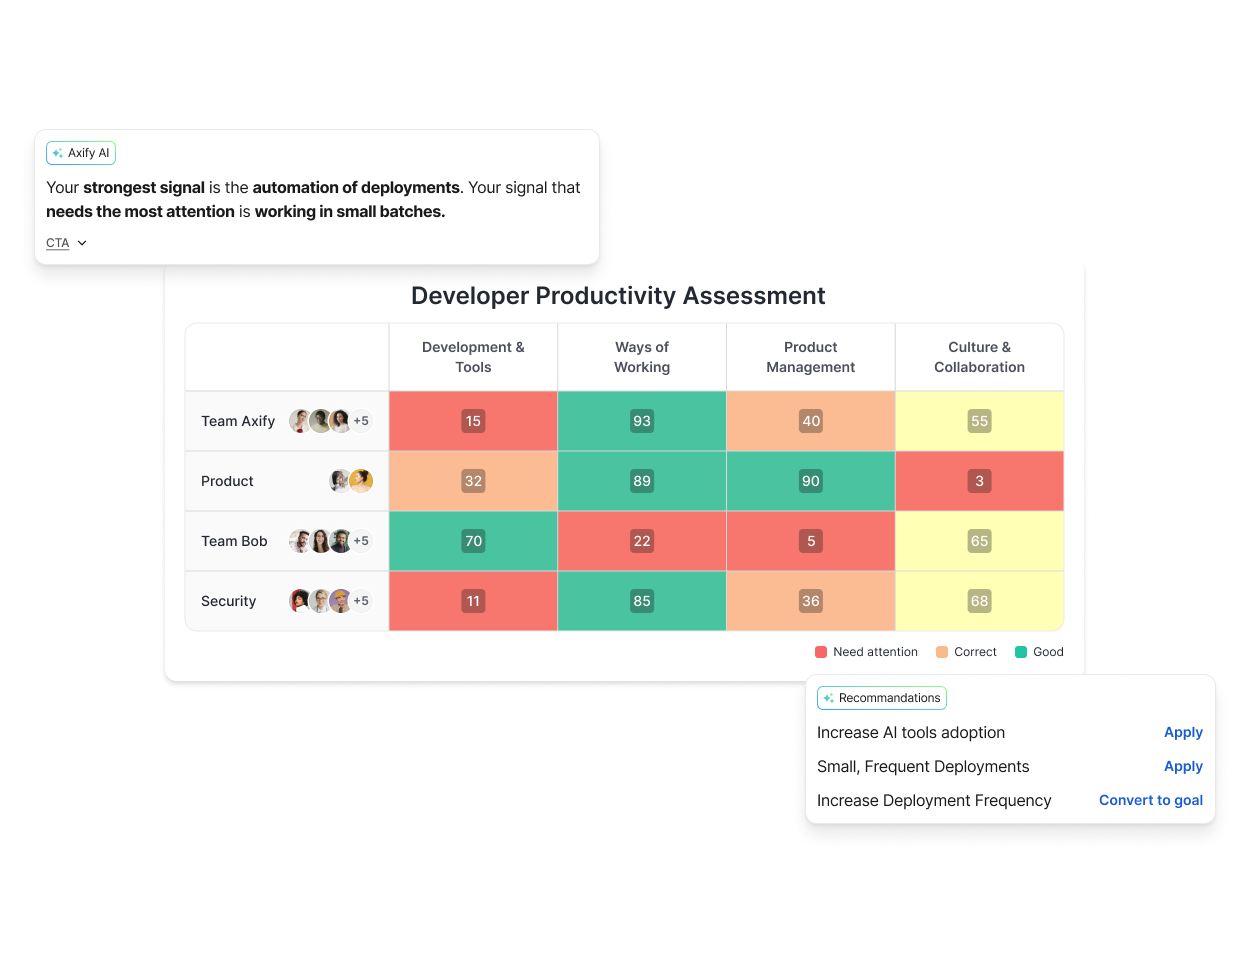
Axify includes a developer productivity assessment that evaluates teams across four pillars: Development & Tools, Ways of Working, Product, and Culture & Collaboration. It blends your delivery data with questionnaire responses and presents everything in a simple color-coded grid.
This view helps leaders quickly identify where improvements will have the greatest impact and highlight teams that can serve as internal benchmarks. It also makes it easy to track whether improvement initiatives are delivering results over time. Beyond the raw metrics, it provides a broader understanding of team health and the conditions that shape delivery performance.
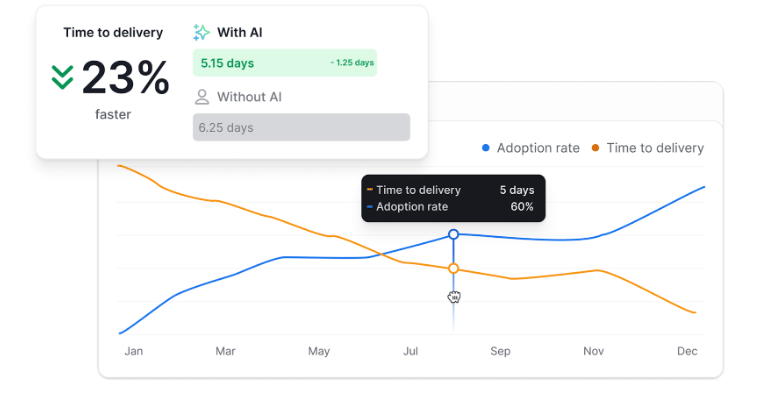
The AI Performance Impact feature shows you how your team works with AI versus without it. It tracks AI adoption, delivery time, DORA metrics, and other important signals so you can see the real impact AI has on day-to-day performance.
In the preview below, you can see that teams deliver 23% faster when they use AI. As the adoption rate climbs (blue line), delivery time drops (orange line). It’s a straightforward way to show that using AI the right way helps you ship work faster while maintaining quality.
A DORA dashboard provides continuous, real-time tracking of multiple software metrics. It simplifies the whole process and allows teams to concentrate on making improvements.
Axify, with its proven track record in functional dashboards, can improve the stability of your process. Our platform can help you foster a streamlined operation and a satisfied team, which will result in a win-win situation for all.
If you want to see how we can improve your software development process, feel free to contact us for a quick demo.

A DORA metrics dashboard highlights the speed and stability of your software delivery process. It visualizes the four core DORA metrics, making it easier to spot trends, understand performance, and track improvements over time. Most dashboards update automatically as your team works, giving you a real-time view of delivery health.
Most dashboards connect with GitHub, GitLab, Azure DevOps, Jira, and CI/CD tools like Jenkins or CircleCI. Axify brings these into one place through direct integrations that update your metrics automatically. Some setups also link to incident or observability tools to give more context.
They give you a clear view of delivery speed, reliability, and problem areas. Teams can track progress over time and see where delays start. This creates better planning and more predictable releases.
Yes. AI can quickly detect patterns, predict risks, and highlight unusual changes that may be hard to spot manually. It can also compare trends across teams to guide improvement efforts. When built on top of stable engineering practices and reliable data, AI accelerates analysis and helps teams surface issues earlier.
Connect your repositories and project tools to an automated dashboard like Axify so the data updates on its own. Then start with the four core metrics to build a clean baseline. Lastly, add value stream mapping, flow metrics, incident insights, or AI-driven comparisons once your setup becomes stable.