Delivery Performance
13 minutes reading time

Cycle time helps you see how much work lasts and where it slows. That matters because delay can build in other phases than coding, like review queues, test runs, handoffs, and deployment steps. Once you can trace lost time, you can judge where your workflow is bottlenecked and where continuous improvement should start.
In this article, you’ll learn how to calculate cycle time, spot the stages that add delay, and reduce that time with practical changes. Let's dive in.
Cycle time is the amount of time it takes for your software development team to complete a task from start to finish. This key performance indicator measures the elapsed time between starting a process and delivering the finished product to your clients.
Cycle time is a key metric that originates in lean manufacturing. It shows how efficient you are because efficiency can be defined as production time divided by total process time. We advise you to track it to make meaningful process improvements.
Shorter cycle times mean you can respond to customer demand more quickly, reduce processing time, and achieve faster delivery times.
But “shorter” only means something in context.
That context should be your own historical cycle time, not external benchmarks or averages. That internal comparison gives you a clearer signal of what’s actually improving and helps you make better, data-driven decisions about your workflow and customer experience.
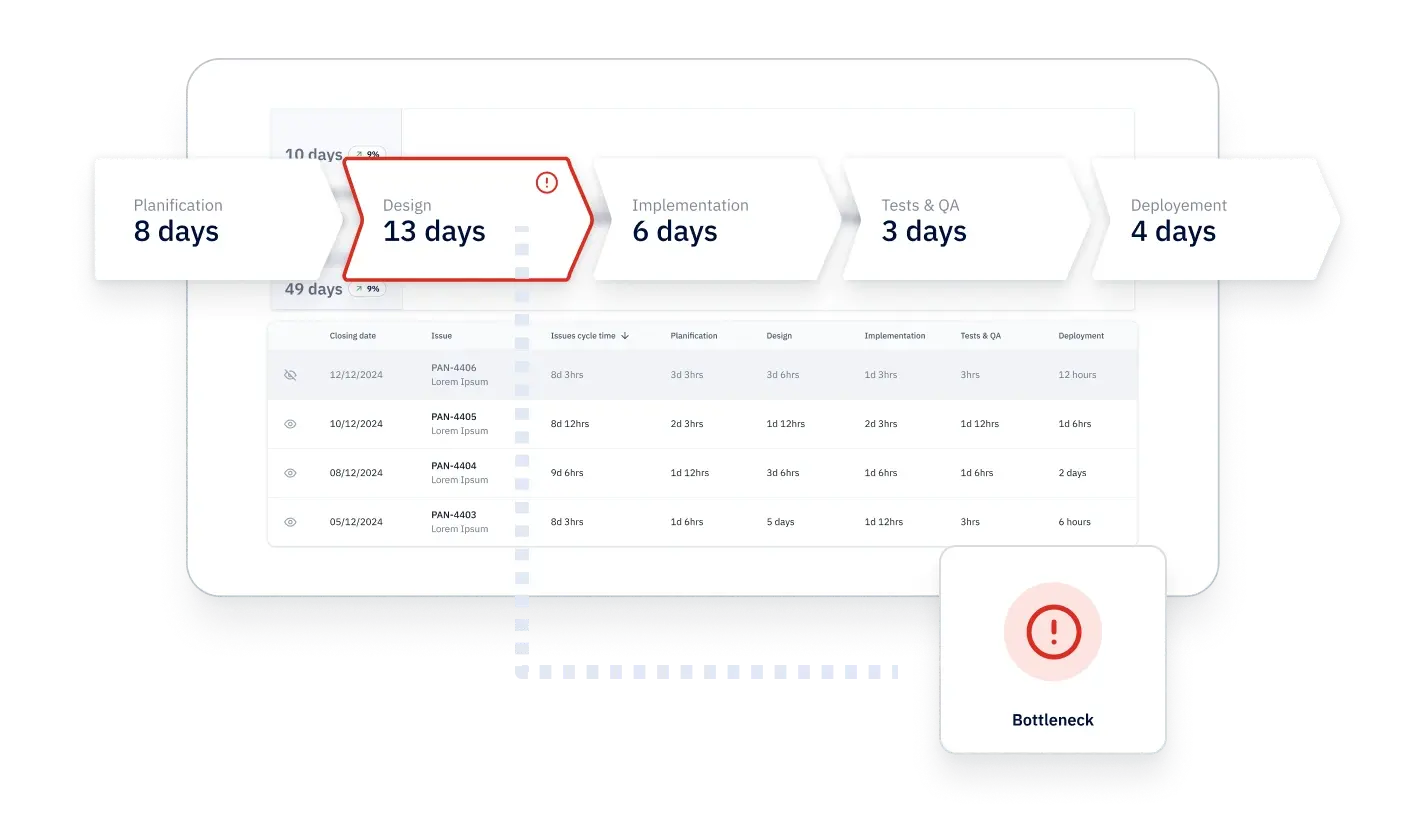
Pro tip: Axify’s value stream mapping feature makes cycle time easy to follow. You can see how long work spends in each stage and across the full delivery flow, with real-time visibility. This helps you spot delays early and take action to streamline your workflow.
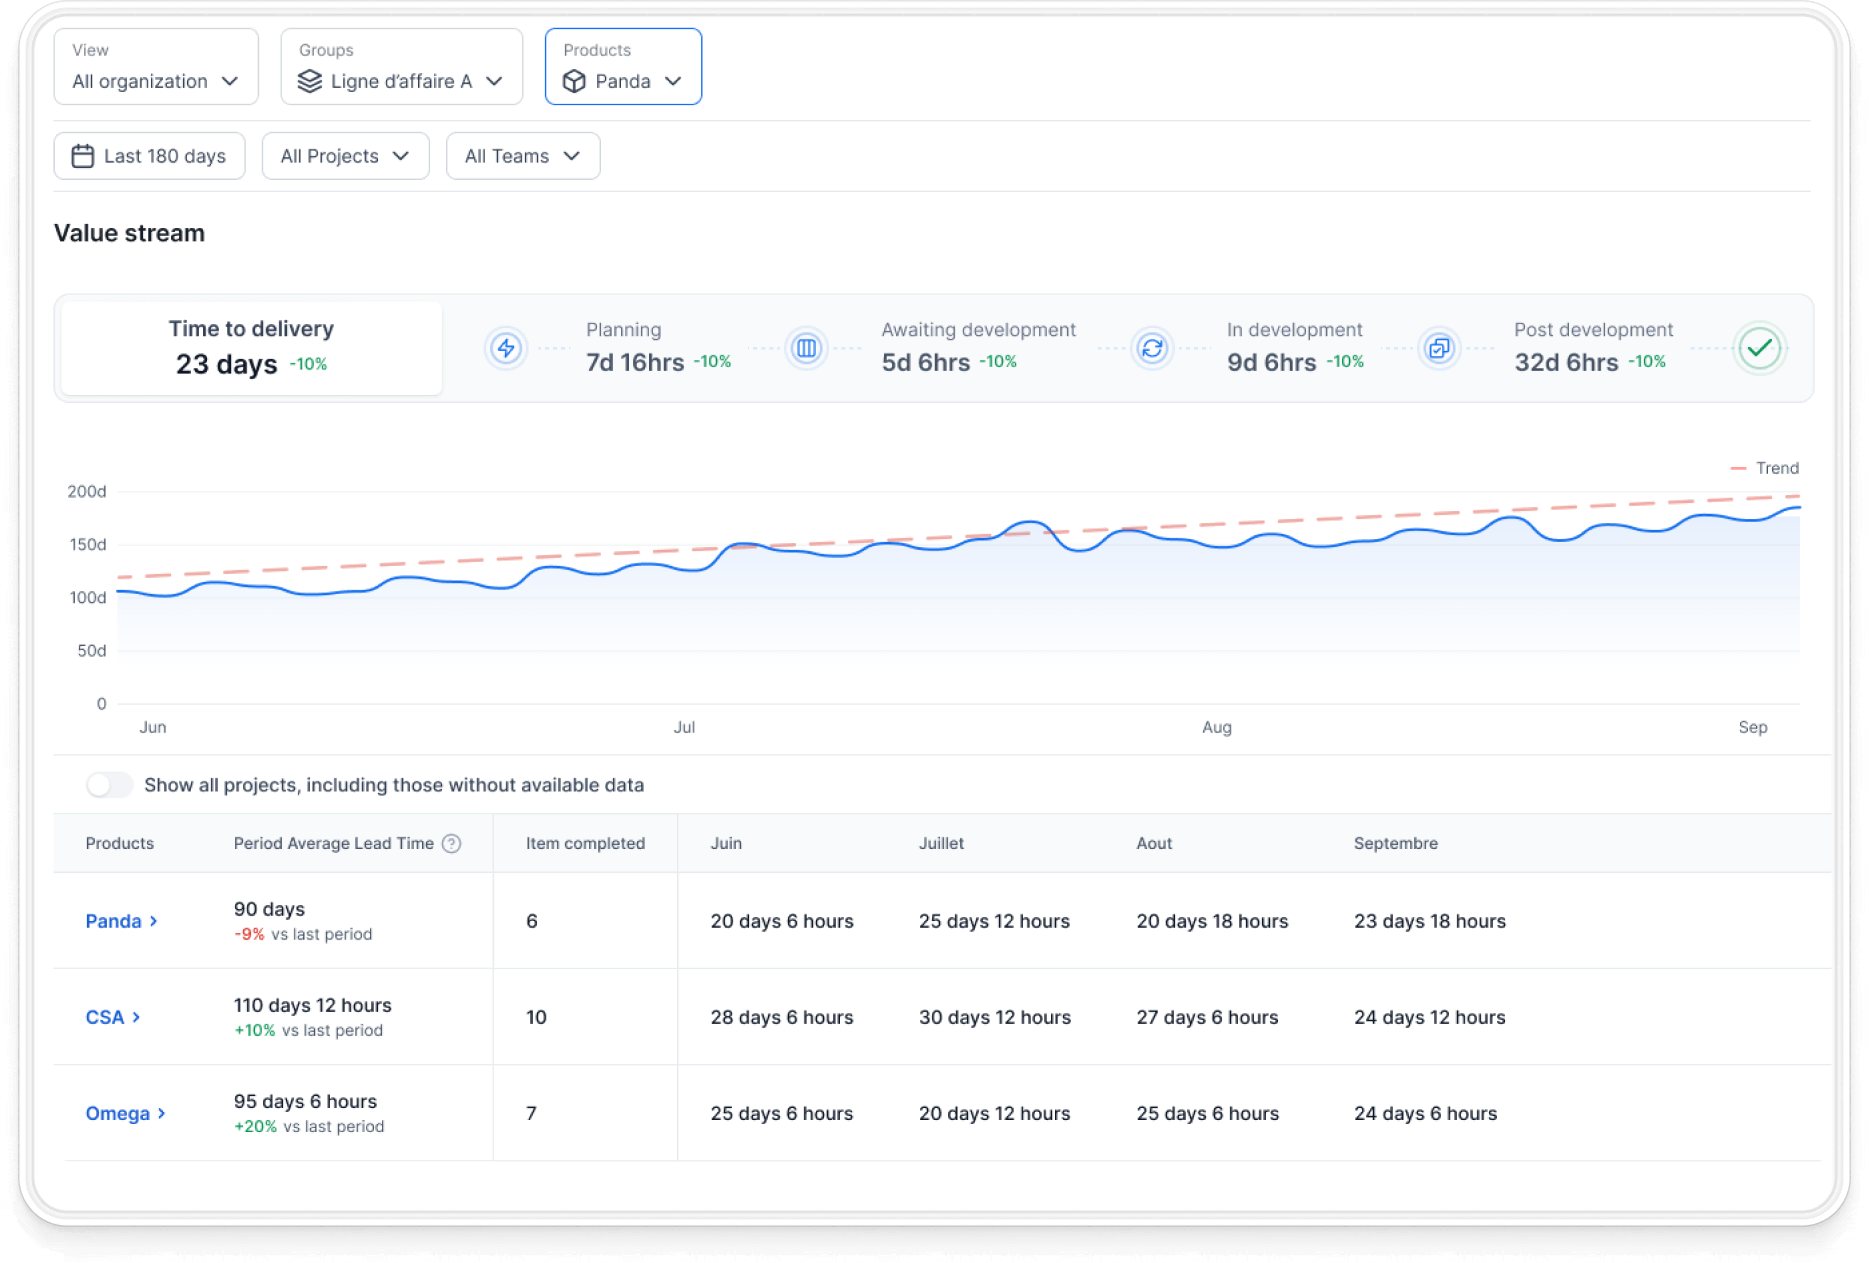
With VSM, you can assess which phases of the development cycle take up most of your team's time. You can also sort items in ascending or descending timeframes and customize the time period you're analyzing.
Cycle time is like a lens that helps you see where your time is being spent in the production process and identify where improvements are needed. Let’s see a more complete breakdown of the reasons to follow this metric.
Cycle time shows where delays occur. Of course, you should follow longer-term trends to see whether certain tasks/ phases are prolonged or whether you’re waiting inordinate amounts of time between active steps.
For example, long code reviews, slow QA feedback, or deployment handoffs can hold work in place. Each such waiting point pushes delivery further out.
Once you can trace that delay, you can decide whether to reduce PR size, rebalance review ownership, or remove steps from your release workflows.
You need shared visibility internally, as well as when you explain delivery to other teams. Cycle time shows you the objective elapsed time, which is easier to contextualize compared to story points or other internal estimates.
So, when product or business stakeholders ask why work is taking longer, you can point to review backlog, test delays, or handoff time instead of relying on abstract scoring.
“Stakeholders might also misinterpret velocity, focusing on the quantity of story points rather than the value delivered. Plus, focusing too much on velocity can cause teams to skip necessary quality checks and accumulate technical debt. Cycle time is superior because it reflects the real elapsed time from the customers’ perspective. As such, it captures meetings, interruptions, and context-switch – basically all the variability that may happen when we develop a product.”
Alexandre Walsh
Axify Co-Founder and Head of Product
Once you understand your baseline trends, you can plan with fewer assumptions. Once you improve cycle time (we’ll share some tips from our experience in a second), you gain more stability. And a more stable cycle time makes delivery easier to forecast in CI/CD pipelines.
By contrast, slower validation, blocked deployments, or repeated rework can increase cycle time per item (and, therefore, total cycle time) in unpredictable ways. Once you have less variation, you can set expectations with more confidence and adjust workflow policies before delays spread.
The cycle time formula is straightforward. You should track the actual time spent working on a task down to the hours and minutes. Don't just focus on counting days.
Measuring elapsed time correctly is more accurate and, therefore, enables faster turnaround times.
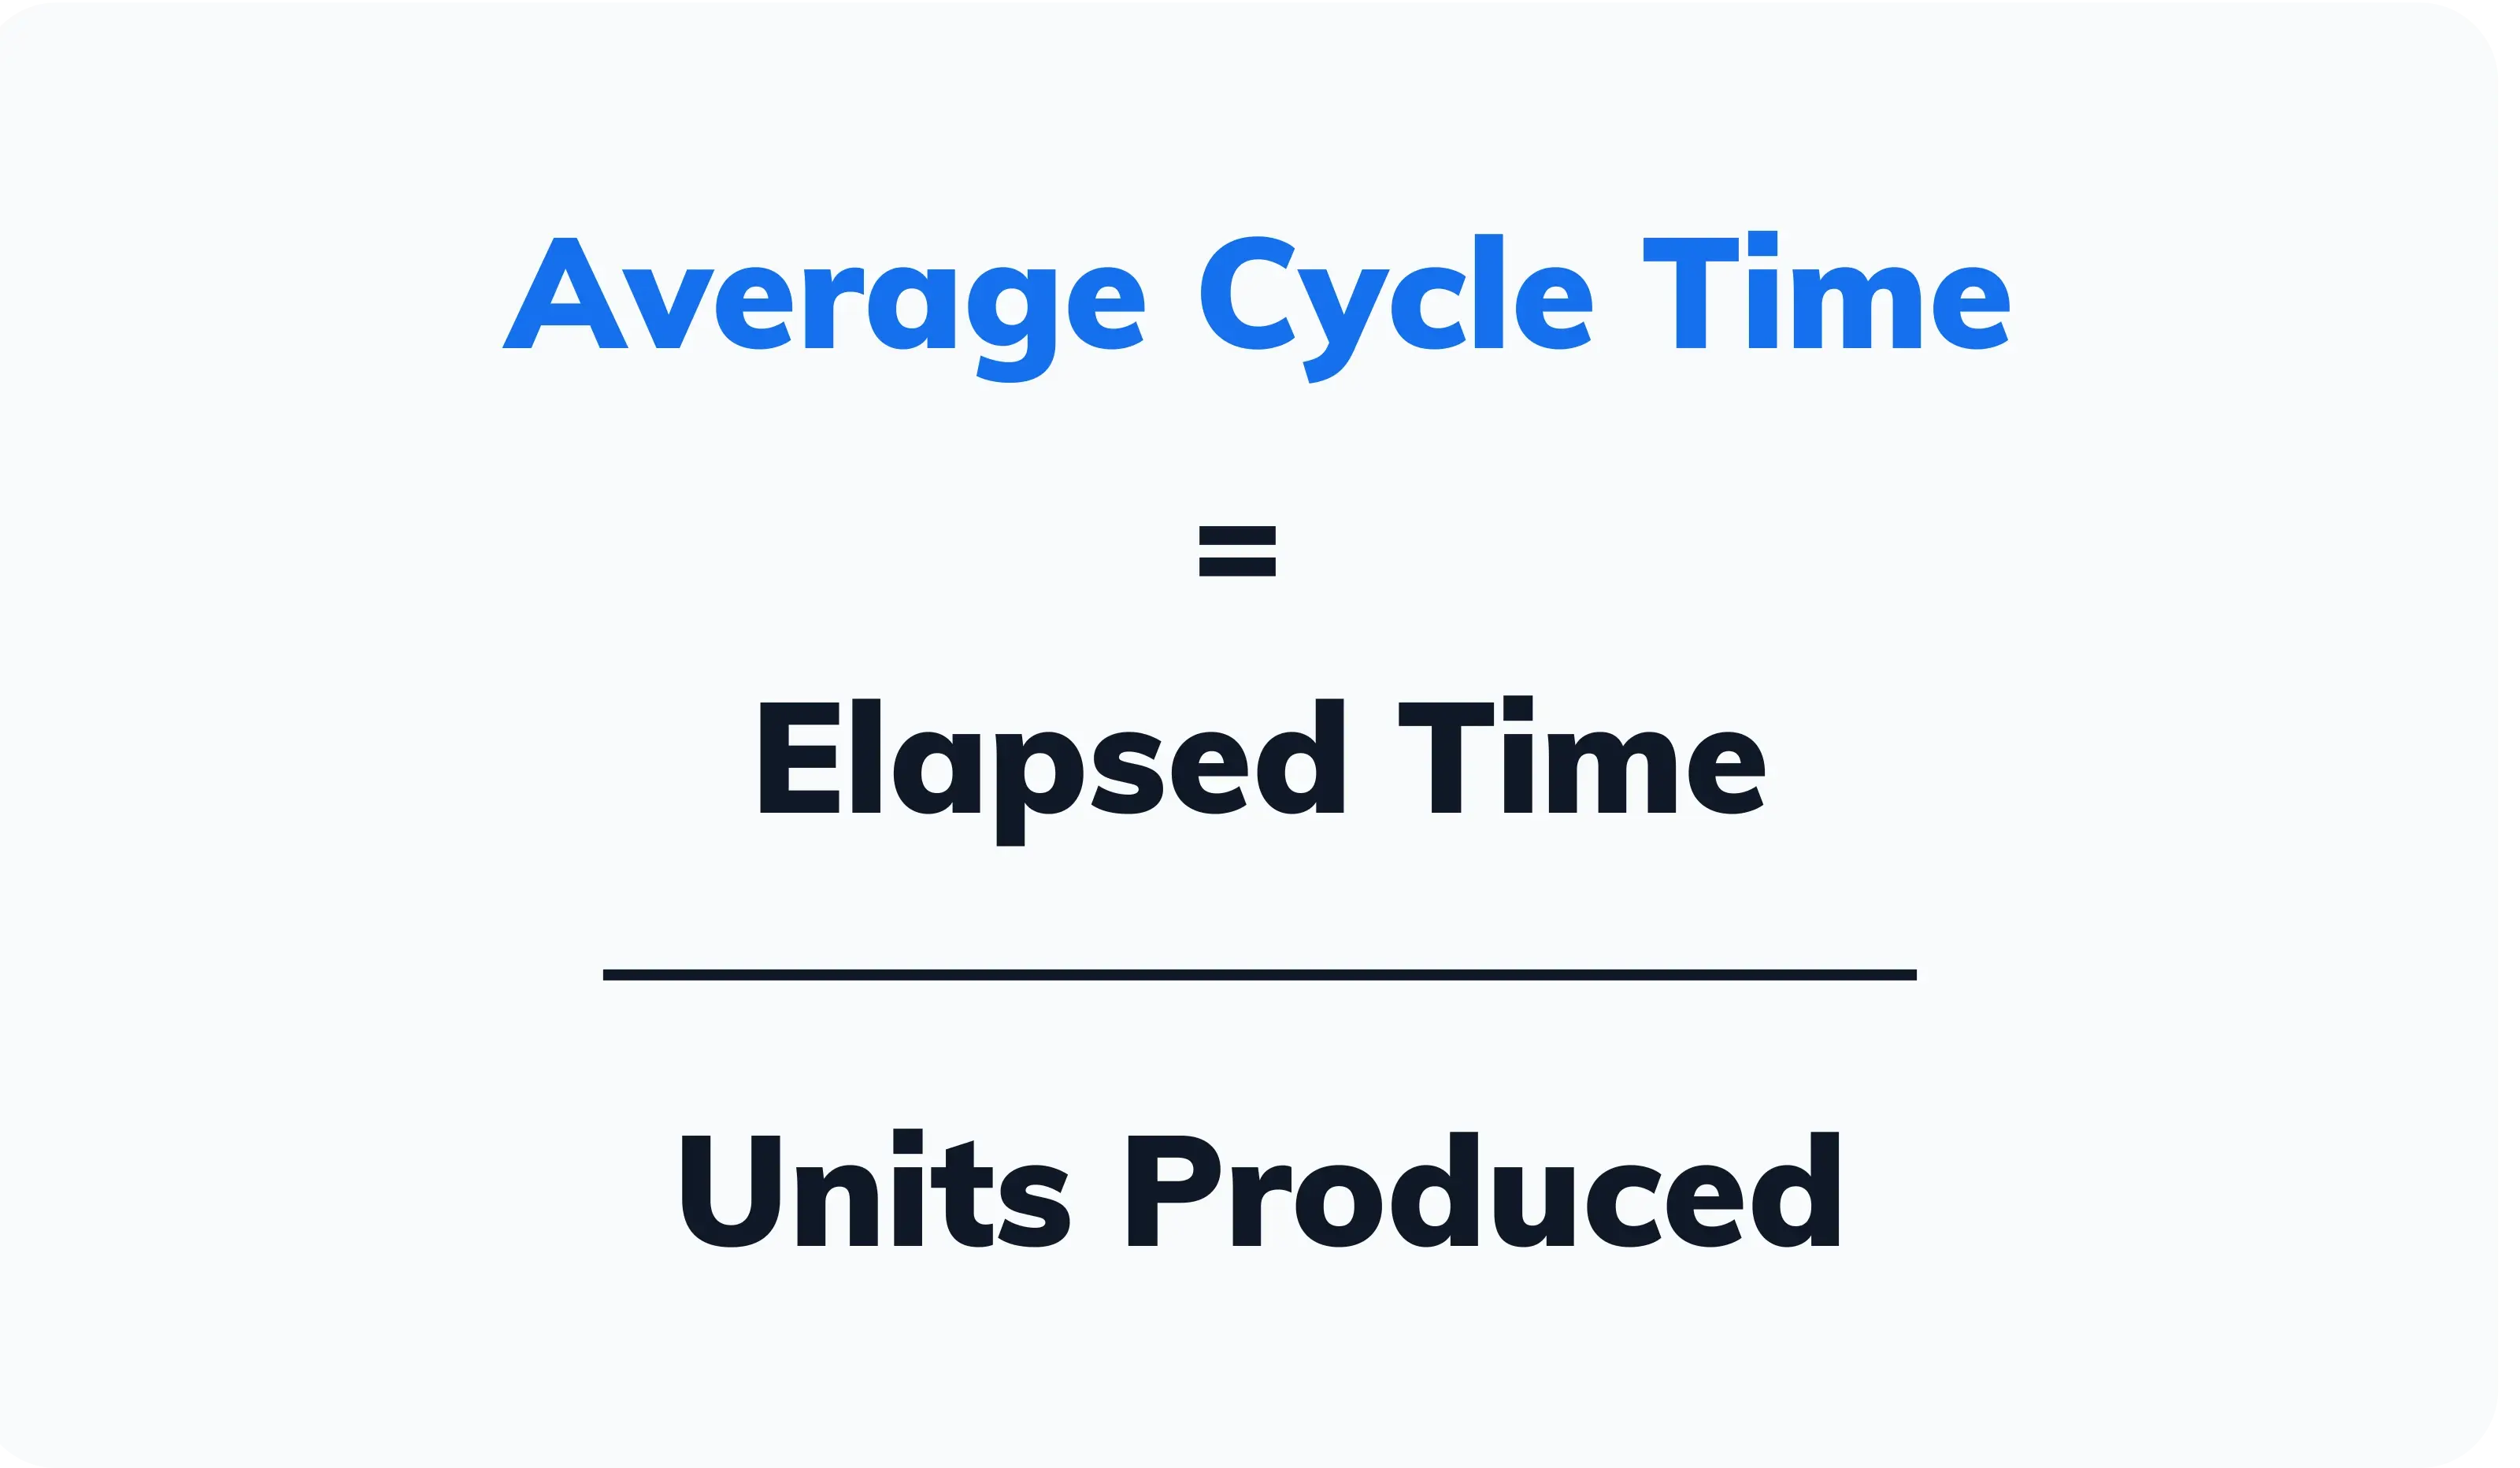
You can calculate the average cycle time per item by dividing the total cycle time of all completed items by the number of items.
This approach highlights bottlenecks and inefficiencies across stages, such as development, review, or QA. As a result, you get deeper insights for time spent in specific stages, so your teams can tackle delays where they matter most and achieve smoother, faster workflows.
That’s why following this formula helps you focus on optimizing the entire process, not just the output.
Pro tip: Cycle time in Axify measures the entire period of time, not just active time. This includes idle time and delays in your product development process.
To measure cycle time, you first need a clear boundary for when work starts and when it ends. We typically recommend tracking from the moment a task moves into active development to the moment it is deployed to production.
Backlog time is usually excluded from cycle time because the work has not entered the delivery workflow yet. However, that does not mean backlog time is unimportant. With AI-assisted development, teams may spend more time clarifying requirements, acceptance criteria, and technical context before coding starts, because better input can improve the quality of AI-generated code.
That planning time belongs in lead time (we’ll discuss this metric below). Separating the two helps you understand whether delays come from prioritization and preparation before work starts, or from execution stages such as coding, review, testing, and deployment.
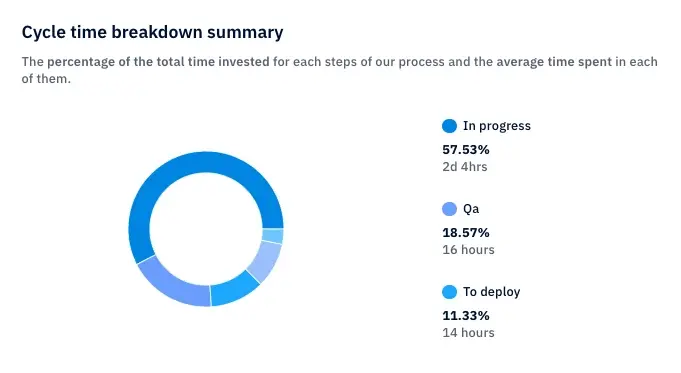
Axify calculates total cycle time and breaks it into phases that match what you see daily:
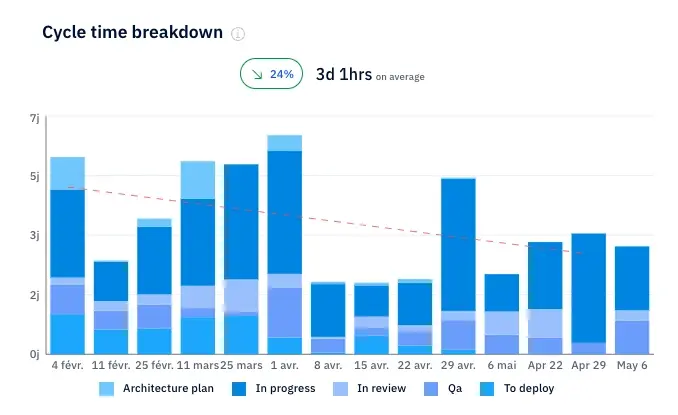
ALT: Cycle time breakdown chart showing stages like in progress, review, QA, and deployment.
This breakdown is useful because phase-specific delays have different causes. For example, if pickup time increases, it typically points to overloaded reviewers or unclear ownership. If deployment time expands, pipeline congestion or release coordination is usually the cause.
At this point, you can also use Axify to track work item age, which reflects the current cycle time of ongoing tasks. This helps you spot items that are still in progress but already exceeding expected timelines, which directly affects planning and developer experience.

ALT: Value stream view showing cycle time stages from in progress to QA and done.
At Axify, we believe that there's no universal standard for an ideal cycle time because every team and workflow is unique. However, based on our experience, elite teams can complete a user story in less than three days, while good teams typically finish within a week.
According to the latest benchmark data currently available, the top 25% of engineering teams achieve a cycle time of around 1.8 days.
Those numbers can give you a reference point for fast, consistent delivery, but they shouldn’t become fixed targets, especially now as AI changes how work moves through the SDLC.
AI may reduce coding time, but it can also shift delays into planning, review, QA, security, or deployment. So, the better question isn’t whether your team matches an external benchmark. It’s whether your cycle time is becoming shorter, more stable, and easier to explain over time.
Pro tip: Look at industry benchmarks and your internal trends and processes to gauge a good cycle time. Then, take steps to improve it.
When you leverage agile development, you prioritize delivering value sooner.
Remember: “Sooner” is not the sole keyword here. “Value” is equally important. Faster time to production is an indicator of business success and leads to significant cost savings but only if you deliver high-quality products that capture customer loyalty.
For example, your agile team can reach its target cycle time and deliver value if you break big user stories into smaller, manageable ones. This simple change speeds up current performance and lets you deliver results more frequently. It also cuts down pickup time between tasks and keeps your team focused while completing company goals efficiently.
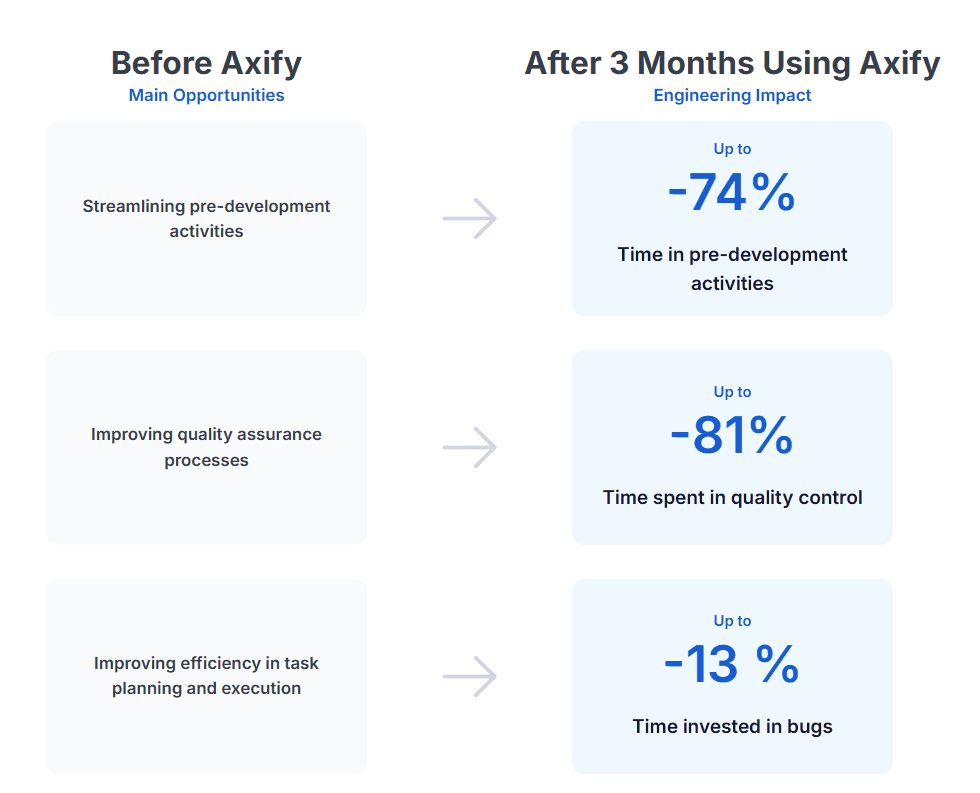
In fact, that’s one of the ways in which we helped two teams at The Business Development Bank of Canada accelerate their delivery time by 51% and obtain 10X ROI.
Remember: You should focus on maintaining momentum and improving predictability, which benefits both your team and your customers.
To understand the factors that impact cycle time, you need to look at where work waits, loops back, or gets blocked across your workflow.
Here is what affects this metric the most, in our experience:
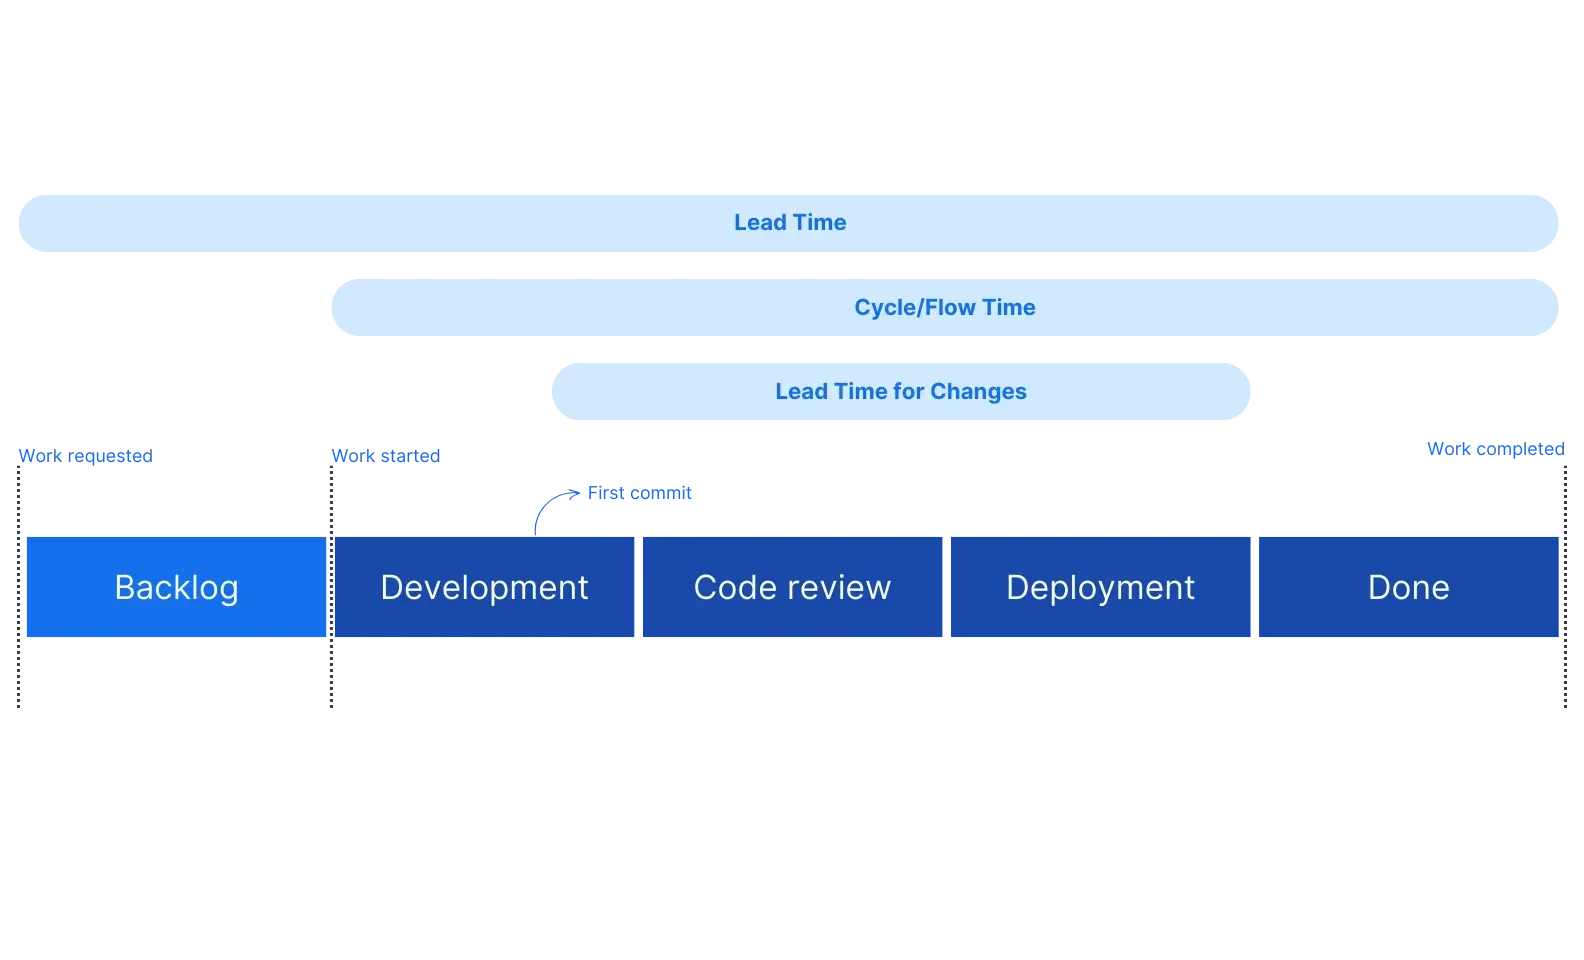
When you evaluate delivery performance, you need to distinguish what each metric actually measures in your workflow. Cycle time focuses on execution, lead time reflects the full request lifecycle, and takt time defines the pace required to meet demand.
Cycle time measures how long work takes once it starts. As we explained above, this begins when a task enters active development and ends when it reaches production. That includes coding, code reviews, waiting for feedback, testing, and deployment.
Lead time starts earlier, when a request is created, and ends when the feature is live. This metric includes backlog time, prioritization, and scheduling before development even begins. Because of that, long intake queues or unclear priorities increase lead time even if cycle time remains stable.
Takt time introduces a different perspective. Instead of measuring duration, it defines how frequently you need to deliver to meet demand. If requests arrive faster than you complete them, gaps between takt time and cycle time reveal capacity issues.
Together, these metrics help you decide whether to reduce delays, improve intake, or adjust delivery pace.
At Axify, we believe that improving your cycle time starts with understanding your entire development process. If you focus on visibility, collaboration, and reducing inefficiencies, you can take meaningful steps to streamline your workflows and deliver faster results. Here's how you can get started.
The first step to improvement is clarity. You need to see the full picture of your software development lifecycle (SDLC) and every sub-phase. We recommend that you map out your value stream to identify where time is spent and where delays occur. When you make the problem visible, you empower your team to address it.
For example, tracking pull requests can help you spot idle time when tasks sit untouched.
Pro tip: Axify doesn't just help you monitor cycle time phases for pull requests (PR cycle time). It also tracks your issue cycle time. These metrics help you rebalance your workload by setting correct priorities and, therefore, minimize bottlenecks.
To improve cycle time, you first need to understand not just where delays happen, but why they happen. You also need actionable recommendations on what to change next.
That is where Axify Intelligence shifts your approach from observation to action.
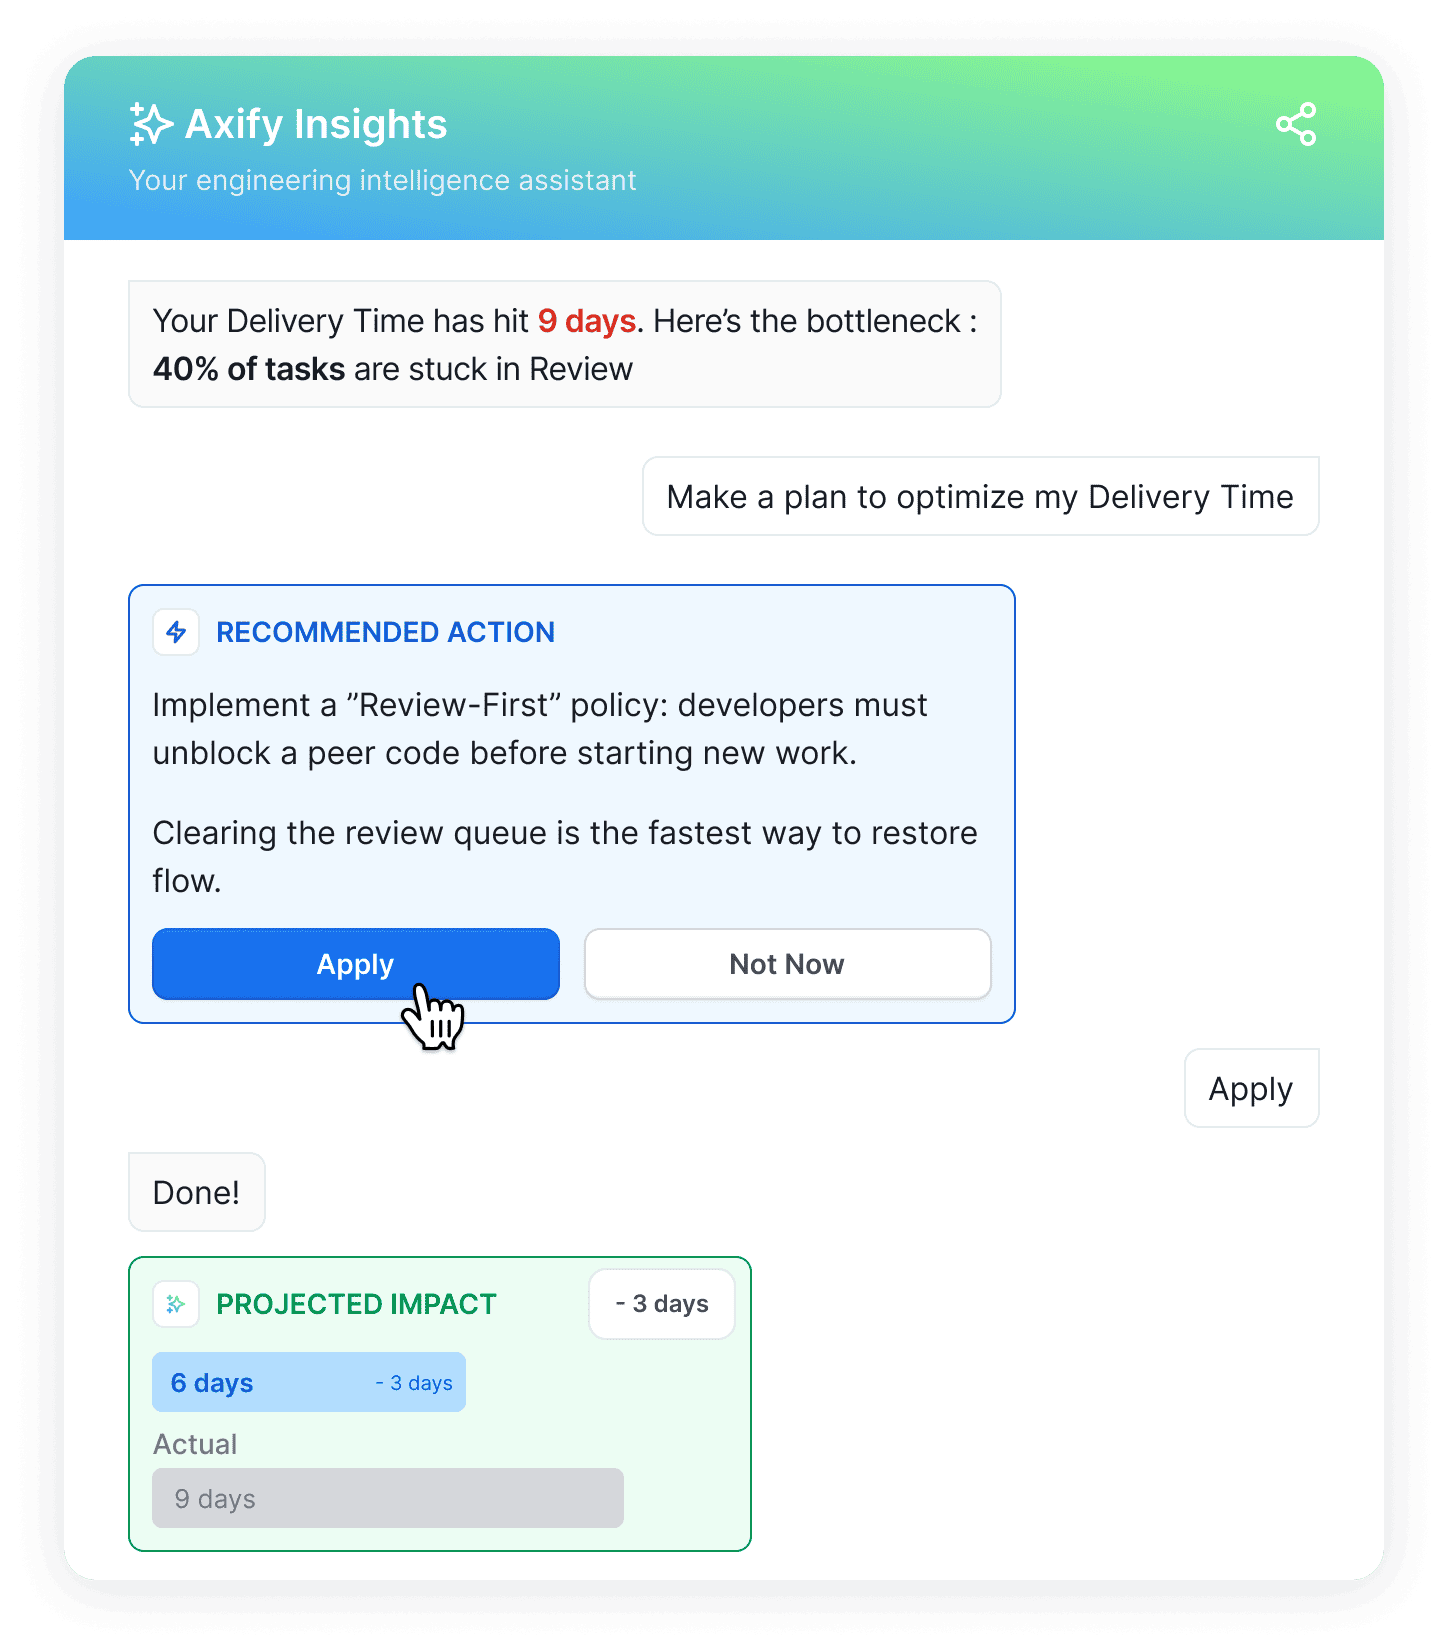
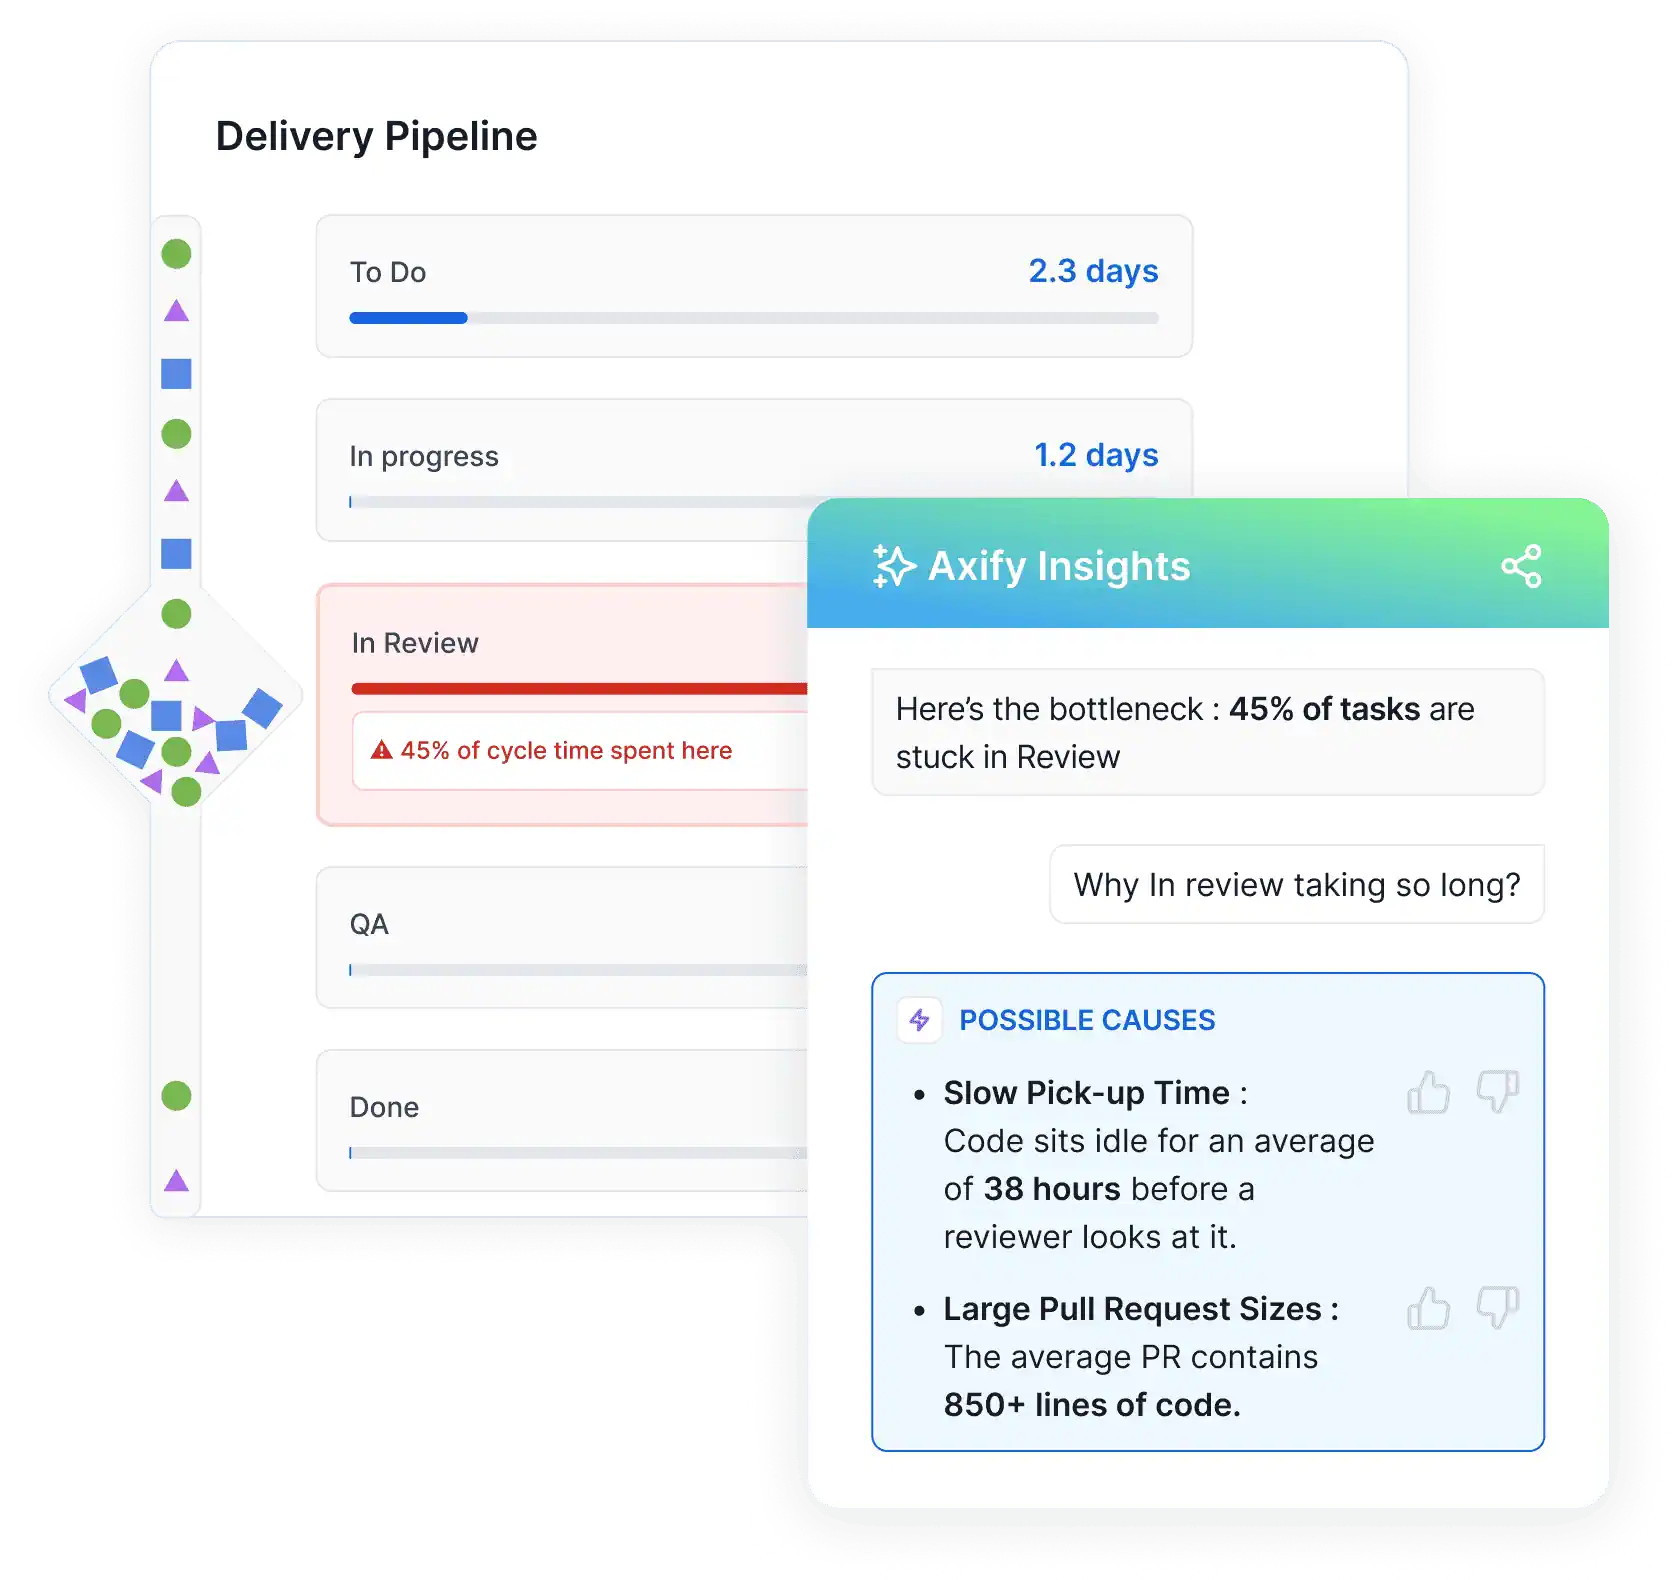
Unlike static dashboards, Axify Intelligence continuously analyzes your delivery data and points to bottlenecks across your workflow. For example, it can show that a large portion of tasks are stuck in review or waiting between steps, then explain the root cause, such as oversized pull requests or slow pickup time.
More importantly, it does not stop at insight.
The system recommends specific actions tied to the workflow that you can take to fix your issues. This includes prioritizing review queues or reducing parallel work, and allows you to apply those changes directly.
You can also query the AI assistant in natural language about delivery trends and explore the impact of your potential decisions before acting. This way, each improvement step connects directly to measurable outcomes.
.webp "Work in progress chart showing issue trends, averages, and variation over time.")
Too much WIP clogs your workflow and increases cycle time. Adding WIP limits means focusing on fewer tasks at once. That way, your team can complete work faster and with fewer errors.
Collaborative methods like mob programming can also reduce WIP by encouraging your team members to work on a single task together. This also minimizes context-switching and improves your overall productivity.
Breaking work into smaller, manageable batches can definitely speed up your delivery processes. Instead of deploying every two weeks, you should aim for weekly or even daily deployments.
Smaller batches reduce risk, make testing faster, and allow you to deliver value to your users more frequently. Your agile team can thrive on continuous delivery, and adopting smaller batches can significantly improve your cycle time.
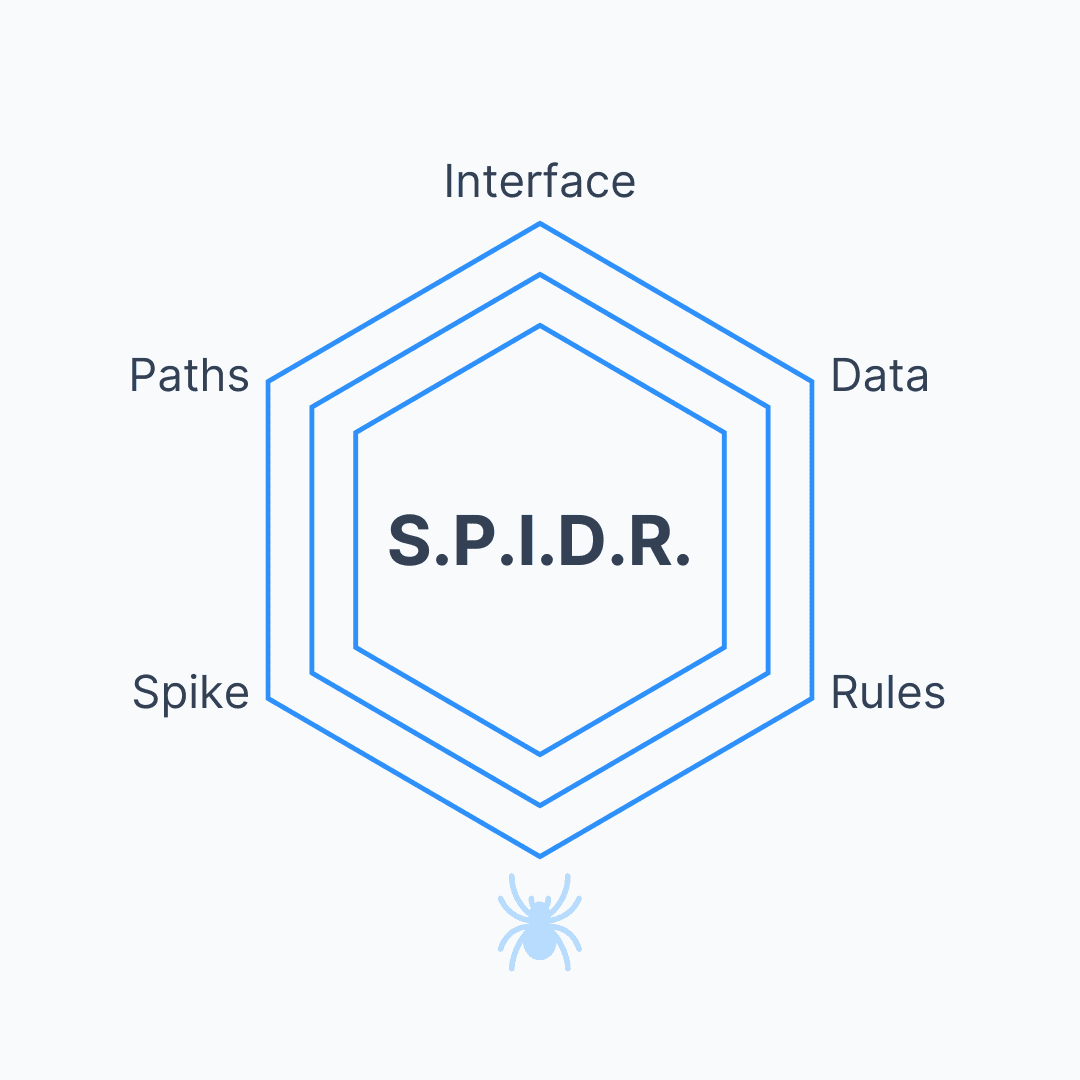
The S.P.I.D.R. technique helps you structure tasks in a way that reduces complexity and speeds up completion. It consists of five methods:
When your tasks are more manageable, you can finish them faster without sacrificing quality.
Idle time is your biggest enemy. Delays typically happen when pull requests sit waiting for approval or when work gets stuck between phases.
You can use Axify to track where work stagnates and address the root causes of these delays. For example, if approvals are taking too long, you should consider assigning backups to handle reviews or streamlining the approval process.
Every time you pass work between team members or departments, you're adding delays. Fewer hand-offs mean less time wasted waiting or explaining things.
You should assign tasks to smaller, dedicated teams that can see the work through from start to finish. This approach keeps your cycle time on track and minimizes bottlenecks.
Automation is key to faster cycle times. You can free up your team to focus on what matters most by automating repetitive tasks like testing, deployments, and hotfix rollouts. It also ensures consistency and lets you respond quickly to errors by reducing downtime and maintaining momentum.
You shouldn't treat cycle time as a one-time effort because it's an ongoing process. We advise you to regularly review your workflows, collect feedback, and make adjustments to keep improving.
Also, you can encourage your team to focus on efficiency without compromising quality. With the right mindset, you'll see sustained improvements in your cycle time and overall delivery.
You can make impactful changes to your process by following these tips and leveraging Axify's insights. Faster cycle times mean more predictable outcomes, happier customers, and a more motivated team.
Cycle time becomes useful when you connect it to real workflow changes. That means looking at how teams reduce waiting between steps and what impact those changes have. Here are two examples from Axify that show how cycle time improves when you act on delivery data.
At BDC, the focus was on understanding where time accumulated across development, review, and validation steps. We realized that delays were spread across pre-development, QA, and planning. After analyzing delivery flow, the teams introduced smaller work items, earlier QA involvement, and stricter WIP limits.
As a result, delivery time improved by 51%, which reflects faster movement across the full cycle.
At the same time, time spent in pre-development dropped by 74%, and quality control time decreased by 81%. That shows that reducing upstream and downstream delays directly shortens cycle time.
This example shows a clear pattern: when you reduce waiting between steps, work flows faster without increasing pressure on individual contributors.
At Newforma, we approached the problem differently by focusing on review quality and deployment flow. That decision followed from identifying delays in validation and pull request handling, which were extending the cycle time.
After adjusting review practices and improving deployment processes, pull request cycle time dropped by 60%.
At the same time, lead time for changes decreased by 63%, and delivery frequency increased significantly, reaching 22x more deliveries.
This example shows that when review and deployment steps are streamlined, cycle time improves because work spends less time waiting and more time moving forward.
AI changes how work moves through your workflow. It can even accelerate some phases, but it doesn’t necessarily prevent bottlenecks. Here’s what current research tells us so far:
AI tools shorten the time spent writing code. That directly reduces the coding phase of the cycle time.
However, this improvement shifts pressure to the next steps.
Review queues grow because more pull requests are opened in less time, and validation becomes stricter as teams verify generated code.
This shift becomes clear when you look at how time is actually spent.
Flow efficiency across engineering teams typically shows only 5-15% active work, with the rest waiting between steps. In addition, developers now spend around 9% of their time reviewing and correcting AI-generated code, which adds work after coding instead of removing it.
In other words, faster commits do not guarantee faster delivery, because work still waits in review, testing, or deployment queues.
Pro tip: We’ve discussed all these dynamics and whether coding agents can really save developers’ time in this article.
This leads to a broader pattern. According to the 2025 DORA Report, AI “creates localized pockets of productivity that are often lost to downstream chaos.” That happens because improvements in the inner loop (writing code) are not matched by changes in review practices or deployment flow.
For example, if the pull request size increases due to generated code, review time grows. That directly extends cycle time, even if coding was faster.
So the implication is clear. Cycle time only improves when you adjust the full system. That means reducing review delays, controlling PR size, and ensuring CI/CD pipelines keep pace with increased output.
Cycle time tells you where work slows. Axify helps you understand why it slows and what to change next. With Axify, you can:
That starts with visibility into the full path of work. Axify breaks cycle time into the stages that shape delivery, so you can see whether delay accumulates in coding, review, waiting, testing, or deployment.
Remember: Follow trends over time. A single average cannot tell you whether work is stuck in review queues, sitting idle in progress, or blocked before release.
Axify also gives you related signals, such as aging work in progress. That can help you spot items whose current cycle time is already drifting beyond the team’s normal range.
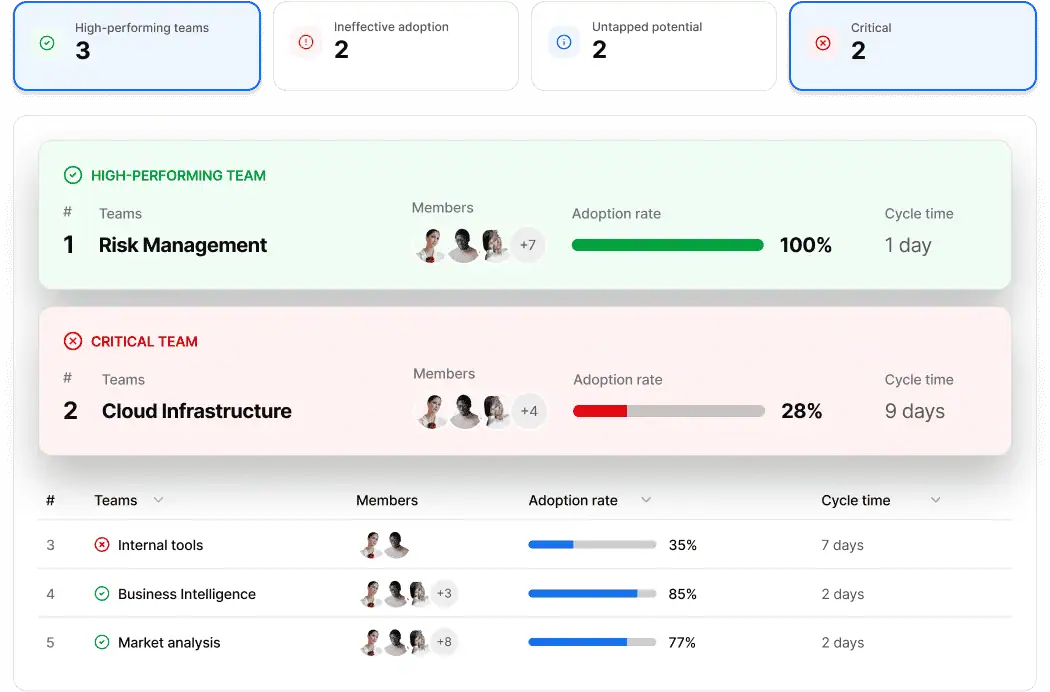
That stage-level view becomes more useful when AI enters the workflow. Axify AI Impact compares delivery performance with and without AI support, so you can see whether faster coding actually leads to faster cycle time. It also tracks adoption by team, project, and tool usage, then connects that usage to delivery outcomes across the workflow.
This means you can identify whether AI shortens coding time but increases review or validation effort, and then decide where to adjust your process so gains in one phase are not lost in another.
Once you know where time is being lost, Axify Intelligence helps you act on it. It analyzes delivery data, identifies bottlenecks, explains likely causes, and recommends what to do next.
For instance, it can detect that a large share of work is stuck in review, link that delay to slow pickup time or oversized pull requests. Then, it suggests concrete actions such as prioritizing review queues or reducing parallel work.
This connects each insight to a specific fix in your workflow, so decisions translate directly into measurable impact.
Ready to take control of your cycle time and streamline your workflows? Book a demo with Axify today and see how we can help you deliver smarter, faster, and more effectively.

Cycle time shows how long a single work item takes from start to finish. Throughput shows how many items are completed within a set timeframe. Short cycle time with low throughput typically points to strict WIP limits. High throughput with long cycle time usually signals overloaded workflows.
Yes, cycle time includes all elapsed time and not just active work. That covers queue time, review delays, testing delays, and idle periods between steps. Focusing only on coding time hides where work actually gets stuck. This makes bottlenecks harder to detect.
Consistent cycle time makes delivery timelines easier to predict. When variation is low, similar tasks tend to follow similar durations. This allows more confident planning and expectation setting. High variability reduces accuracy, even when averages look acceptable.
No, cycle time reflects how the system performs rather than individual output. Using it to assess developers shifts focus away from workflow issues. This typically leads to local optimizations that increase delays elsewhere. System-level fixes have a more reliable impact.
No, each team operates under different conditions and constraints. Work complexity, ownership scope, and system dependencies vary across teams. So, direct comparisons can lead to incorrect conclusions. But tracking improvement trends within the same team provides better insight.
Weekly reviews provide a stable view of trends without reacting to noise. Daily changes are expected and usually reflect normal variability. Looking at patterns over time helps identify real issues, and that can support more grounded decisions.
Yes, short-term increases can happen during process changes or refactoring efforts. Work may slow down as teams address structural issues or reduce technical debt. This shift usually leads to more stable delivery afterward. Temporary impact supports long-term gains.
Cycle time measures how long work takes once it starts. Lead time covers the full duration from request to production. The gap between them shows how long work waits before development begins. Reducing that gap improves overall delivery flow.