Delivery Performance
16 minutes reading time

.png?width=1200&name=Axify%20blogue%20header%20(11).png)
Continuous improvement is an objective that we all want to include in our daily lives. However, many of us "de-prioritize" continuous improvement when we have fires to put out or concrete value-added tasks to perform for our colleagues.
But did you know there is real financial value to continuous improvement in software development? In this blog post, discover the potential return of improving your software delivery performance.
Continuous improvement means making small changes regularly to how your team works. You're not overhauling everything overnight. You're spotting what could be better and doing something about it. Over time, those small moves add up.
The American Society for Quality views continuous improvement as ongoing. This process includes incremental as well as breakthrough changes:
“Continuous improvement, sometimes called continual improvement, is the ongoing improvement of products, services or processes through incremental and breakthrough improvements.” – ASQ (American Society for Quality)
The Kaizen Institute sees continuous improvement as less of a process and more of a culture.
“Continuous improvement is a fundamental concept within operational excellence and refers to the systematic and constant effort to improve an organization’s processes, services, and products. Continuous improvement is an endless cyclical process, highlighting the importance of a proactive problem-solving and process optimization approach.” – Kaizen Institute
You’ll find different ways to run these changes. The Lean methodology helps you cut waste. The Agile methodology pushes for short feedback cycles and fast action.
Both focus on steady progress, not perfection. The goal isn’t to fix everything at once but to make consistent, small changes that move you forward.
According to the 2024 State of DevOps report by DORA (DevOps Research and Assessment), your team gets the most out of continuous improvement when you treat it as a habit. It’s not a one-time project; it’s a way of working. The best results come when you work in small steps and persist. This mindset helps make your incremental improvements stick.
We’ll use the four key metrics from DORA’s 2021 State of DevOps report to estimate the potential return of continuous improvement in development teams. Our calculations were initially based on the 2021 figures, but as the gap between elite and low performers widens, imagine the ROI scale you could achieve by enhancing your development team's performance! Analysis of the 2024 edition of the State of DevOps report revealed slightly different numbers, but the 2021 benchmarks remain a solid, well-understood baseline for modeling your potential gains.
The four DORA metrics are divided into two categories: speed and stability. After surveying more than 32,000 professionals and organizations, the DORA team distinguished four performance groups (elite, high, medium, and low) with associated benchmark results.
|
Delivery performance aspect |
Elite |
High |
Medium |
Low |
|
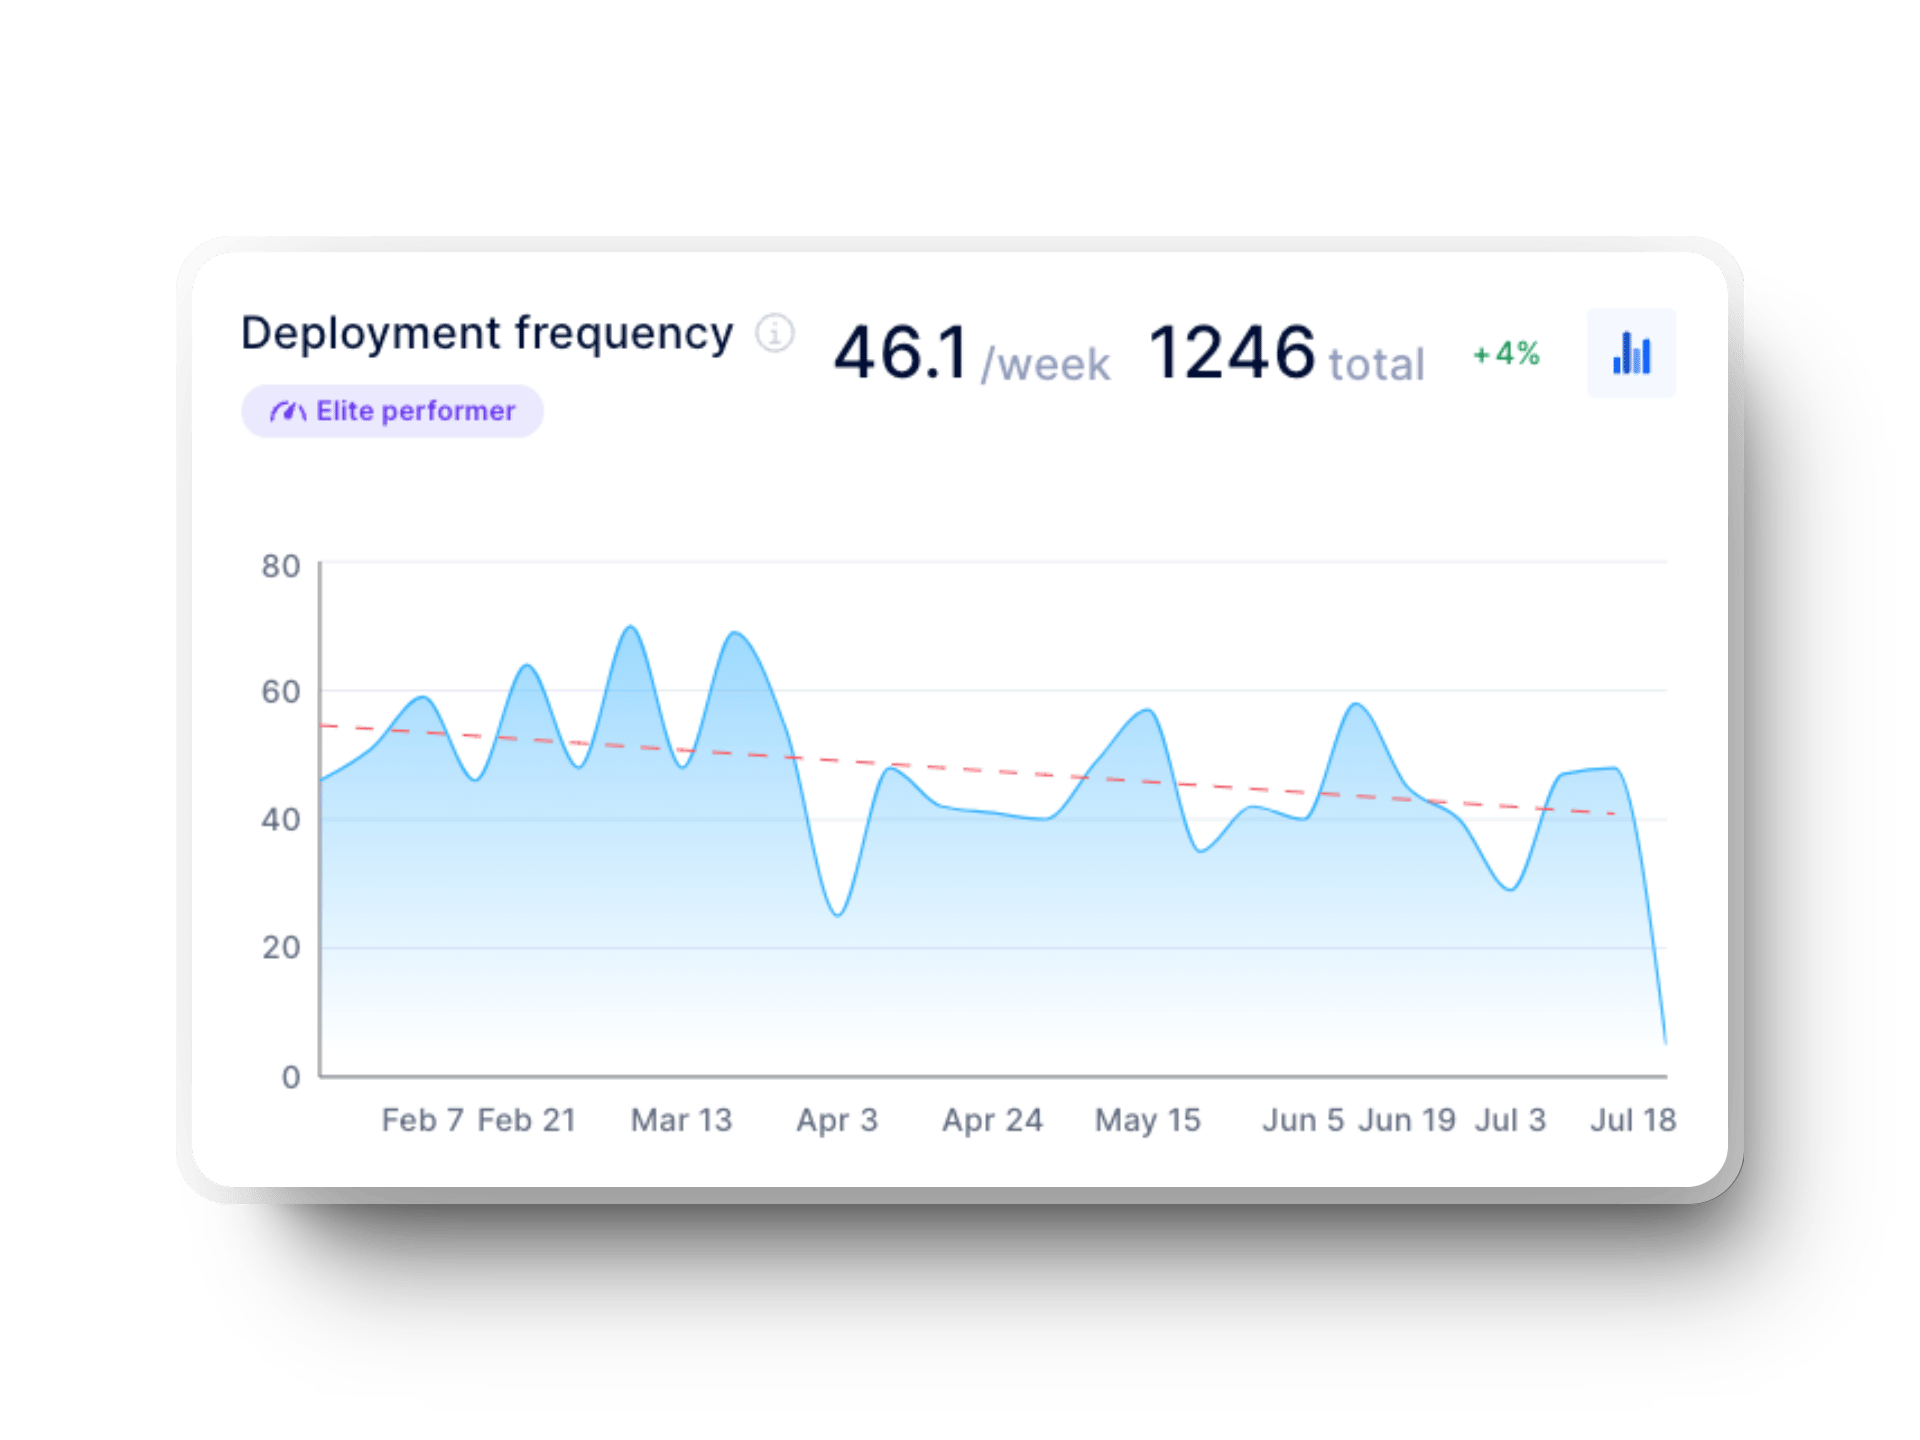
Deployment frequency(how often the organization deploys in production to the end-user) |
On-demand (several deployments per day) |
Between 1x per week and 1x per month |
Between 1x per month and 1x every 6 months |
Less than once every 6 months |
|
Lead time for changes(the time between the first commit and delivery to production) |
Less than an hour |
Between 1 day and 1 week |
Between 1 and 6 months |
More than 6 months |
|
Failed Deployment Recovery Time(the time required to repair the service following an incident) |
Less than an hour |
Less than a day |
Between 1 day and 1 week |
More than 6 months |
|
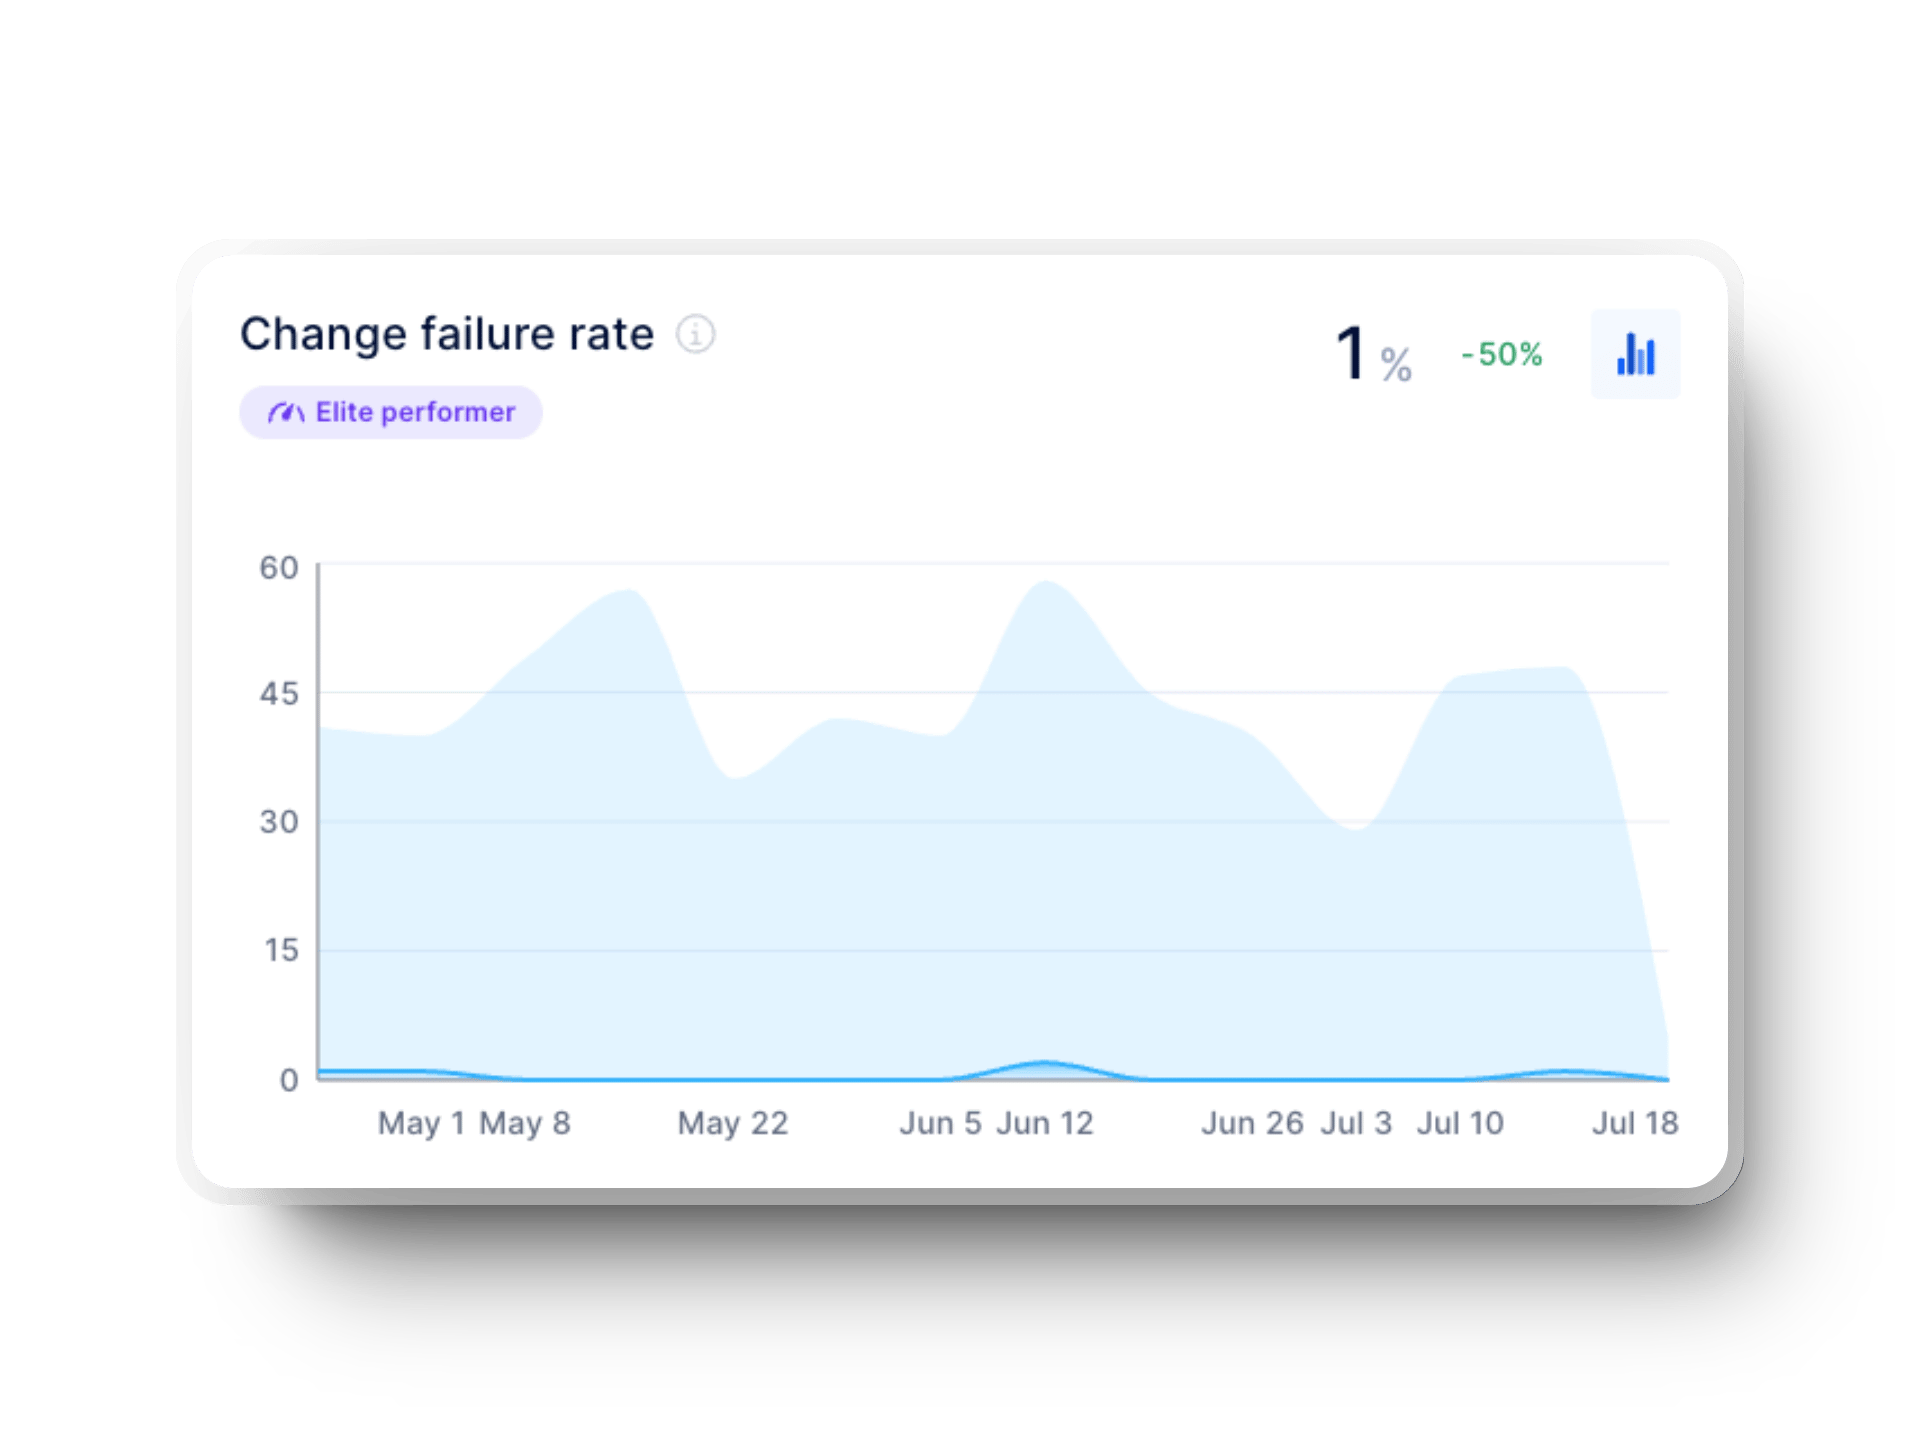
Change failure rate (the percentage of changes in production that cause an incident) |
0 to 15% |
16 to 30% |
16 to 30% |
16 to 30% |
Source: State of DevOps 2021, Google.
To create maximum value for the organization, the best teams understand that they must optimize the speed of delivery. Value is lost in opportunity costs or when effort is spent on non-value-added work (e.g., unnecessary rework or manual testing) that could be spent on value-added work (e.g., new features).
There is also a loss of value when the deployment of a new product or feature is delayed, including a loss of revenue or customers that the company is not generating but could have attracted by delivering sooner.
Engineers spend around 33% of their time on low-value tasks, such as recovering lost data or using outdated information. These delays typically reveal opportunities for improvement and gaps in your current processes, which can be addressed through focused process improvement initiatives.
The ability to discover and deliver faster to your customers is a substantial competitive advantage that the Lean and Agile paradigms provide. They will remain advantages for years to come.
"The ability to discover and deliver faster to your customers is a substantial competitive advantage that the Lean and Agile paradigms provide. They will remain advantages for years to come."
Alexandre Walsh
Co-Founder and Head of Product at Axify
The costs avoided by the company are considered a return because they directly impact the revenue and expenses of the original budget. So, for example, if you have an initial budget of $100 million in expenses, and by improving a technology, you now have expenses that amount to only $80 million, you have $20 million available that was not initially planned.
To calculate the potential return of improvement, we will add the value recovered in the unnecessary rework avoided, the potential added value of reinvesting this time in new features and the cost of the failures that can be avoided.
Around 25% of improvements lead to time savings, averaging nearly one hour per day (or 270 hours in the first year), translating to a "soft savings" of approximately $7,924 per improvement. These savings typically reflect benefits driven by clear ideas, a structured continuous improvement approach, and quality management across initiatives.
Consider Michael, an engineering manager who manages a team of 50 people for a $10 million product. According to the DORA metrics he actively tracks, his team is currently in the medium performance group. What is the payoff if he can get his team to perform at a high level? Let's do the math to find out!
We need to recognize the value of the time people spend working, which is recovered by reducing inefficiencies. For example, organizations get additional capacity without recruiting and hiring by improving processes.
Google's research also shows that improved DevOps practices lead to higher employee satisfaction and that employees on high-performing teams are 2.2 times more likely to recommend their organization as a great workplace.
We will find the value of the unnecessary rework avoided using this formula:

Source: The ROI of DevOps Transformation, Google
Let's analyze each element of the formula in more detail.
You can use the number of technical people in your teams. For Michael's example, we have already determined that his team has 50 technical employees. This is typically the first step in estimating costs for larger projects or specific business process improvements.
Salaries vary greatly depending on the company's location and the cost of living. You can use your data, but for this example, we will use Michael's average annual team member salary of $85,000.
This is a representative example of the market based on data reported by Glassdoor for developers in Canada. Salary benchmarks like this also support accurate planning during your continuous improvement efforts.
In addition to salary, the organization contributes to the cost of employee benefits (e.g., insurance, vacation, retirement plans, etc.), usually added to the salary. Each organization has a percentage of about 15% for small companies and 30% for larger ones.
So, for example, for a salary of $100,000 annually, you will need to add between $15,000 and $30,000 in benefits. This is a multiplier of 1.15 to 1.3 of the base salary. For this example, we will use the data provided to us by Michael, which is a multiplier of 1.15.
This factor plays a role in identifying improvement opportunities in budgeting and resource allocation using a clear, systematic approach.
This number represents the amount of time spent on non-value-added work, or in other words, the hours worked that are essentially lost to inefficiency. Our reference here will be the 2018 State of DevOps report, where the research shows that even the best teams have a rework percentage of 19%, and we can aim for an improvement target of 18%.
So we will use 1% for the elite teams' formula, which is the difference between the goal and their reality. The high-performance teams reported a 19.5% rework percentage, while the medium and low-performance teams reported a 20% rework percentage. We will, therefore, assign them values of 1.5% and 2%, respectively.
These benchmarks help support your continuous improvement activities and spark new ideas. Over time, they can help you build a continuous improvement culture and promote lasting benefits over time.
This variation in the percentages of the four groups (1%, 1.5%, and 2%) will allow us to compare the cost of unnecessary rework per year by team performance level, all other variables being equal.
So, if we apply the formula, we get the following results:
|
Elite performance |
High performance |
Medium performance |
Low performance |
|
50 employees x $85 000 salary x 1,15 benefits x 1% rework = $48 875 |
50 employees x $85 000 salary x 1,15 benefits x 1,5% rework = $73 313 |
50 employees x $85 000 salary x 1,15 benefits x 2% rework = $97 750 |
50 employees x $85 000 salary x 1,15 benefits x 2% rework = $97 750 |
Since Michael's team is in the medium performance group, he would get a potential return of $97,750 annually by recovering 2% of his time from unnecessary rework
The idea is to take the time recovered from reducing inefficiencies and turn it into value by using it to generate revenue through new customer features. Team inefficiencies create opportunity costs and put the potential to add more value to the product at risk. While delivering new features brings revenue, not all features are winners.
Several experiments at Microsoft, in collaboration with Stanford University, have shown that only one-third of features succeed. The most successful companies leverage their ability to deliver quickly to production to experiment.
This ability is typically supported by a strong continuous improvement mindset, steady ongoing efforts, structured feedback loops, and a clear focus on customer expectations.
We will base the revenue potential on the company's current revenues for our calculations. Therefore, we will use this formula:

Source: The ROI of DevOps Transformation, Google
Let's analyze each element of the formula in more detail.
We will use the same methodology as in the previous section (e.g., 2% for teams with a medium performance like Michael's). It is the same data since the recovered time is the time we can reinvest.
This is the ability to test features on customers. So, we reuse the deployment frequency based on the team's performance. Elite teams experiment 2 times a day (or 730 times a year). High-performing teams experiment between 1 time per week and 1 time per month (on average 32 times per year).
Medium teams experiment between 1 time per month and 1 time every 6 months (average 7 times per year), and low-performing teams experiment less than once every 6 months (average 2 times per year).
This variation in the number of deployments for all four groups will allow us to compare the value of experimenting more often by making good use of the time saved by eliminating unnecessary rework.
Organizations may have multiple business units where each unit has a central product to serve customers. We can estimate an average of twenty business lines for large organizations (more than 8,500 employees). In comparison, for medium-sized organizations (more than 2,000 employees), we can estimate an average of eight business lines.
We can estimate one line of business for small organizations (250 employees or less). This is the case for Michael, and this is the data we will use for our example, but we invite you to use your figures.
Understanding this structure helps you with identifying ideas for improvement, planning successful implementations, and applying the right process improvement methodology as part of your broader digital transformation strategy.
According to the Microsoft study, only one-third (33%) of the features sent to production positively impact key metrics. We will, therefore, use this figure for the calculations.
Each successful change has the potential to help generate more revenue or profit for the company. Some features can contribute up to 200% of revenue, while others will not (e.g. 0.01%). On average, we will estimate that an idea contributes to 1% of revenue.
The potential revenue from new features is estimated based on the current revenue of the product. For our calculations, we will use the product Michael's team is working on that generates $10 million in revenue.
So, if we apply the formula, we get the following results:
|
Elite performance |
High performance |
Medium performance |
Low performance |
|
1% recovered time x 730 experimentations x 1 business line x 33% success rate x 1% impact on revenue x $10 M in revenue = $240 900 |
1,5% recovered time x 32 experimentations x 1 business line x 33% success rate x 1% impact on revenue x $10 M in revenue = $15 840 |
2% recovered time x 7 experimentations x 1 business line x 33% success rate x 1% impact on revenue x $10 M in revenue = $4 620 |
2% recovered time x 2 experimentations x 1 business line x 33% success rate x 1% impact on revenue x $10 M in revenue = $1 320 |
By improving its performance, Michael's team could experiment more and get a significantly higher potential return with the avoided rework time reinvested in working on new value-added features.
Applications and infrastructure can suffer incidents that bring service down, and these outages cost the organization. According to a report by Stephen Elliot, vice president at IDC, a business intelligence firm for the technology sector, the cost of an outage per hour can range from $1.25 to $2.5 billion for Fortune 1000 companies.
However, these figures vary widely depending on the nature of the business. Avoiding these losses is one of the major benefits of ongoing improvements.
To find the cost of these failures, we will use this formula:

Source: The ROI of DevOps Transformation, Google
Let's analyze each element of the formula in more detail.
The deployment frequency can affect how often the team risks introducing a change that causes an incident. Referring to the table above:
This is the percentage of deployments resulting in a production incident. To find this number, we will use DORA metrics. Elite performers have a failure rate between 0 and 15% (average 7.5%), high performers have a failure rate between 16 and 30% (average 23%), medium performers have a failure rate between 16 and 30% (average 23%), and low performers have a failure rate between 16 and 30% (average 23%).
Failed Deployment Recovery Time (also known as Time to Restore Service and Mean Time To Recovery (MTTR))
When there is a failure or degradation, this is the time required to correct the situation. To find the number, we'll use DORA metrics. Elite performers recover in less than an hour (average of 0.5 hours), high performers recover in less than a day (average of 4 hours), and medium performers recover between a day and a week (average of 24 hours). Finally, low performers recover in over six months (average of 180 days, or 4320 hours).
Outages can be costly for the organization. The cost of an outage can vary greatly depending on its nature and level of degradation. You will need to use your data to refine the calculation.
According to Steven Elliot's report, an infrastructure failure would cost an average of $100,000, while a critical failure would cost an average of $500,000 to $1M. Michael confirmed that $1,000 was a representative amount for his team. This is the figure we will use for the calculation.
Therefore, it is the level of performance of the team that will determine the cost of an outage within the company.
So, if we apply the formula, we get the following results:
|
Elite performance |
High performance |
Medium performance |
Low performance |
|
730 deployments x 7,5% failure rate x 0,5 h to recover x $1 000 cost
|
52 deployments x 23% failure rate x 4 h to recover x $1 000 cost
|
12 deployments x 23% failure rate x 24 h to recover x $1 000 cost
|
2 deployments x 23% failure rate x 4 320 h to recover x $1 000 cost
|
You'll find that even with more frequent deployments (and thus a greater chance of introducing changes that cause an incident), teams that continuously improve toward elite performance experience much less costly outages.
So, the solution to reducing the cost of outages is not to reduce the frequency of deployment but rather to reduce the change failure rate and failed deployment recovery time.
Now that we have identified the major costs and value components, we can combine them to find the potential return of having a higher-performing team.

Source: The ROI of DevOps Transformation, Google
So we will add up the variables found previously:
|
Elite performance |
High performance |
Medium performance |
Low performance |
|
$48 875 of avoided rework + $240 900 of rework reinvested in added value + $27 375 in costs related to avoided outages = $317 150 |
$73 313 of avoided rework + $15 840 of rework reinvested in added value + $29 440 in costs related to avoided outages = $118 593 |
$97 750 of avoided rework + $4 620 of rework reinvested in added value + $38 640 in costs related to avoided outages = $141 010 |
$97 750 of avoided rework + $1 320 of rework reinvested in added value + $1,987 M in costs related to avoided outages = $2,086 M |
We can see the real impact of improving certain aspects of a development team's performance and the potential return from undertaking a continuous improvement process.
If Michael's team gets better at optimizing the development flow, it can make changes quickly and frequently to deliver value more often.
Getting 2% of your time back from unnecessary rework avoided is a worthy goal, but you must also ask yourself what you can accomplish with the reclaimed time. The chart above clearly demonstrates the correlation between better performance and potential return if it is invested in adding value to the product.
The further a team progresses toward elite performance, even if they recover less unnecessary rework time avoided (1% vs. 1.5% or 2%), they can deliver more value with that time, since their outages are less costly and they deploy changes more often. As a result, these teams spend the most time adding value and the least time on non-value-added tasks.
Regardless of where you are currently in the table (and perhaps you are at different levels for each of the metrics), moving a single column to the left for any of the DORA metrics can significantly impact your organization.
Before you start doing, you need a plan. This doesn’t have to be a big, formal document. Just think through these basics:
Also, make it clear how you’ll collect and use feedback. That keeps your plan flexible and grounded in reality.
Improved productivity can bring a return to the organization by providing better capabilities and performance. But where to start? To improve, we need to set goals, and to set goals, we need to understand our initial situation.
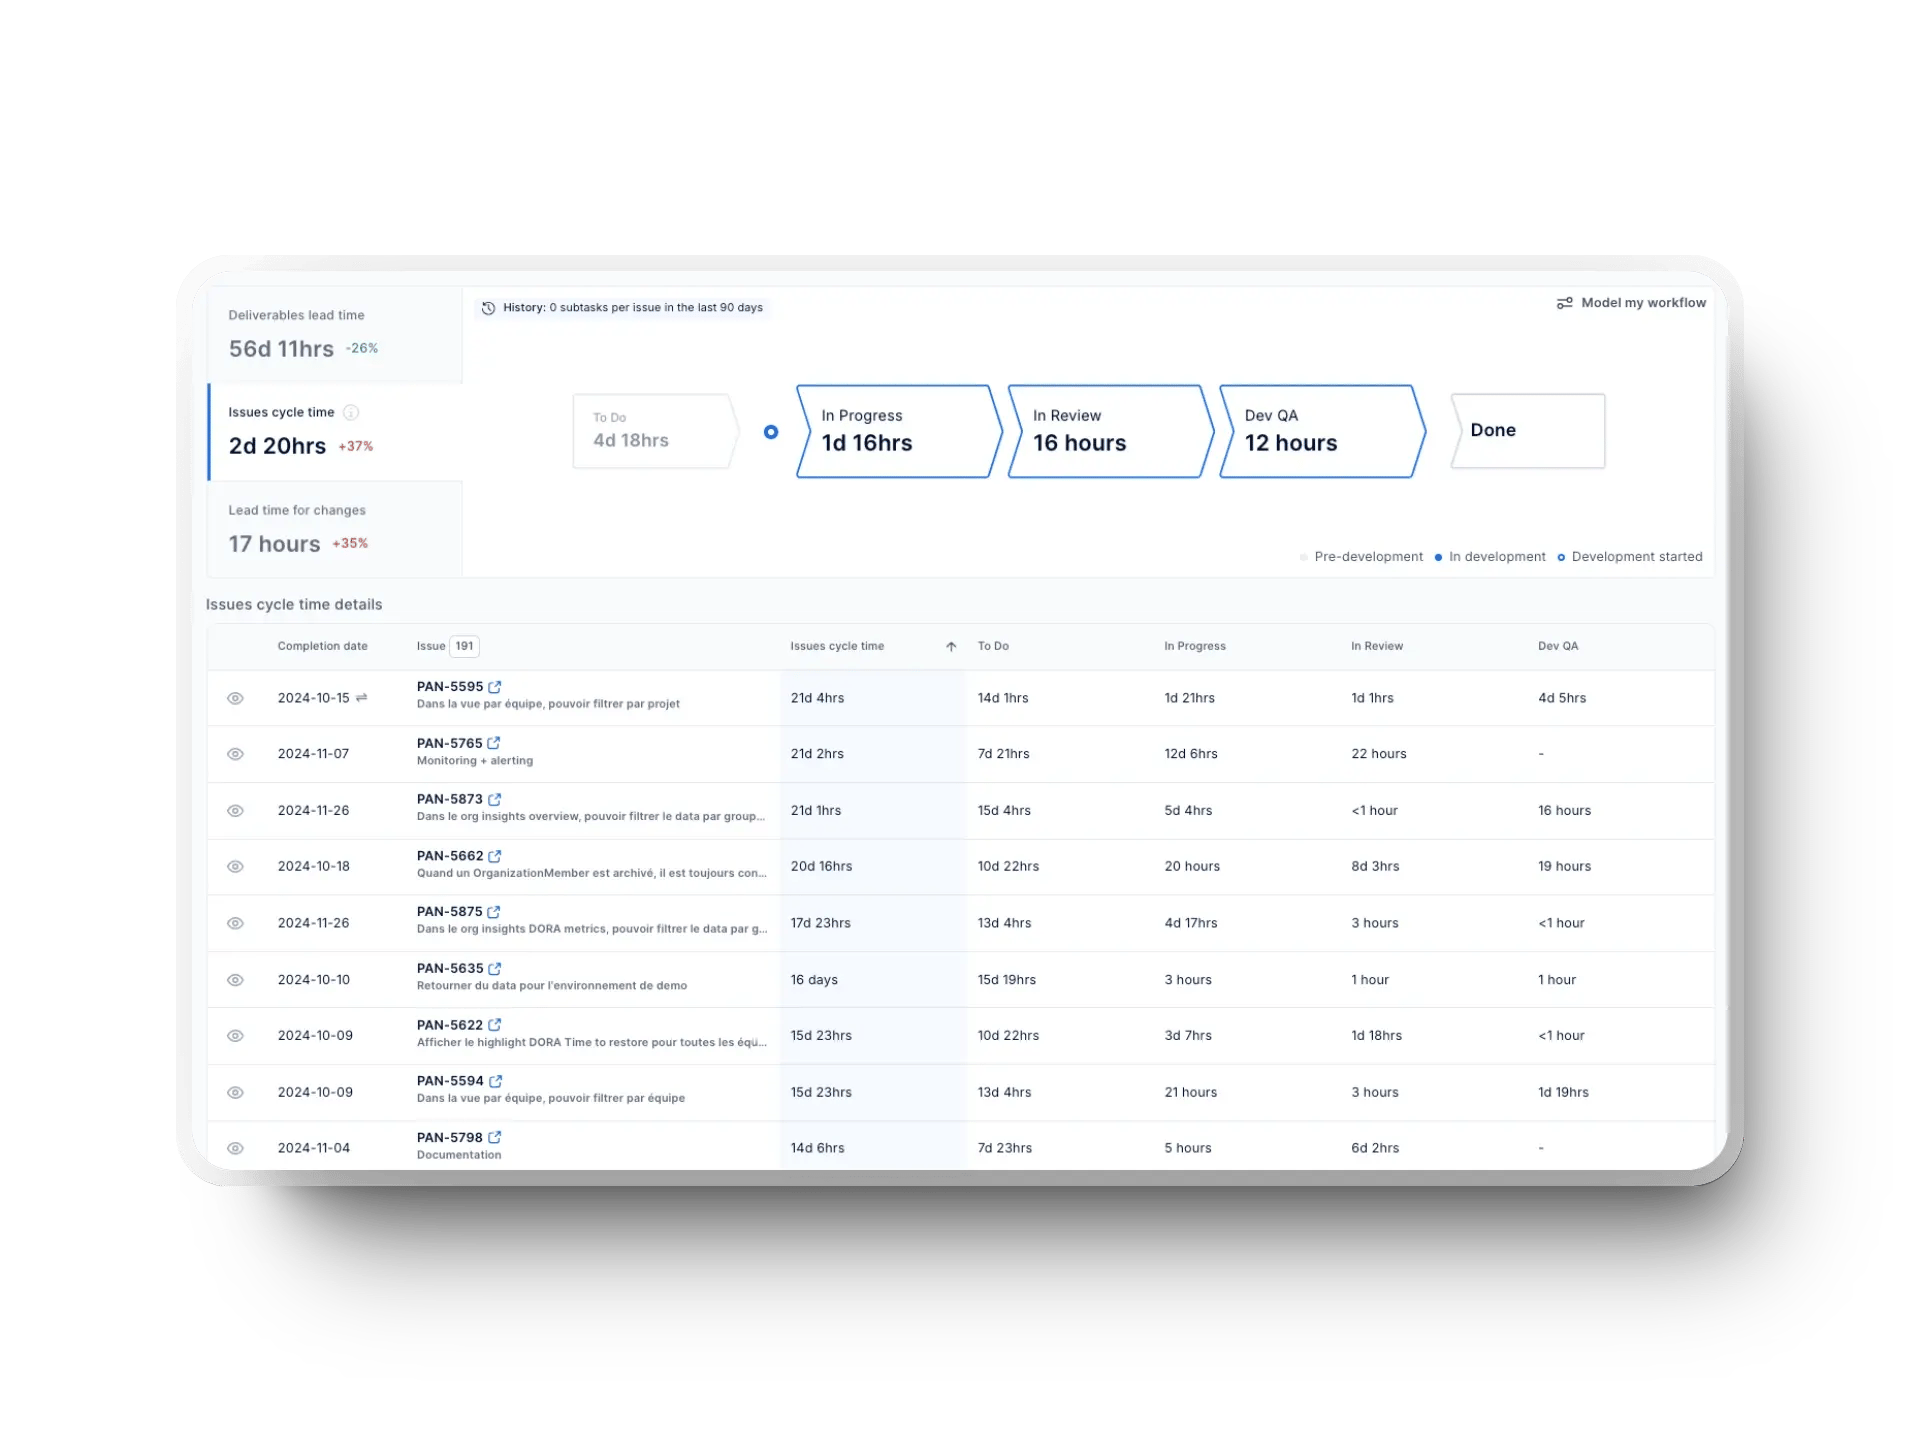
Axify is a tool that enables you to gather data from the tools you already use, making it easy to view your flow metrics and, of course, DORA metrics.
The value stream view highlights where work slows down—whether that’s in code review, testing, or deployment—so you can tackle bottlenecks directly.
Meanwhile, the software delivery forecast uses historical trends to project when work will be delivered, giving your team the confidence to commit and plan ahead. Here’s how easy it is to see all this info:
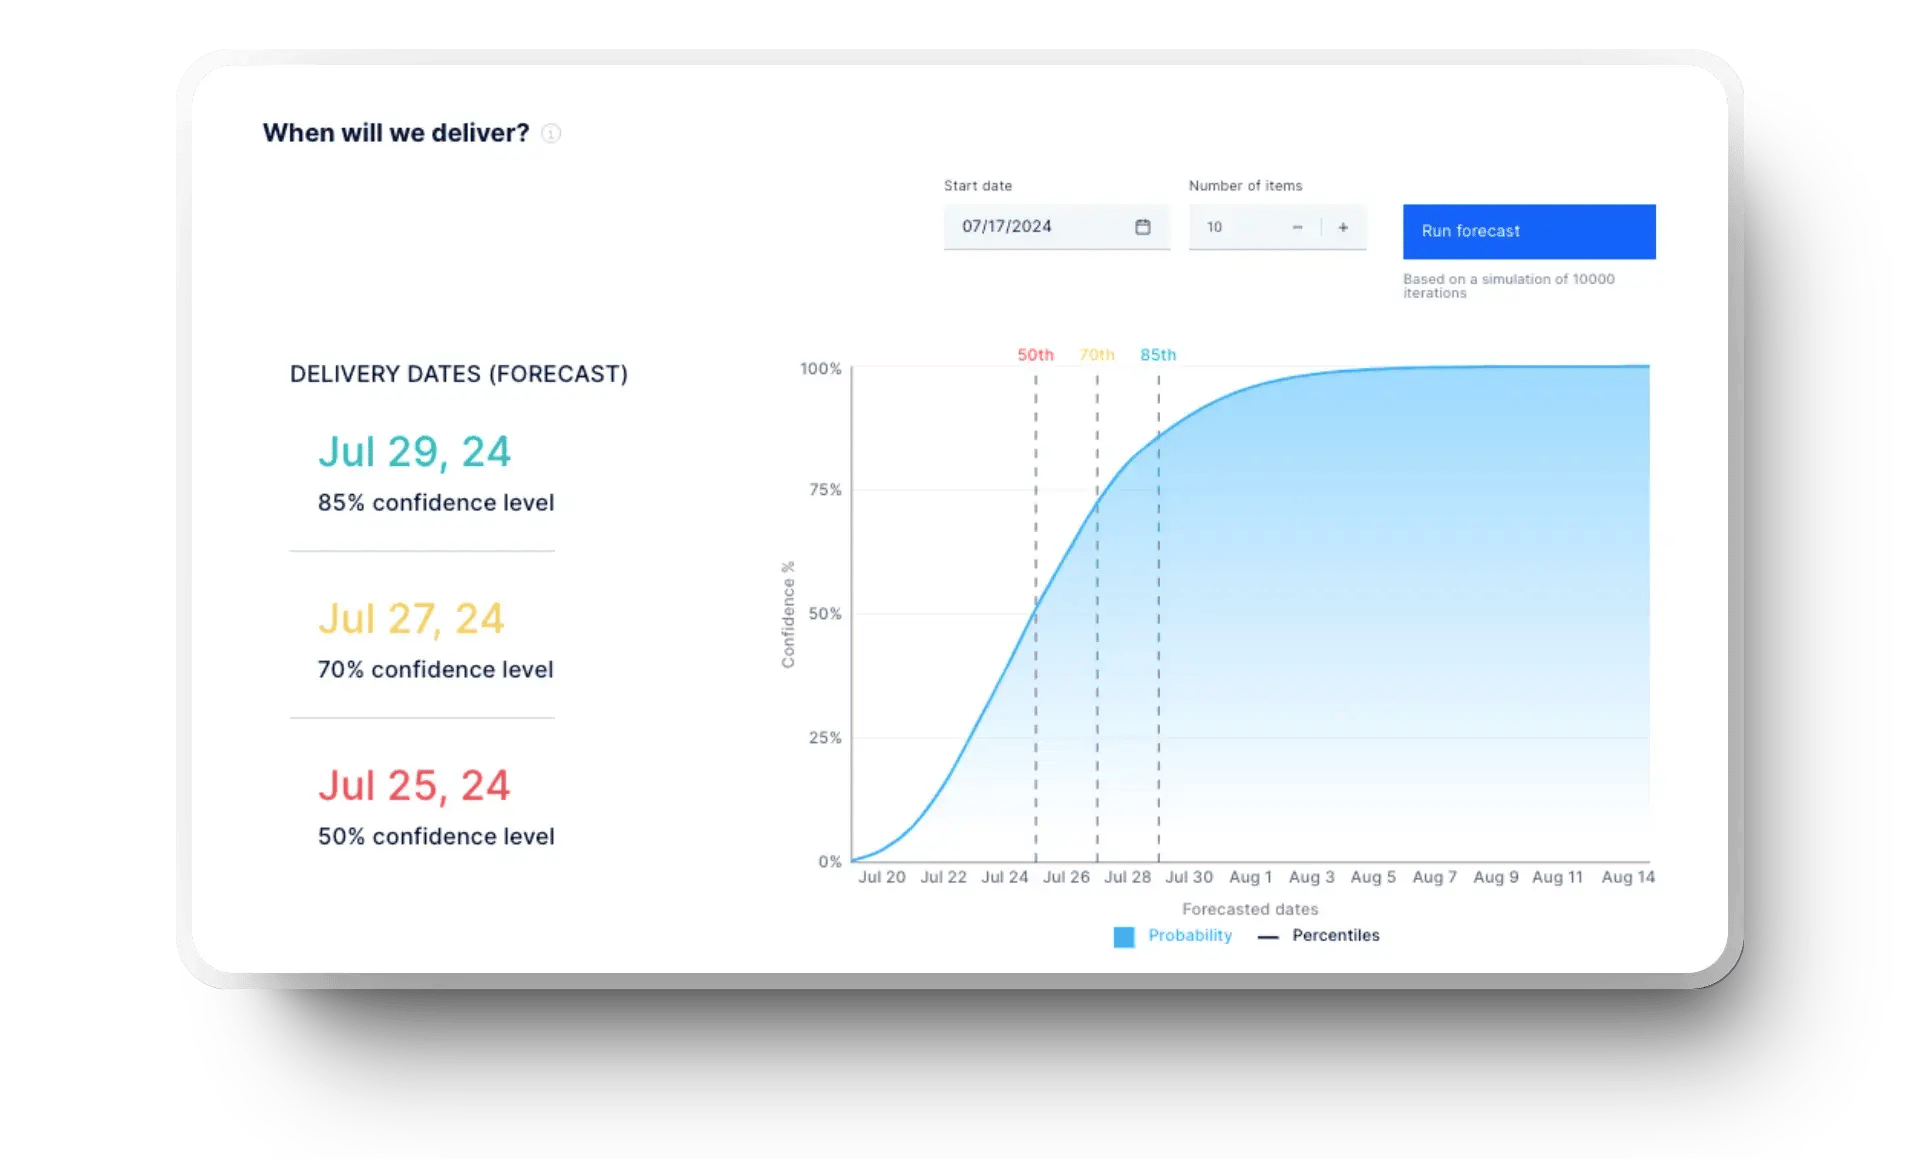
You can also create goals from your data and track their progress over time to see your team's continuous improvement.
![]()
But Axify isn’t just a tool.
Our expert team also helps you turn insights into action.
Through hands-on coaching, we guide your teams in applying continuous improvement practices that stick—just like we did for two teams at the Development Bank of Canada (BDC). By partnering with Axify, these two BDC development teams achieved a 2X faster delivery time, reduced time spent on bugs and quality control, and unlocked $700K in annual productivity gains.
We helped them implement continuous improvement measures like shifting QA earlier in the development cycle, breaking down large features into smaller, testable user stories, and setting clear work-in-progress (WIP) limits to avoid overload.
We also introduced Value Stream Mapping workshops to visualize their end-to-end delivery flow and highlight friction points. And by developing internal champions through a train-the-trainer model, BDC was able to scale these improvements across more teams—ensuring the gains weren’t just a one-off, but part of a sustainable delivery culture.
With Axify, you don’t just measure improvement—you implement it.
For more information on how Axify helps development teams measure DORA KPIs, start your free trial or request a demo.
