AI
17 minutes reading time


You may be paying for AI coding tools already. But only a few teams can prove they are really working beyond activation, usage, or developer feedback.
Unfortunately, AI coding tools don’t track how productive they make your team, and faster code generation does not always mean faster delivery. A tool can reduce coding time while increasing review time, rework, or QA effort.
This article gives you a practical way to measure AI coding tools’ impact across reactive assistants like GitHub Copilot and autonomous agents like Cursor and Claude Code. You will see which signals to track and how to connect adoption, quality metrics, delivery flow, and cost to renewal, rollout, training, and workflow-fix decisions.
P.S. Try Axify to compare AI usage with cycle time, review duration, throughput, rework rate, and more essential engineering metrics. Axify AI Adoption and Impact gives you this view by team, project, and tool, but there are more features you can explore.
AI coding assistants help developers write code faster inside their existing workflow. They suggest completions, snippets, explanations, or changes, while the developer stays in control of the task. GitHub Copilot is the clearest example.
AI coding agents take on a larger unit of work. They can plan steps, edit multiple files, run checks, fix errors, and prepare a pull request. With tools such as Claude Code, OpenHands, Devin, and agentic workflows inside Cursor or Copilot, developers are delegating part of the task and reviewing the result.
That means assistants and agents need different measurement signals.
| Tool type | Scope of autonomy | Typical task | Primary measurement signal |
| Assistant | Developer-led | Code suggestion, snippet, explanation, autocomplete | Acceptance rate, active usage, edits after acceptance |
| Agent | Delegated, multi-step | Multi-file task, ticket work, test-and-fix loop, PR preparation | Task completion, mergeability, review duration, rework, resolution time |
AI coding tools fall short when you measure the number of licenses instead of workflow impact. That matters because adoption, delivery speed, review load, and rework can show different trends.
These are the issues that usually create the gap:
So the next step is to separate real adoption from surface-level activity.
To measure AI coding tool adoption, you need to consider people’s behaviors instead of their mere access. A paid license only tells you who can use the tool, while behavior tells you whether your team actually uses AI in their delivery workflow.
DORA’s three adoption dimensions give you a useful structure here:
These three signals need to be read together. Axify AI Adoption and Impact supports that model by showing active users versus licensed users, tool usage by team or project, and acceptance rate.
That gives you a clearer view of AI adoption across the software development lifecycle, instead of treating license access as proof of existing value.

Once adoption is clear, the next question is what changed in delivery.
AI impact measurement starts with one rule: compare AI-assisted work against the same work without AI assistance. Same team, same task type, same review path, and same time window.
That structure follows our AI impact measurement framework. You need to measure flow, cost, risk, and decision quality together.
DORA’s 2026 ROI report makes the same point. AI can raise code output, but a higher output in coding can also increase review load, verification work, and delivery instability.
So the question is not whether your team writes more code. The question is whether work moves through the system with less delay and no added risk.
Cycle time shows whether AI shortens the path from ticket start to deployment. This is the main workflow signal because it includes the parts that coding tools do not control directly, such as review, QA, CI checks, and deployment. Cycle time also includes idle time.
The correct approach is to compare AI-assisted tickets and non-assisted tickets in the same task category over the same review period. A mistake would be to compare all AI users against all non-users.
AI users may be concentrated in teams with cleaner codebases, better test coverage, or stronger delivery habits. If those teams have shorter cycle time, you may be measuring team maturity rather than AI impact.
Throughput delta before and after AI adoption shows whether you actually complete more work with AI. PR volume delta shows whether more or less work is entering review.
These two metrics need to be interpreted together. If AI increases PR volume but throughput stays flat, your AI-powered coding workflow may be creating more review inventory instead of more completed work.
In that case, the next decision is to inspect PR size, reviewer load, and queue time.
Rework delta before-and-after AI adoption shows whether AI-assisted code needs more correction after review, QA, or deployment. So, we recommend tracking reopened tickets, repeated review cycles, bug-linked work items, and follow-up fixes.
We don’t advise you to track rework rate deltas for each individual. A single developer does not control task scope, review depth, CI rules, release timing, or production feedback. So the metric is better used at the team, project, or service level.
Time-to-first-commit matters most if you’ve implemented AI coding agents like Claude Code or Cursor. Checking a difference in time-to-first-commits before and after AI adoption tells you whether your AI tools reduce the early delay between ticket pickup and the first meaningful code change.
But this metric is only useful if you connect it to metrics in the later stages of the SDLC. Faster first commits don’t matter that much if review time or rework increases.
Ticket resolution time is the best agent-level outcome metric to track because agents can work across several steps. You need to compare agent-supported bug fixes or maintenance tasks against similar manual tickets.
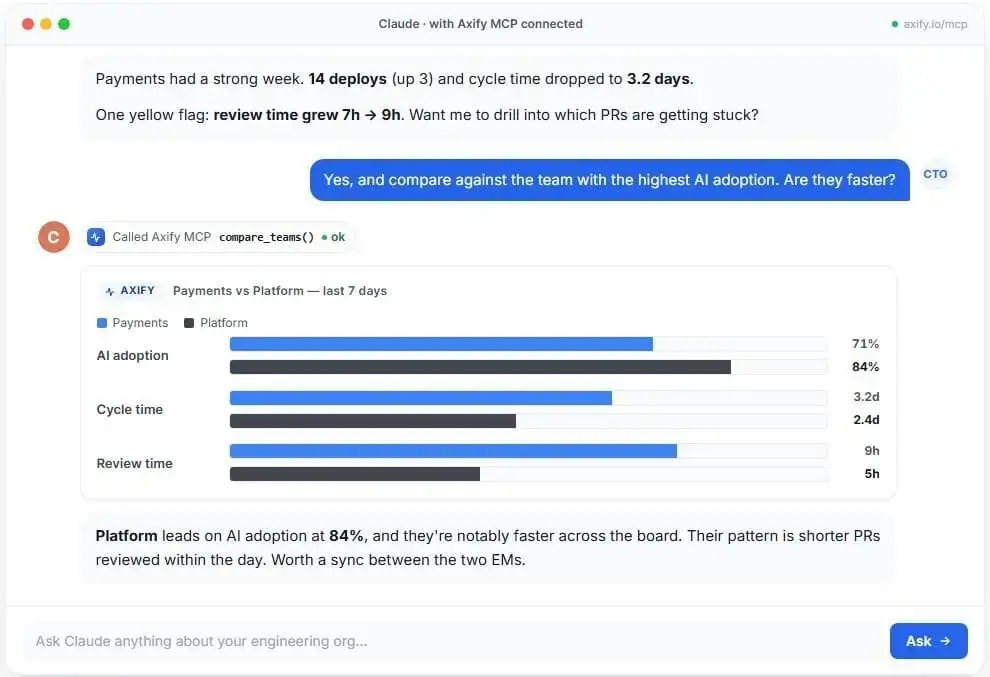
Axify AI Adoption and Impact helps you connect usage, acceptance, team, project, and delivery movement in one view. And with Axify MCP, leaders can ask compound questions from Claude, such as:

That helps you measure software developer productivity really well because you’re a) tracking only the essential metrics for each project and b) you’re analyzing those metrics in the right context according to your actual workflow and team assignments.
Now, let’s see how you connect AI coding tools’ impact to their cost and ROI.
Calculating ROI for AI coding tools starts with a simple formula:
ROI (%) = ((Value − Investment) / Investment) × 100
But the hard part is not the formula. It’s deciding what counts as value and what counts as investment. Seat cost is easy to calculate. Proving whether AI changed completed work, review load, rework, deployment stability, and cost per useful outcome is harder.
| Cost per useful outcome: The total AI tool cost, review effort, QA effort, and rework cost required to produce completed work that passes review, clears validation, and reaches deployment. |
Before you calculate ROI, establish your “before” state. Track metrics such as cycle time, lead time for changes, deployment frequency, review time, rework, change failure rate, and failed deployment recovery time before AI adoption.
You need this step because AI impact is hard to prove without a baseline. If engineering time improves after rollout, you need to know whether that change came from AI, smaller work items, better CI/CD, team changes, or another process improvement.
Next, estimate where AI creates measurable value. The most defensible starting points are the value drivers closely related to engineering work: reclaimed engineering capacity, extra completed features, and downtime avoided.
Pro tip: Check out our guide on how AI is saving developer time to learn more about this.
DORA’s 2026 model discusses productivity, developer experience, user experience, cost efficiency, and business growth as value categories.
But for a practical first ROI case, start with completed delivery outcomes.
For example, compare AI-assisted bug fixes and non-assisted bug fixes over the same quarter, then review cycle time, rework, deployment outcomes, and effort saved.
Remember: Don’t calculate ROI from cost per line of code or cost per PR. More code or more PRs can look productive while increasing review queues, QA effort, and long-term maintenance.
AI-assisted work can create value, but those gains are not automatically net gains. You need to subtract the work AI adds back into the system through review, validation, rework, failed deployments, and recovery.
For example, DORA’s sample calculator uses 12.5% net time saved per developer, but it also models a 15% J-curve productivity drop over three months and a change failure rate increasing from 5% to 6%. That’s the right kind of caution: count reclaimed capacity only after you account for the verification tax and any instability AI introduces.

So, treat reclaimed capacity as net capacity. The question is not “How much faster did developers generate code?” It’s “How much usable capacity did the team recover after review, rework, and delivery risk?”
License cost is only the visible part of AI spend. Your investment should include AI coding tool:
The DORA 2026 report separates direct hard costs from J-curve costs.
DORA’s sample calculator makes this clear.
In its example, first-year AI investment totals $8.365 million. Only part of that comes from direct hard costs such as licenses, usage fees, infrastructure, and training. A large share, $3.3 million, comes from the J-curve cost: the temporary productivity dip caused by learning, workflow changes, and extra verification work.

So an ROI model that only counts license spend will understate the real cost of adoption.
Once you have value and investment, calculate ROI:
ROI (%) = ((Value − Investment) / Investment) × 100
Then calculate payback period:
Payback period = Investment / Annual return
This shows how long it takes to recover the cost of AI adoption. A team may show positive long-term ROI even if the first few months look noisy because training, validation, and workflow changes create upfront cost.
Remember: Use conservative assumptions first. For example, calculate ROI from reduced cycle time, avoided hiring capacity, or downtime avoided before you add harder-to-prove revenue impact from faster feature delivery.
AI ROI is not a one-time spreadsheet. It can improve or deteriorate as adoption grows.
Keep the review operational. Track cycle time, throughput, review duration, rework, change failure rate, failed deployment recovery time, and cost per completed task every month.
If delivery metrics show faster movement with stable quality, you have a stronger renewal case. If AI adoption rises while review time, vulnerabilities, rollbacks, or rework also rise, pause the rollout, fix the workflow, or narrow usage to lower-risk task types before adding more tools.
To compare AI coding tools, you need the same team, same task category, same review period, and different tooling.
Vendor case studies and software engineering benchmarks can help you understand common use cases, but they cannot prove impact inside your workflow.
Your teams have different code ownership, review rules, CI checks, release gates, and legacy constraints. So the comparison has to start with your delivery data.
The correct approach is to compare similar work under similar conditions. For example, we recommend you to:
A mistake would be to compare one tool across all teams, all repositories, and all task types. That comparison can’t yield the right insights because one team may work on small product changes while another handles platform incidents.
In this case, the tool is no longer the only meaningful difference between the two teams’ workflows.
Cost per PR can look clean in a spreadsheet, but it is usually too narrow. A cheaper tool can produce more PRs and still create more review work. A more expensive tool can be worth keeping if it shortens cycle time for complex maintenance tasks without increasing rework.
So, the better comparison is cost per useful outcome.
That means completed work that passes review, clears QA, reaches deployment, and does not create follow-up correction work. This gives finance a cost view and gives engineering a workflow view.
AI tools don’t improve every stage of delivery equally. One tool may shorten coding time, while another may help with ticket resolution or multi-file changes.
That’s why you need to compare stage-level metrics, like so:

This helps you see potential issues, such as:
The point is to see whether your AI coding tools can improve the full delivery path.
Axify MCP can make those comparisons easier to query. If your delivery and AI usage data are connected to Axify, leaders can ask an MCP-compatible AI client, such as Claude:
| “Compare Copilot-heavy teams with Claude Code-heavy teams over the last month. Show coding time, PR review duration, rework, deployment frequency, and cost per completed task.” |
The AI client can call Axify’s MCP server, retrieve live permission-scoped data, and return an answer you can use in a renewal, rollout, or training decision.
That comparison only works if you avoid the common measurement traps.
Most measurement mistakes start when teams don’t treat AI adoption as a meaningful workflow change. That leads to mistakes like these:
Axify helps reduce these mistakes by connecting AI usage with delivery, review, and rework data, so you can review impact by team, project, and tool.
The way forward is to make AI impact measurement continuous.
You should check the impact of AI on software development consistently in your company and teams; make it a repeatable review process.
These are the steps we recommend using:
Start by connecting AI tools usage data with tickets, PRs, reviews, CI checks, deployments, and rework. Without that connection, you can see activity but not delivery impact.
Set a baseline for cycle time, throughput, review duration, and rework before you evaluate AI. This gives you a clean comparison point when teams start using assistants or agents.
Break the data down by team, project type, and tool. For example, a team using Cursor for multi-file refactoring should not be compared with a team using GitHub Copilot for boilerplate-heavy feature work. The task type, codebase complexity, and review path are different, so the comparison won’t isolate AI impact.
A monthly review cadence gives teams enough time to show real patterns. We recommend reviewing adoption, acceptance rate, cycle time, throughput, review load, and rework together. The Axify AI adoption and Impact feature can help you here.
Early adopters can show where AI fits the workflow. Review their prompts, task types, PR size, and validation habits before you roll those patterns across more teams.
Once the data is connected, Axify MCP lets leaders ask Claude questions through natural-language prompts. For example:
Claude calls Axify, uses live permission-scoped data, and returns an answer without manual dashboard checks. That helps you use AI capabilities in weekly reviews, retro prep, board updates, and follow-up analysis.
Measurement should lead to action. Once you see how AI affects cycle time, review load, rework, or deployment stability, use Axify Intelligence to understand what those patterns mean and what to change next.
You can query the engineering intelligence assistant about the specific insights it reveals and its recommendations. For example, ask it why AI-assisted work is creating longer review queues or which teams need tighter PR size rules.
Then, you can implement the recommended changes that fit your situation best directly from the Axify chatbot.
Which AI Coding Tool Delivers Better ROI? Which AI Coding Tool Delivers Better ROI? 
No AI coding tool wins across every engineering environment. The better choice depends on your stack, task mix, codebase maturity, review process, and cost model.
Code assistants tend to fit boilerplate-heavy work, simple fixes, test suggestions, and faster in-editor support. Agentic tools tend to fit well-scoped tickets, multi-file changes, refactoring, and codebase investigation.
But the tool that feels faster is not always the tool with better ROI. So, you should compare cost, adoption, completed work, review time, rework, QA impact, and deployment flow before expanding usage.
Related guide: If you are comparing tools side by side, read our GitHub Copilot vs. Cursor guideConclusion: Turn AI Coding Tool Usage Into Measurable Delivery Impact
AI coding tools should improve how work moves through your delivery system. To measure that improvement means connecting usage, acceptance, and sentiment to cycle time, PR review duration, throughput, rework, deployment stability, and cost per completed task.
The real advantage comes from turning AI adoption into an operating loop: measure where AI changes delivery, explain whether that change helps or hurts, then adjust the workflow before friction spreads.
Teams that do this will make better tool decisions, protect quality, and capture AI gains that survive beyond the first rollout.
Book a demo with Axify to measure AI impact with live delivery data and turn those insights into better rollout, renewal, and workflow decisions.
