AI
15 minutes reading time


AI is changing how work moves through DevOps, but tools alone do not shift delivery outcomes. What matters is where these tools intervene in your DevOps pipelines, and whether those interventions shorten review queues, reduce deployment delays, or stabilize incident recovery.
This guide focuses on the top AI tools for DevOps in 2026 and the metrics that reveal whether they actually improve performance. You'll find concrete use cases, measurable impact, and validation methods.
In the end, you'll know what tool to use next and where to apply it best.
Let’s begin.
AI tools for DevOps are systems that apply artificial intelligence and machine learning at specific points in your software delivery lifecycle to influence how work moves. Their purpose is narrow and practical. They assist with code-level decisions, reduce manual handoffs, and expose signals you can validate through delivery and stability metrics.
However, according to the 2025 DORA Report, 90% of software professionals use AI tools at work, with 8% reporting a great deal of reliance. That gap pushes you to separate usage from impact before scaling.

You can check out this short video to learn how AI impacts the future of DevOps:
Next, let's see the practical use cases.
AI can help teams if it can change how work flows through the pipeline. In practice, that means specific interventions at known friction points. So, these are the core use cases where AI DevOps tools tend to show measurable effects, and where validation is possible.
Remember: We believe that AI typically amplifies existing strengths and weaknesses rather than correcting them by itself. As such, the benefits below are noticed in mature teams with effective workflows.
Code assistance and review sit early in the software development lifecycle, where delays compound quickly. AI enters this stage to ideally reduce waiting time and limit avoidable rework before changes move downstream. These are the main applications you see in practice:
You can automate work that follows the same path repeatedly. AI may reduce manual handling while keeping decision boundaries clear. These are the common patterns:
Monitoring is about signal quality and not volume. AI focuses on narrowing attention to what affects delivery and stability. You can use:
CI/CD optimization targets the time lost while changes wait to move forward. Here, AI is applied sparingly to avoid masking bottlenecks. Teams also use it for:
With that context, let's go over the top 10 AI tools for DevOps.
The best AI tools for DevOps include Axify, GitHub Copilot, Tabnine, Snyk Code, and others that affect delivery flow and risk. Each tool targets a different constraint, from AI-powered IDE support to system-level engineering performance tracking.
These are the tools that you should evaluate today.
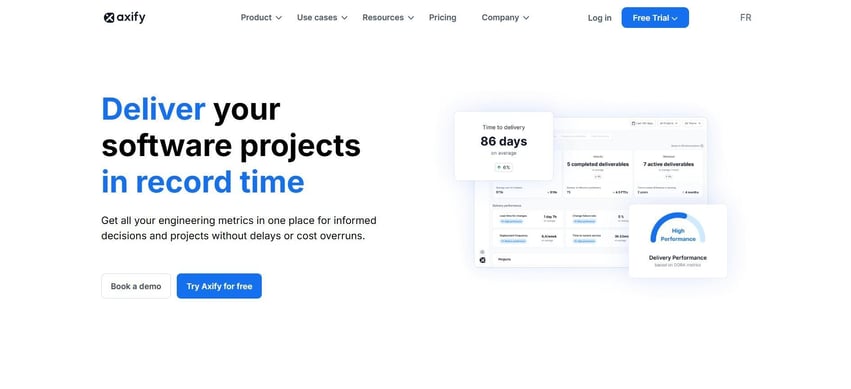
Axify gives you a way to evaluate how AI usage impacts actual delivery outcomes. Instead of assuming AI always helps, you measure your performance before and after AI implementation to see its actual effects.
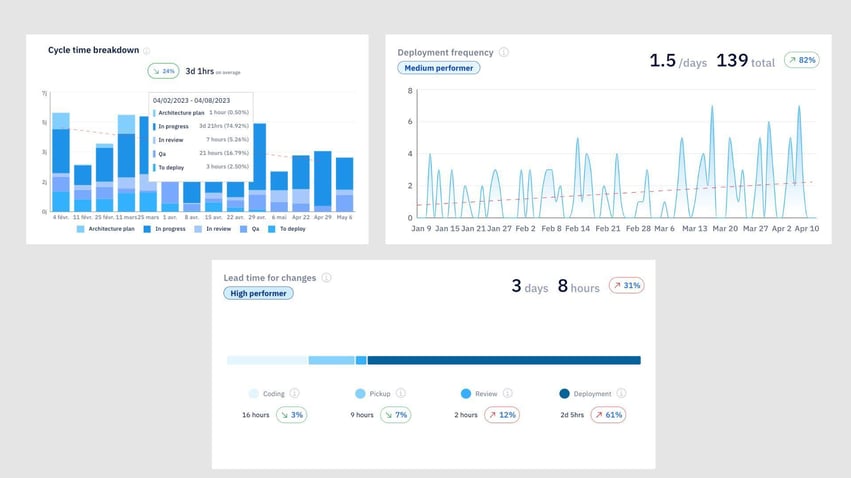
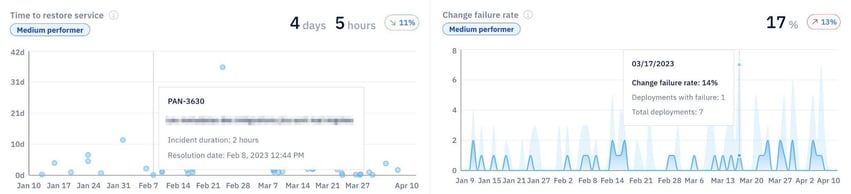
Axify can compare delivery time, cycle time, review speed, DORA metrics, and adoption signals before and after AI, so changes stay visible across the full workflow.
This matters once tools like AI coding agents enter daily work, because they can shift bottlenecks rather than remove them.
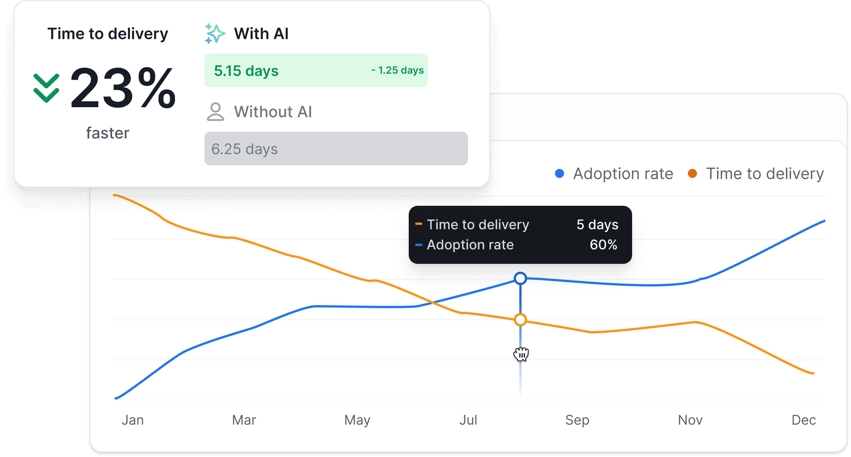
Axify’s AI Performance Comparison feature shows you exactly how your delivery changes as AI adoption rises. Here's how that looks:
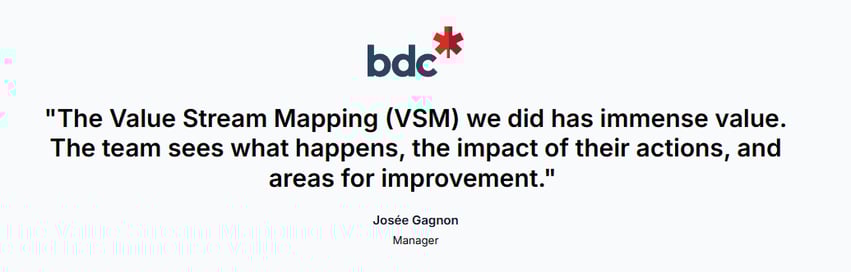
Besides, Axify’s Value Stream Mapping tool identifies bottlenecks that AI can potentially address, as well as SDLC phases where AI implementation can make the most sense.
We encourage all our clients to start by understanding their current performance levels, the goals they want to reach, and the bottlenecks that hinder those goals.
For example, we worked with two teams at the Development Bank of Canada, who used Axify to diagnose where work stalled. As a result, delivery became up to 2X faster, pre-development time dropped by 74%, and QA time fell by 81%. Also, capacity increased by 24%, which translated into roughly $700,000 in annual productivity gains within three months.
Those outcomes tie directly to continuous inspection and data standardization. Use our metrics, AI performance comparison and VSM to make scaling decisions defensible from both engineering and cost & optimization perspectives.
Pros:
Cons:
Pricing: Free option available. Paid plans are now modular, with each module priced at $19 per month. The bundle package is $32/ contributor/ month.
GitHub Copilot works as an AI assistant inside your IDE, where it suggests code based on the files and context already open. The tool focuses on accelerating routine coding and development tasks, such as scaffolding functions, writing configuration snippets, or drafting test code.
In practice, it affects how quickly code changes move from idea to first implementation rather than how they perform after review or release. That distinction shows up in large enterprise usage. Accenture reports that many thousands of developers rely on Copilot, with most saying coding feels more engaging and a large share using it daily.
That level of adoption signals habit formation, but it does not explain whether downstream review time, defect rates, or rework shift as a result.
Pros:
Cons:
Pricing: A free option is available, but the pro plan starts at $10 per month.
Tabnine focuses on AI-assisted coding in environments where code must stay inside your infrastructure. It runs as an AI code assistant inside common IDEs and supports on-premises or private deployments, which matters when data control affects software development decisions.
The tool offers code completion and suggestion quality. That scope makes it relevant when policy or compliance limits external services, but it leaves validation of downstream impact outside the tool.
Pros:
Cons:
Pricing: It starts at about $59 per user per month (paid annually).
Snyk Code provides static analysis that runs early in the software lifecycle, where security gaps are cheaper to address. It applies machine learning to scan source code and suggest fixes inside developer workflows to keep checks close to where changes are made.
In one case study, Flo Health integrated Snyk across a large set of repositories and containers. This shifted remediation from long backlogs to near-immediate action and increased the share of commits passing security scans without delaying software releases.
Pros:
Cons:
Pricing: A free option is available, but the team plan starts at $25 per developer per month.
PagerDuty AIOps sits in the incident response layer, where alert volume slows decisions and increases handoffs. Its system groups related signals, suppresses duplicates, and routes incidents based on prior context to reduce manual triage.
The outcome you evaluate is whether response focus improves without hiding real issues. Then you assess whether AI-driven insights shorten time to action instead of reshuffling alerts.
IAG Loyalty applied PagerDuty AIOps to reduce alert noise across teams. The change surfaced context from past incidents, sped up resolution, and reduced time spent on manual sorting. This supported a measurable reduction of manual work during on-call periods.
Pros:
Cons:
Pricing: The AIOps add-on starts around $799 per month.
Datadog AIOps applies machine learning to telemetry to surface anomalies before they escalate. The focus stays on patterns across metrics, traces, and logs, with correlations that point to likely sources of failure. This setup matters when early signals affect resource scaling decisions or expose risk tied to cloud spend rather than isolated alerts.
In practice, Compass expanded its use of Datadog monitoring to shorten recovery for severe incidents. Resolution shifted from hours to minutes, which changed how teams staffed on-call work and prioritized fixes for each software engineer involved.
Pros:
Cons:
Pricing: A free option is available, but infrastructure monitoring starts at about $15 per host per month.
Dynatrace Davis AI identifies root causes across complex systems without manual correlation. The platform analyzes dependencies across services and infrastructure to open a single problem record with causal context.
This approach affects how incidents are handled during release orchestration and how teams decide what to fix first inside AI-powered pipelines.
BMO adopted Dynatrace to support a digital-first operating model. Teams reduced the time spent finding root causes, lowered manual log analysis effort, and redirected time from ad-hoc problem remediation to planned work aligned with Agile practices.
Pros:
Cons:
Pricing: Infrastructure monitoring is $29 per host per month.
Harness AI focuses on how work moves through CI/CD once code is ready to be validated and released. The platform applies machine learning to test selection and deployment verification, so pipeline decisions depend on the change context rather than static rules.
That approach affects testing prep and how release risk is evaluated before changes reach users. The scope stays inside the Harness platform, which means AI acts on pipeline data already under its control.
At Citi, Harness was used to restructure delivery across a large engineering organization. Release execution shifted from long, staged rollouts to rapid, automated paths aligned with defined acceptance criteria, while keeping control points in place.
Pros:
Cons:
Pricing: A free option is available, but you need to contact sales for the paid plans.
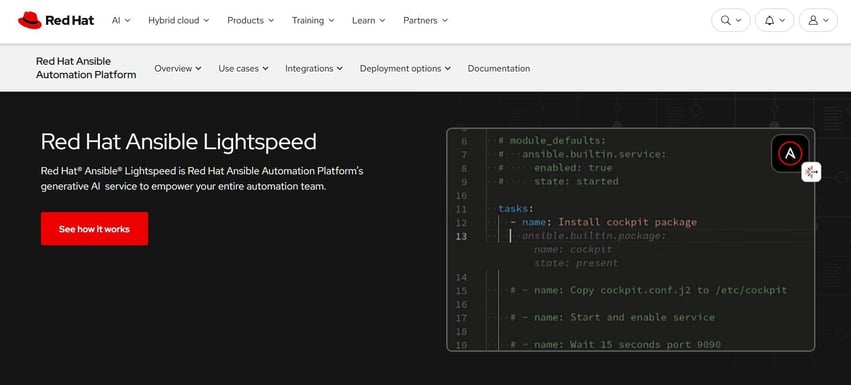
Ansible Lightspeed applies generative AI to infrastructure automation. It focuses on how playbooks are written rather than how systems behave at runtime. The tool translates intent into Ansible syntax through dynamic prompts, which changes how automation code is created and reviewed.
That makes it relevant when standardization and speed matter more than deep delivery analysis. The scope stays limited to Ansible content, so the impact depends on how widely automation is already used.
Pros:
Cons:
Pricing: Custom quote.
CircleCI AI reduces friction in build and test pipelines. The system assists with pipeline configuration, test distribution, and failure analysis based on historical execution data.
That changes how quickly feedback reaches engineers and how reliably pipelines behave under parallel load. The effect depends on data quality and how consistently pipelines run.
At Maze, CircleCI supported a shift from infrequent releases to rapid, repeatable delivery. Lead time dropped sharply as pipelines became more predictable and less constrained by slow tests.
Pros:
Cons:
Pricing: A free option is available, but the performance plan starts at $15 per month.
When using AI tools for DevOps engineers, you need to measure delivery, stability, efficiency, and adoption metrics. These categories tell you whether AI changes flow, reduces risk, or simply shifts effort.
These are the metrics that matter most.
Delivery metrics show whether work moves faster without creating downstream friction. These are the signals to track:
Stability metrics confirm whether speed holds under failure conditions. So, these indicators prevent false confidence:
Efficiency metrics surface where time is lost inside the workflow. You should track:
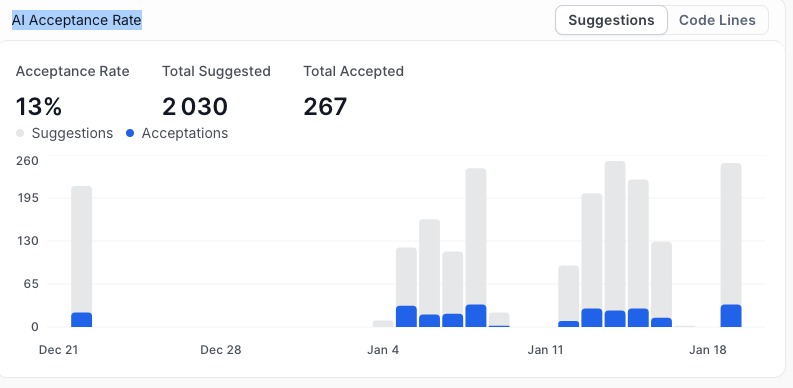
Adoption metrics separate usage from impact. Here are the metrics you can track:
Pro tip: Axify visualizes this through its AI Acceptance Rate dashboard, which shows total suggestions versus accepted changes over time.
AI works when it fits cleanly into how delivery already operates. The goal here is controlled change, clear validation, and fast rollback if results move the wrong way.
So, here are the DevOps best practices that consistently hold up in production environments:
AI tools change specific parts of the delivery pipeline, but only measured outcomes justify wider use. What matters is whether review queues shorten, deployments move sooner, incidents recover faster, and noise drops without hiding risk.
So decisions stay grounded in evidence rather than tool claims. When adoption is paced, validated, and compared side by side, scaling becomes a controlled step rather than a leap of faith.
To verify impact before expanding usage, contact Axify and evaluate results across teams with clear, comparable data.
