Software Development
11 minutes reading time


You’re constantly under pressure to deliver results on time, on budget, and with clear proof of impact. But most of what your teams track doesn’t help you do that. It buries you in noise. If you’ve ever looked through dashboards full of commit counts and code churn, you know what that feels like. You need clarity, not clutter.
What actually moves the needle are a few key performance indicators that show how efficiently your teams deliver and whether your investments are paying off. This article explains which metrics to track for smarter resource allocation and better project success.
But before we jump into which metrics you should use, let's start with the basics.
Software delivery KPIs help you measure how well your teams turn ideas into real business value throughout the software delivery process. You're not just tracking closed tickets or counting lines of code. You're looking at delivery efficiency as a whole to spot bottlenecks, reduce delays, and align your team’s efforts with your business goals.
These KPIs matter at the executive level because they give you control and visibility. Here's what you get when you track them:
When you connect your software development KPIs to your strategic objectives, you stop guessing and start acting with purpose. These KPIs give you valuable insights that help you ship smarter, not harder.
All of this takes us to the next point...
If you’re leading software delivery, your job isn’t just to monitor how fast one developer closes tickets. You’re here to make informed decisions that move the entire organization forward.
That’s why team-level software delivery metrics should focus on outcomes, not individual output. Process-focused metrics such as PR review time or commit size can be helpful to dev teams, but they don’t tell you much about whether you’re reaching your business objectives.
What you need are outcome-driven KPIs that show patterns over a period of time—things such as cycle time or deployment frequency. These KPIs show you how efficiently your software development team turns ideas into real, usable value.
Focusing on delivery trends across systems instead of individuals will uncover the bottlenecks that truly slow things down. You’ll steer your teams with data-driven insights instead of gut feelings and align delivery with what matters to the business.
Now let’s walk you through the specific KPIs that can guide your decision-making.
Every software developer needs clear KPIs to align their team's work with the goal of efficiently meeting customer expectations. As a delivery manager or executive, you need to focus on the signals that show whether your teams are building the right things, at the right speed, with the right effort.
Here are the key software delivery KPIs that give you that clarity and help you make stronger business decisions.
You need to know where your engineering time goes. Issue Type Time Investment tracks how much effort your teams spend on new features, fixing bugs, resolving technical debt, and managing unplanned work.
As a side note, in a discussion on Software Engineering Stack Exchange, a user noted that in their experience, approximately 40% to 60% of development time is spent on maintenance activities, which include bug fixing. That’s a massive chunk of your investment for non-innovation or value-adding tasks.
Luckily, this key metric gives you a real breakdown of time investment across different issue types. Look at its trends to justify budgets, shape your roadmap, and shift focus if too much time is sunk into firefighting. You’ll also spot whether your innovation efforts are drained by lingering maintenance.
It’s a direct way for business stakeholders to link engineering time with strategic priorities and make the most of every sprint. It’s one of the essential metrics for aligning teams with business objectives.

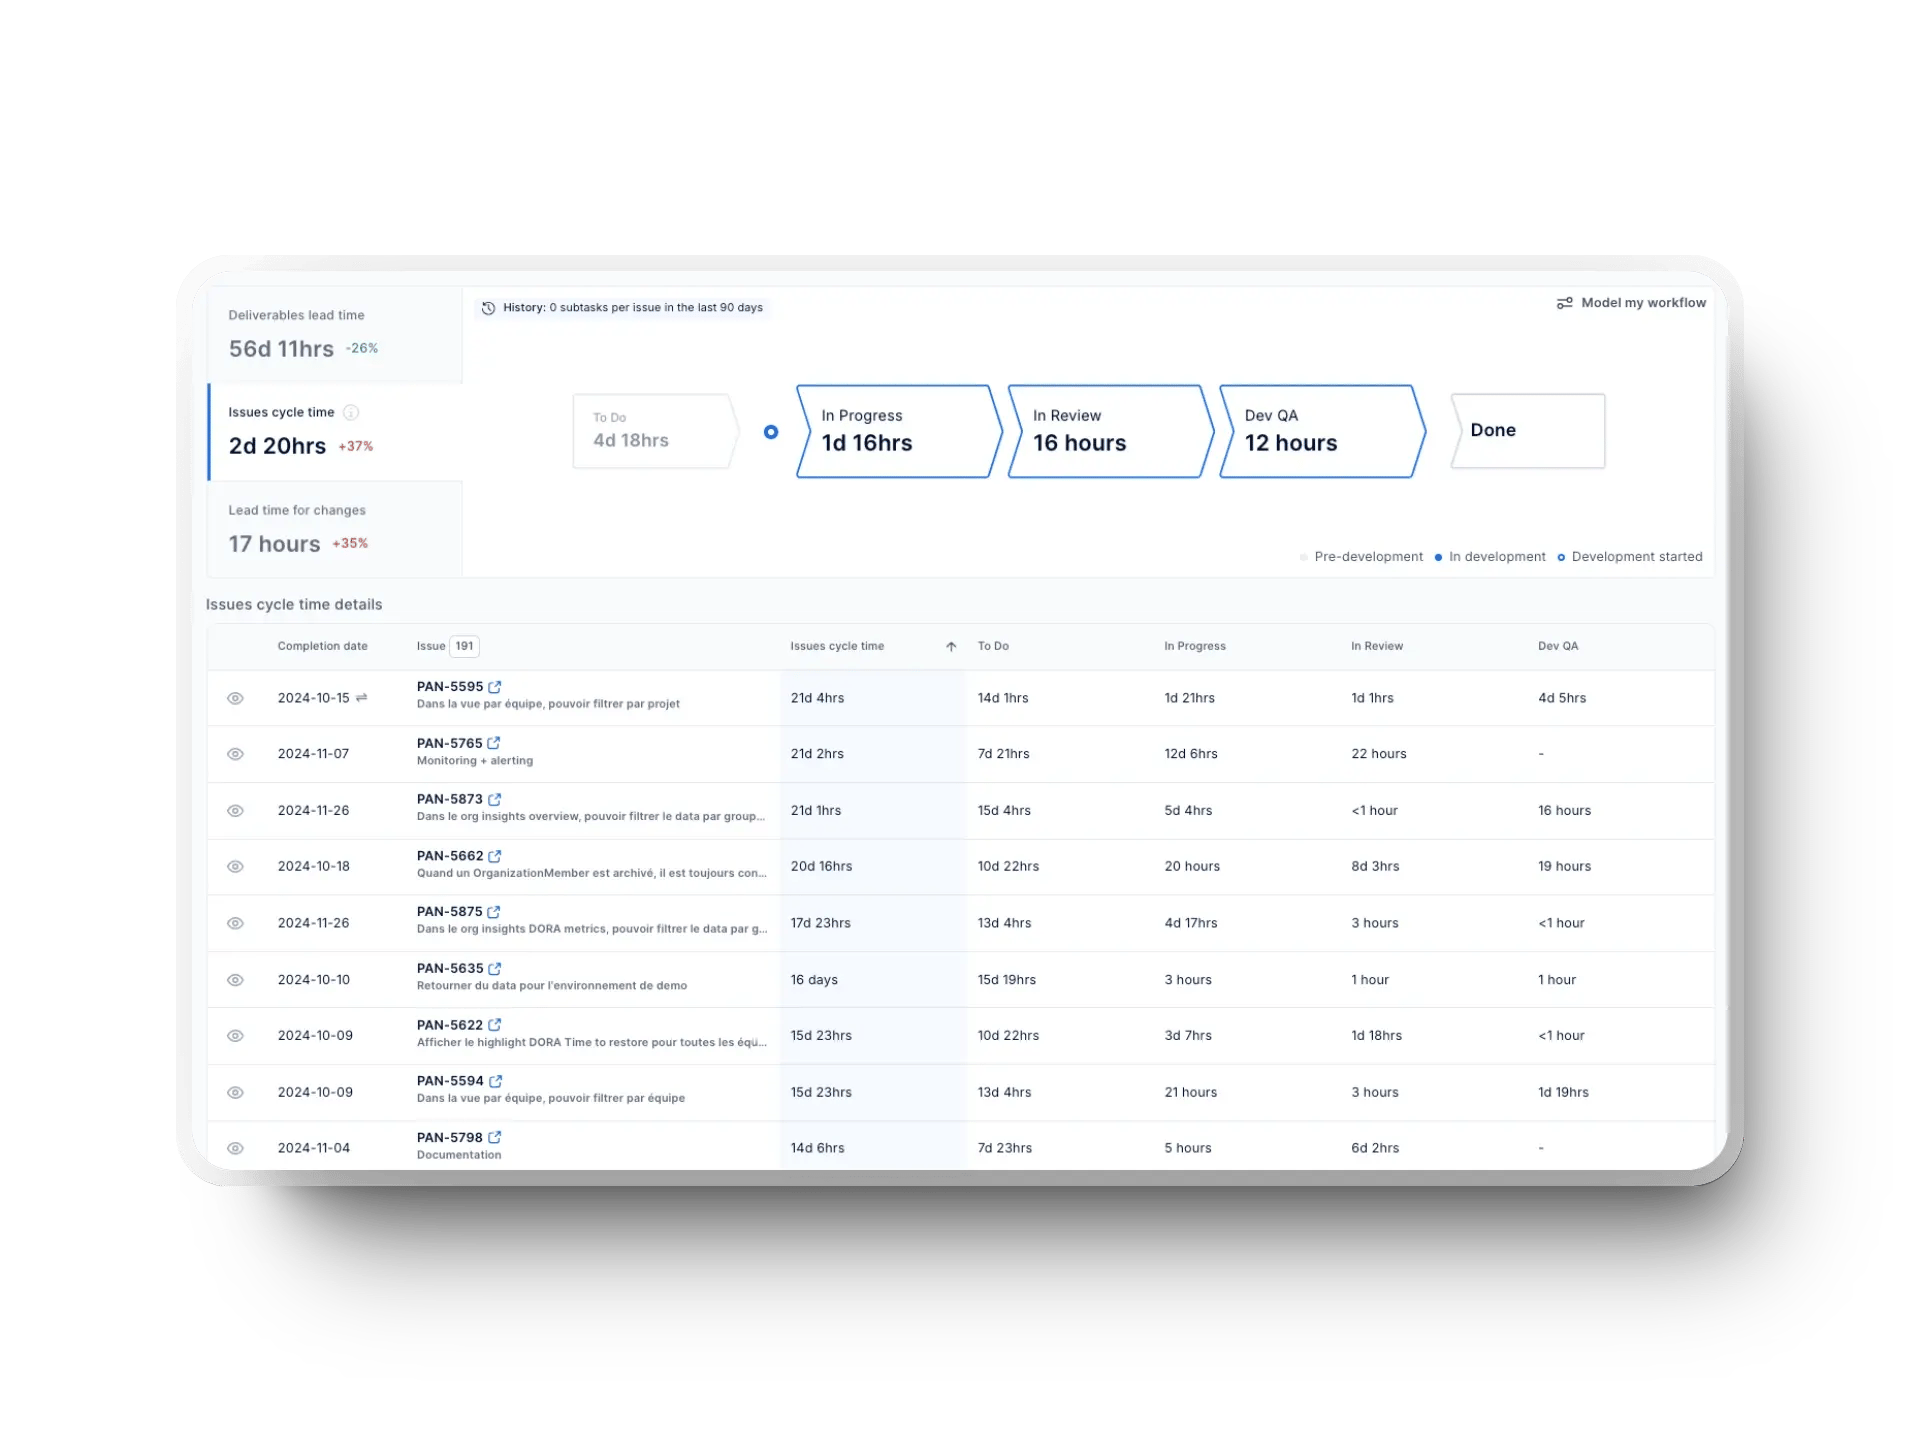
Cycle time measures how long a work item takes from idea to completion – from when a ticket is created to when it’s deployed. This isn’t about speeding up one person’s task. It’s about your team’s ability to move ideas efficiently through the development cycle.
Shorter cycle times mean fewer delays, fewer handoffs, and a quicker path to value. According to research from the Accelerate State of DevOps Report, top-performing teams reach an average cycle time of 1.8 days. The industry median is 3.4 days, while slower teams can take over 6 days. That gap adds up fast when you're trying to ship competitive products.

This is one of the most important KPIs you can track because it directly reflects delivery speed and highlights bottlenecks in the software development lifecycle. A high cycle time means more work in progress (WIP), lost context, and lower code quality, accumulating in an upward spiral. If you want to cut through the noise and measure how long it really takes to launch a new initiative, start here.
Deployment frequency tells you how often your team ships code to production. The more frequently your teams can release, the faster you can respond to feedback, roll out updates, and support product iterations. This metric shows how well you’re set up for continuous delivery and how fast your organization can adapt.
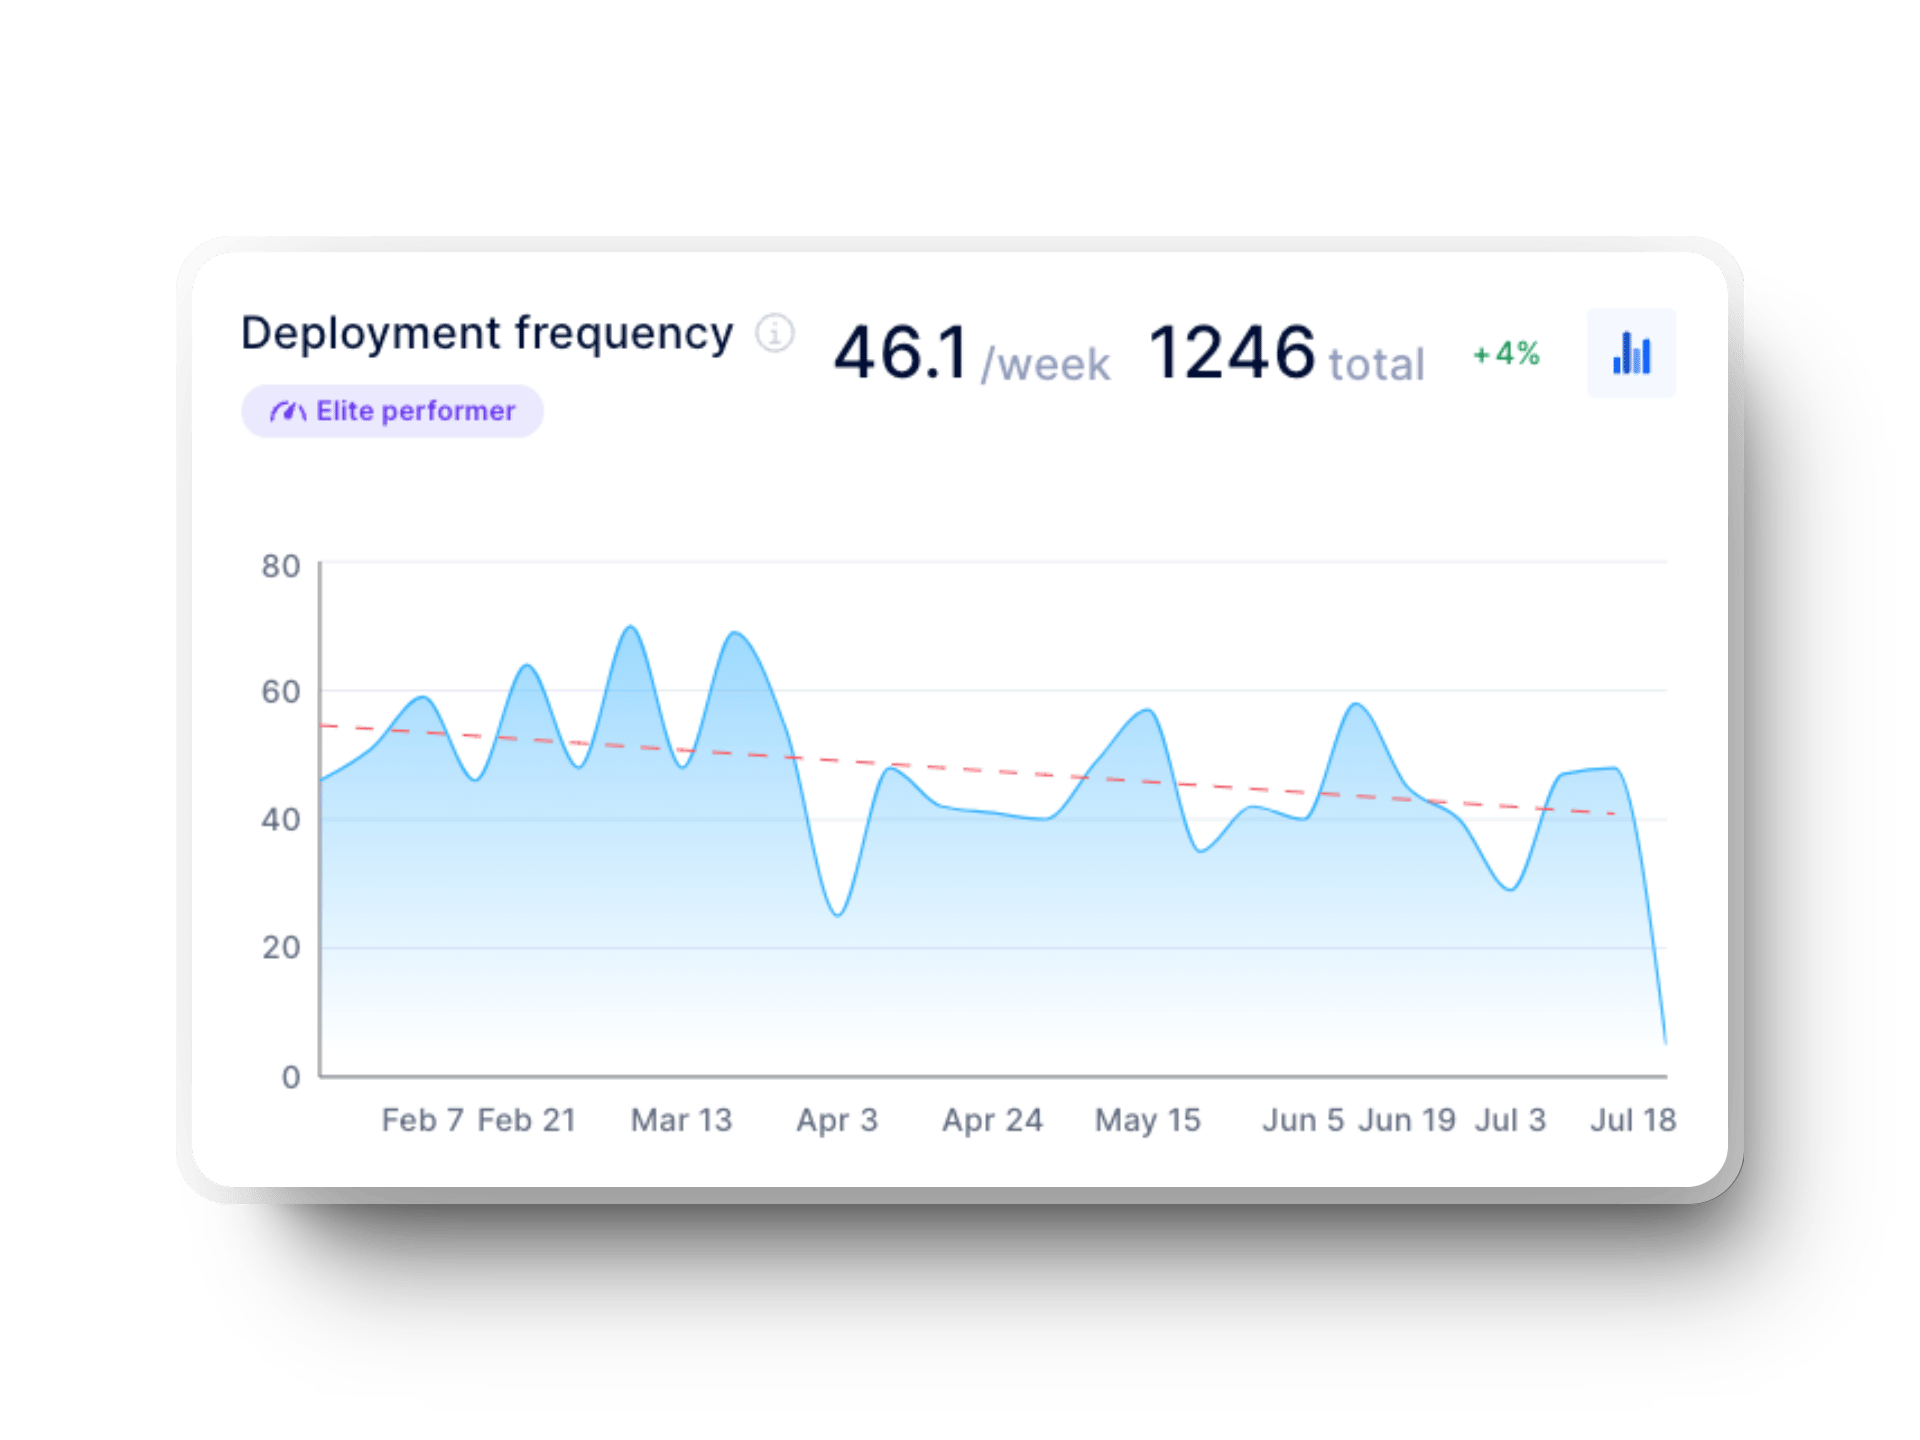
High deployment frequency isn’t just a sign of developer productivity. It means tighter feedback loops, lower risk per release, and a steady stream of value hitting your customers' hands. You can use it to evaluate team performance and improve your delivery rhythm and customer experience.
According to DORA's latest State of DevOps report, elite teams deploy multiple times daily. High performers ship changes daily or weekly, while slower teams deploy just once a month. A strong target to aim for is more than once per week – ideally, multiple times per day.

Flow efficiency tracks the percentage of total work time your team spends actively progressing tasks instead of waiting on dependencies such as reviews, approvals, or other blockers. If most of your team’s time is spent waiting instead of building, your delivery will slow to a crawl. You can’t afford that.
In one study of 63 teams, flow efficiency ranged from 9% to 68%, averaging around 35%. That means in many teams, two-thirds of the time, work is just... sitting still. This metric helps you see how much time is actually productive and where work stalls. High wait times signal a coordination issue across your product team or overloaded review queues.

Since you can restructure teams or workflows, you have the power to fix it. Flow efficiency can unlock faster delivery and improve operational efficiency across your software development process.
Work in progress shows you how much your teams are handling at once. When that number grows too high, tasks sit unfinished, and delivery slows. Overloaded teams are more likely to miss deadlines, shift priorities midstream, and lose clarity on what really matters.
And it’s not just about delays. Research shows that every time a developer is interrupted, it takes over 23 minutes to refocus fully. When multitasking becomes the norm due to too much WIP, productivity takes a serious hit.
%20in%20Axify.webp?width=1920&height=1440&name=work%20in%20progress%20(WIP)%20in%20Axify.webp)
This KPI helps you spot those pileups before they turn into delivery failures. It also shows where bottlenecks build up, for example, during code review or QA.
If you limit WIP to -/+1 of your team members, you allow your teams to stay focused, finish what they start, and move work through the system faster. This key indicator is great for streamlining your software development projects.
You need to know when a feature in progress will actually ship. Software delivery forecast dates use historical delivery patterns and current progress to give you realistic estimates of when a feature will land.
This is important, especially considering that over half of software projects face delays by as much as 198% of their original estimates, and around 70% of developers rarely deliver on time.
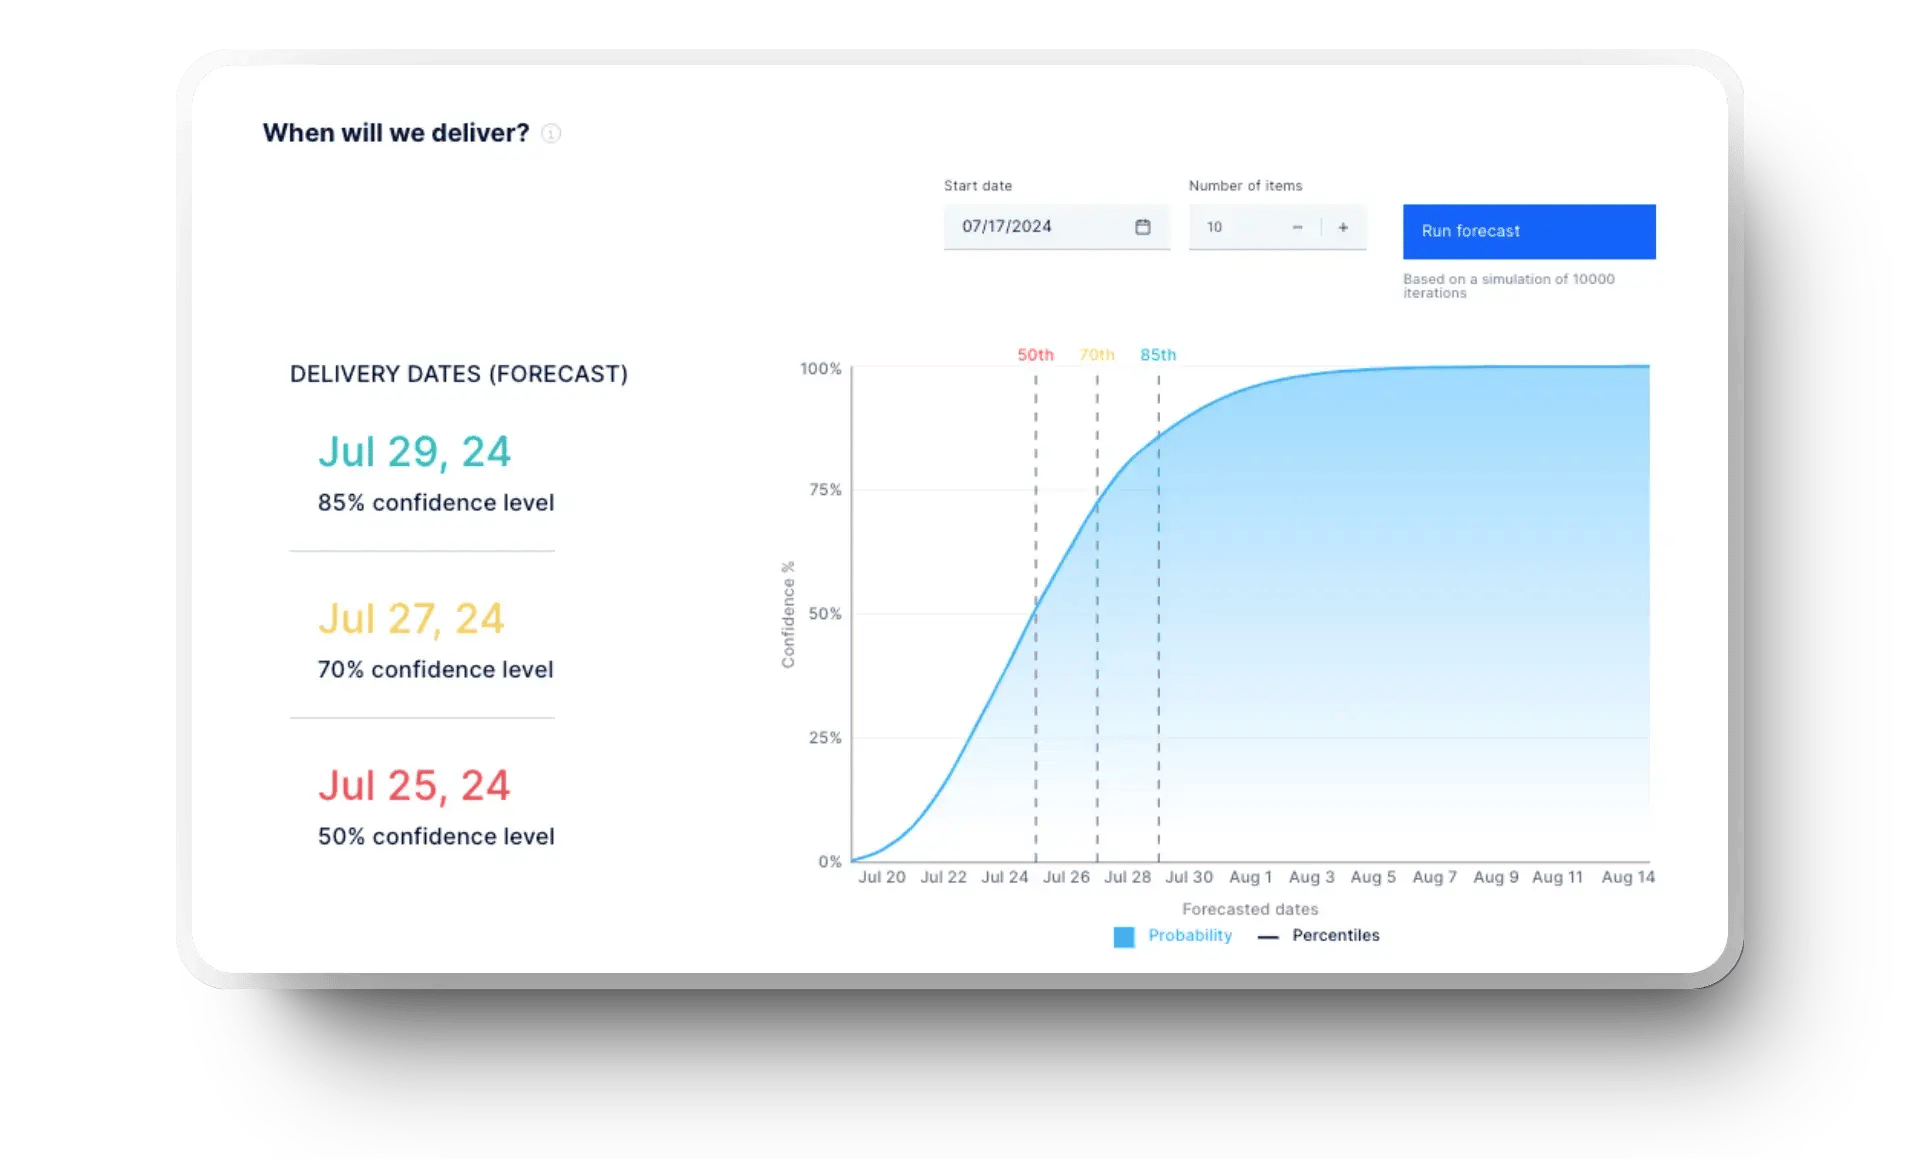
This KPI gives you visibility into timelines without relying on guesses or best-case scenarios. It helps you communicate with stakeholders confidently and plan future projects around realistic capacity.
If you follow it, you’ll reduce surprises, manage expectations better, and make smarter commitments. When your team has a clear sense of expected delivery, you set the entire business up for better planning and more dependable on-time delivery.
You don’t need vanity metrics that create noise instead of clarity. These numbers might look good in reports, but they don’t help you make better decisions or understand delivery health. Here are the metrics you should stop relying on:
You’re better off focusing on key software development metrics like the ones mentioned above. Those give you actionable insights that help with delivery decisions. You should leave the rest to team retros because they don’t belong in your strategic dashboard.
To get real value from software delivery metrics, you must choose the right ones and use them correctly. It’s easy to fall into the trap of tracking too much or focusing on surface-level data. Instead, here’s how you should think about key metrics in your delivery strategy:
Whether you're tracking efficiency metrics or trying to improve customer satisfaction, choosing the right KPIs will keep your decisions sharp and your strategy aligned.
To deliver real business value, stop tracking vanity stats and use KPIs that move the needle. The right software development metrics help you align engineering work with business goals, manage delivery timelines, and plan resources smartly.
The goal isn't just to measure speed at the individual level; focus on meaningful outcomes such as code stability, team throughput, and progress on strategic initiatives.
With Axify, you get everything in one place: VSM, delivery tracking, OKR alignment, and insights that matter. Whether you're overseeing one team or several, Axify helps you make smarter calls.
Book a demo with Axify today and start leading with real-time insights.
