AI
10 minutes reading time


AI adoption moves faster than proof inside your organization. As a result, leaders ask for evidence that ties delivery changes to real decisions. This is where AI performance metrics matter, because claims without baselines can collapse under scrutiny.
Axify can help with this by connecting your delivery data to AI usage, so the impact shows up as a visible trend line. It keeps the focus on business outcomes and measurable delivery improvements, allowing you to track developer productivity and value stream performance in the same place.
But in this article, you will see how to measure AI impact using delivery data before and after adoption, comparisons between AI-assisted and non-AI work, adoption signals, and clear attribution to delivery outcomes.
AI performance metrics are the standards you use to judge whether artificial intelligence actually improves delivery, controls risk, and justifies investments.
In 2026, this means tracking AI system performance alongside organizational impact, such as adoption, ROI, and measurable delivery change. That distinction matters because, from our experience, better models or tools alone do not automatically translate into delivery gains without consistent adoption. And when AI usage scales on top of immature or inconsistent workflows, organizations often see rising operational costs rather than real delivery improvements.
This gap explains why many teams struggle to prove results.
AI already changes how your teams write code and move work forward. According to research, some enterprise AI initiatives have delivered 26% to 55% productivity gains in reported cases, with an average return of roughly $3.70 per dollar invested.
Pro tip: AI acts as an amplifier. If your workflows and processes are streamlined, you will get good results. If not, AI will typically amplify your weaknesses (though we agree that, in some cases, AI can partially compensate for weak processes). Read our complete analysis on AI for developer productivity to learn more.
Also, check out this YouTube video to see how AI performance is actually measured:
With that foundation set, let’s move on to the metrics that matter first.
To measure AI impact, you have to track how work actually flows through teams, from intake to delivery. That means comparing AI-assisted work to standard delivery patterns to measure its impact.
With that in mind, here are the core metrics we think are best for performance evaluation across modern AI usage in software development.
AI adoption matters because it changes how work is actually performed and how decisions are made. Moreover, in software development, AI amplifies teams’ strengths and weaknesses, making their impact on delivery more visible as usage increases.
According to the 2025 State of AI-Assisted Software Development Report, adoption reflects a combination of reliance on AI, trust in AI-generated output, and reflexive use of AI as part of normal work. These can be observed through usage patterns and delivery signals attributable to AI.
This metric shows how often saved code changes are influenced by AI suggestions. It is calculated by dividing the number of AI-assisted commits by the total number of commits over the same period.
Low values usually indicate that AI tools are not being used consistently or do not fit well with how teams work. When this happens, it’s a signal to review onboarding, tool setup, and adoption across teams.
This metric reflects how frequently developers accept AI suggestions, which signals trust and perceived usefulness. You calculate it as total accepted suggestions divided by total suggestions generated.
We’ve noticed that a falling rate usually indicates relevance or quality issues rather than resistance. When it rises too fast, review discipline and output checks need attention.
Once AI adoption is established, its impact appears in delivery metrics. These indicators do not measure adoption directly, but show whether adoption improves or degrades flow, quality, and reliability.
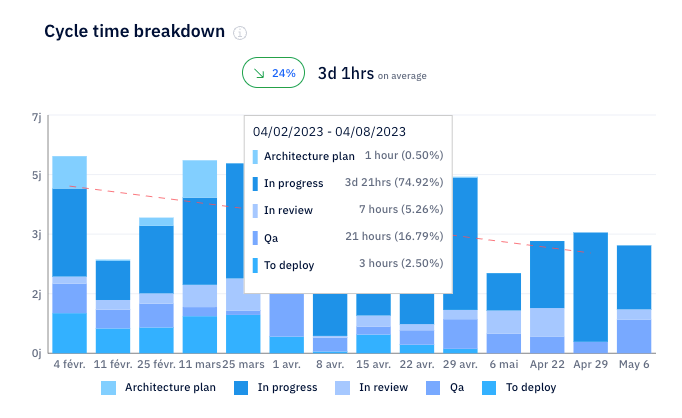
Cycle time measures how long work takes once it is actively started. And the top 25% of successful engineering teams achieve a cycle time of 1.8 days. In our experience, though, cycle time varies drastically between teams, and a closer real-life benchmark for performance would be 3-7 days.
If AI adoption does not move the trend closer to that range, workflow friction needs review.
Lead time measures the end-to-end time it takes to turn a request into a feature running in production and delivering value to end users. The top-performing teams usually achieve lead times under 24 hours. So, if lead time stays flat, AI is not reducing handoffs or approval delays.
You can measure before/ after lead time in Axify:

PR review speed measures how long pull requests remain open before being merged. Many teams aim to merge PRs within roughly 24 hours. Longer review times are often a signal of unclear changes, insufficient code clarity, ambiguous ownership, or low team trust.

Flow efficiency measures active work time versus total elapsed time. You calculate it as active time divided by total cycle time. Also, many teams report flow efficiency between about 5% and 15%. If your flow efficiency is impaired after introducing AI, we recommend checking whether those AI tools you implemented introduce more complexity/work.

Delivery time reflects how long it takes to ship a defined unit of value. The signal comes from the delta, and whether system reliability improves alongside speed. If delivery time degrades, check whether AI speeds local tasks while slowing end-to-end flow.
These signals evaluate whether AI-assisted work improves or degrades the quality, reliability, and recoverability of the software that reaches production.
For that reason, AI quality should be evaluated through two complementary lenses:
Together, these signals show whether AI is helping teams ship better software or simply shipping faster with more risk.
These metrics track AI-assisted workflows before release. They surface quality issues early, before they show up as incidents or customer-facing failures.
This metric measures the proportion of AI-generated outputs that pass quality checks without requiring human modification.
In professional settings, fewer than 44% of AI-generated code suggestions are accepted as-is. When acceptance rates remain low, improving validation rules and clarifying the handoff between AI and human professionals becomes critical.
You can track this metric in Axify:

Revision depth measures how extensively AI-generated changes are modified before merge.
It is typically tracked as:
High revision depth indicates that AI is increasing review effort instead of reducing it. Stable or declining revision depth suggests AI output aligns with team standards and expectations.
This metric helps explain why review time or cycle time changes.
This metric compares how often AI-assisted pull requests are rejected or stall versus non-AI-assisted work.
It is calculated by tracking:
If AI-assisted PRs stall more frequently, quality issues are likely surfacing during review and not generation. This is an early warning signal that AI is introducing friction into the delivery process.
These lagging indicators show whether AI adoption ultimately improves or degrades production reliability. They do not attribute causality on their own, but they confirm whether earlier signals mattered.
Change Failure Rate measures how often deployments result in incidents, rollbacks, or degraded service.
If AI adoption accelerates delivery but CFR rises, software quality is deteriorating despite higher throughput. When CFR remains stable or improves as AI usage increases, it suggests AI-assisted changes are holding up in production.
MTTR measures how quickly teams restore service after a failure.
An increase in MTTR following AI adoption can indicate:
Stable or improving MTTR suggests AI-generated changes remain understandable and diagnosable under incident pressure.
Rollback rate tracks how often releases must be reverted after deployment.
Rising rollback frequency alongside increased AI usage may signal insufficient validation or hidden coupling introduced by generated changes. When rollback rates stay flat or decline, AI is likely improving delivery confidence.
ROI is important when AI changes costs, capacity, or risk in ways leadership can verify. The metrics here focus on financial return and operational impact tied directly to delivery behavior.
These are the ROI metrics that withstand scrutiny:
ROAI is a directional indicator that helps leaders understand whether AI adoption is improving or degrading delivery economics over time. Rather than relying on industry benchmarks or precise attribution, it aggregates observable changes in software delivery, quality, and operating costs that occur alongside AI adoption.
In practice, teams estimate ROAI by tracking trends in:
These should be tracked relative to AI-related spend.
Remember: The focus is on trend direction and consistency, not on producing a single precise ROI figure.
When ROAI trends upward, AI is contributing positively to delivery outcomes. When it stagnates or declines, it signals misalignment between AI usage, workflow integration, and cost structure.
Time-to-Value (TTV) measures how long it takes for AI-assisted development capabilities to produce sustained improvements in software delivery performance after rollout. It is calculated as the time between AI feature deployment and the first consistent improvement in metrics such as lead time, PR review duration, throughput, or delivery cost.
When TTV increases, it typically indicates that AI use cases are too broad, poorly scoped, or insufficiently embedded into daily development workflows. Narrowing pilot scope and strengthening team enablement are usually the fastest ways to accelerate value realization.
This metric captures how much recurring work AI removes from delivery workflows. It is calculated by comparing operating costs before and after automation-driven changes.
Research shows companies using AI and automation may reduce operational expenses by roughly 20-30%, though that’s not a universal norm. If any savings fail to appear, automation scope and dependency mapping require review.
Productivity uplift reflects time returned to teams through AI assistance. It is calculated by aggregating time saved across tasks compared with baseline effort. Surveys report 40-60 minutes saved per employee per day in mature setups. If productivity gains remain limited, it usually indicates shallow or inconsistent AI usage, which constrains its overall impact.
Pro tip: Check out our guide on AI coding assistants to see if they really save your developers’ time.
This metric tracks how AI influences defect rates, rework, or review quality. It is calculated by comparing error or rework rates before and after AI-assisted workflows.
The 2025 State of AI Code Quality shows teams using AI-assisted reviews reaching about 81% quality improvement versus roughly 55% without AI. You need trustworthy AI systems to avoid risks and, as we mentioned above, you also need good processes before implementing AI. But if you do have risks and errors, it means that review design and system controls need reinforcement.

Source: 2025 State of AI Code Quality
These metrics focus on how AI affects control, risk, and accountability inside software delivery workflows.
They help engineering leaders understand whether AI-assisted changes remain safe, traceable, and manageable as usage scales across teams and repositories.
AI metrics only work when measurement follows intent. So, our framework below gives you a controlled way to introduce AI, measure change, and decide what stays. These steps help keep attribution clear and ensure decisions remain defensible.
Note: Before/after comparisons assume stable team composition, scope, and delivery context, or controlled pilots where those variables are held constant.
Everything starts with focus. We believe that you should identify one to three AI initiatives you can realistically implement, such as AI coding assistants, AI code review support, or AI-powered test generation.
Then, define expected outcomes in operational terms like delivery speed, fewer incidents, or a higher customer satisfaction score. This step matters because vague goals make metrics meaningless.
Clear goals, measured against a baseline, make it possible to determine whether changes are actually moving in the right direction.
Next comes restraint. For each use case, choose a small set of metrics to avoid dashboard overload. Quality signals capture correctness, adoption metrics show usage, and impact metrics tie back to cost or time.
This balance keeps metrics connected to what really matters rather than abstract scoring. Too many metrics may lead to cognitive overload.
Before any rollout, we advise you to assess current performance. Measure cycle time, delivery time, error rates, and costs using the same tools your teams already trust.
That snapshot becomes the reference point for everything that follows. Without it, later gains become very difficult to measure and factual accuracy disappears.
AI should start through a pilot team rather than across the organization. So, you should closely observe usage, acceptance rate, and early shifts in delivery. This controlled start limits risk while exposing friction early. We’ve also seen it make data drift easier to spot before it spreads.
Once enough data exists, comparison begins. You can reuse the same metrics and timeframes to avoid distortion. Also, changes in speed, stability, and cost are visualized as deltas rather than totals. This is where A/B-style comparison logic applies, even when using pilots or phased rollouts instead of formal experiments.
Finally, you'll need to make decisions. Positive signals justify scaling and deeper integration. Neutral or negative signals call for workflow adjustments, tighter controls, or a reduced scope. This step ensures investments remain aligned with measurable outcomes.
AI ROI only becomes credible when it is measured against real delivery work. That’s exactly what Axify does by sitting directly on top of your existing delivery stack.
By connecting to version control, issue tracking, and CI/CD systems, Axify observes delivery behavior as it actually happens, across teams and projects. This ensures that performance comparisons before and after AI adoption remain consistent, comparable, and grounded in real-world workflows.

The value doesn’t come from individual metrics alone, but from how signals connect. For example:
This closed loop keeps attribution intact when leadership asks what actually changed.
The AI Impact feature in Axify works as an AI ROI calculator inside your delivery system.
Baseline performance is established using historical delivery data before AI enters the workflow. Once coding assistants or other tools appear, Axify measures changes using the same timeframes and definitions.
Impact becomes visible across delivery time, cycle time, review duration, and failure rates without manual reconciliation. From there, the estimated time saved emerges from observed changes tied to how you implemented AI (e.g., prompt engineering experiments when using coding/ editing tools).
This also helps you justify ROI claims to your stakeholders. With Axify, efficiency gains connect directly to how teams move work rather than how many API requests a tool generates. That distinction separates system-level improvement from short-lived activity spikes.
Once the comparison is in place, you have clear, explainable evidence for delivery and leadership reviews.
You can see:
AI KPIs work when they guide decisions instead of decorating dashboards. So, the goal is to set measures that survive scrutiny as usage grows and stakes rise. With that in mind, these practices keep KPIs tied to real outcomes:
AI measurement typically fails for reasons that have little to do with the models themselves. The real blockers sit in planning, tooling, and how metrics get interpreted.
These are the challenges that most often derail AI measurement and how to address them directly:
AI value in software development only matters when results withstand delivery review. Clear baselines and before-and-after comparisons turn belief into proof and measurement into a decision tool.
If clarity around AI impact still feels out of reach, Axify helps you connect adoption data to delivery outcomes.
Reach out to our team today and see how those comparisons look inside your environment.
AI performance metrics measure model behavior, adoption, and before-and-after impact on software development, while traditional KPIs track outputs without attribution. The difference matters because AI metrics isolate deltas caused by AI rather than broader process changes.
We suggest tracking 5-8 metrics at most (at least in the beginning, until your AI processes mature). That range keeps attribution clear and prevents dashboards from masking the signal with noise.
You know AI improves engineering performance only when the same teams show measurable before-and-after gains in delivery speed, stability, or cost. Without controlled baselines, any improvement remains unproven.
While it’s possible to measure AI impact without a platform, it quickly becomes difficult to do at scale. Data ends up scattered across tools, requires manual work to combine, and often lacks the context needed to clearly attribute results, even when usage data is later rebuilt from logs or estimates.
AI KPIs should be reviewed on different cadences depending on what they measure. Adoption and usage signals benefit from frequent reviews (weekly or bi-weekly), delivery and quality metrics should be reviewed monthly, and value or ROI indicators are best reviewed quarterly. KPIs might need to be updated whenever AI use cases, workflows, or decisions change. A simple rule of thumb: if a KPI no longer helps you decide what to do next, it’s time to revisit it.