8 minutes reading time


You deal with constant pressure to deliver faster without adding risk to your system. For that reason, you pay close attention to the bottlenecks that slow down your software development process, even when the coding itself moves quickly.
Across planning, review, testing, and deployment, delays add up. Over time, they make forecasting harder and delivery less predictable. This article breaks down where those delays come from, how they affect lead time and how to manage them more effectively.
First, let’s make sure we use the same definition for lead time.
Lead time in software development is the total amount of time from the moment a stakeholder makes a request until the feature is running in production and is usable by the end-user.
It covers every step of the delivery workflow—planning, coding, pull requests, testing, and deployment—reflecting how your system handles real work under real constraints.
You can check out the full video here if you want a quick walkthrough:
Now that you have the baseline definition, let’s break it down through a simple formula.
Lead time follows a simple structure:
Lead Time = Delivery Date − Request Date
This equation captures the full window starting when a stakeholder submits a change request and ending when the feature runs in production for real users.
With this covered, let’s compare it to cycle time to clarify how the two metrics work together.
Lead time vs cycle time comes down to scope. Lead time covers the full path from idea to deployment, while cycle time measures the period from when work starts to when it is completed.
Lead time tells you how predictable your delivery pipeline is and how long stakeholders wait for value. Cycle time shows how quickly work moves once it starts. Each metric uncovers different constraints, and each guides different decisions inside your engineering teams.
Example Comparison
|
Metric |
Start |
End |
Primary Purpose |
|
Lead time |
Idea created |
Code deployed |
Planning and forecasting |
|
Cycle time |
Work started |
Work finished |
Flow and efficiency |
You can watch this short breakdown if you want a clearer, visual explanation.
Now, let’s move on and talk about why this metric deserves your attention.
Tracking lead time matters because it highlights where work gets stuck, exposes delays across your delivery path, and gives you the data you need to fix those bottlenecks. When you act on these insights (by improving handoffs, reducing wait time, or smoothing workflows) delivery becomes more predictable, expectations align, and releases speed up without adding risk to the system.
And since the metric covers every stage from request to production, it gives you a direct view of how your delivery stream behaves under real conditions rather than planned ones.
Lead time is one of the few delivery metrics that resonates equally with engineering teams and business leaders. It creates a shared reference point: everyone can see how long it takes for an idea to reach production and understand why delivery speeds or forecasts change.
When lead time decreases, feedback loops tighten. Teams identify issues sooner, adjust more quickly, and prevent small delays from turning into large schedule impacts. This becomes especially valuable in environments where priorities shift, stakeholder expectations evolve, or customer demands accelerate.
To illustrate why speed matters, consider this insight from industry research:
This perspective is important because it connects engineering throughput directly to business outcomes. And in practice, lead time becomes your clearest signal for how quickly value reaches real users.
Lead time also reveals the hidden wait times that slow down your daily work. For example, long review process delays, inconsistent handoffs, gaps in the software development pipeline, and missing context during testing all contribute to longer delivery cycles.
Each part reflects non-value-added time — it doesn’t advance the item, yet it still impacts your delivery timelines. When tracking the full window, you see which stages require attention and where you can introduce workflow efficiency improvements.
This is where the full set of DORA metrics adds context.
According to the 2025 DORA report, high-performing teams deploy faster, recover faster, and introduce changes with less friction. While DORA doesn’t give explicit lead-time targets, the DORA outcomes themselves (fewer failures, faster recovery, more frequent deployments) naturally drive lead time down.
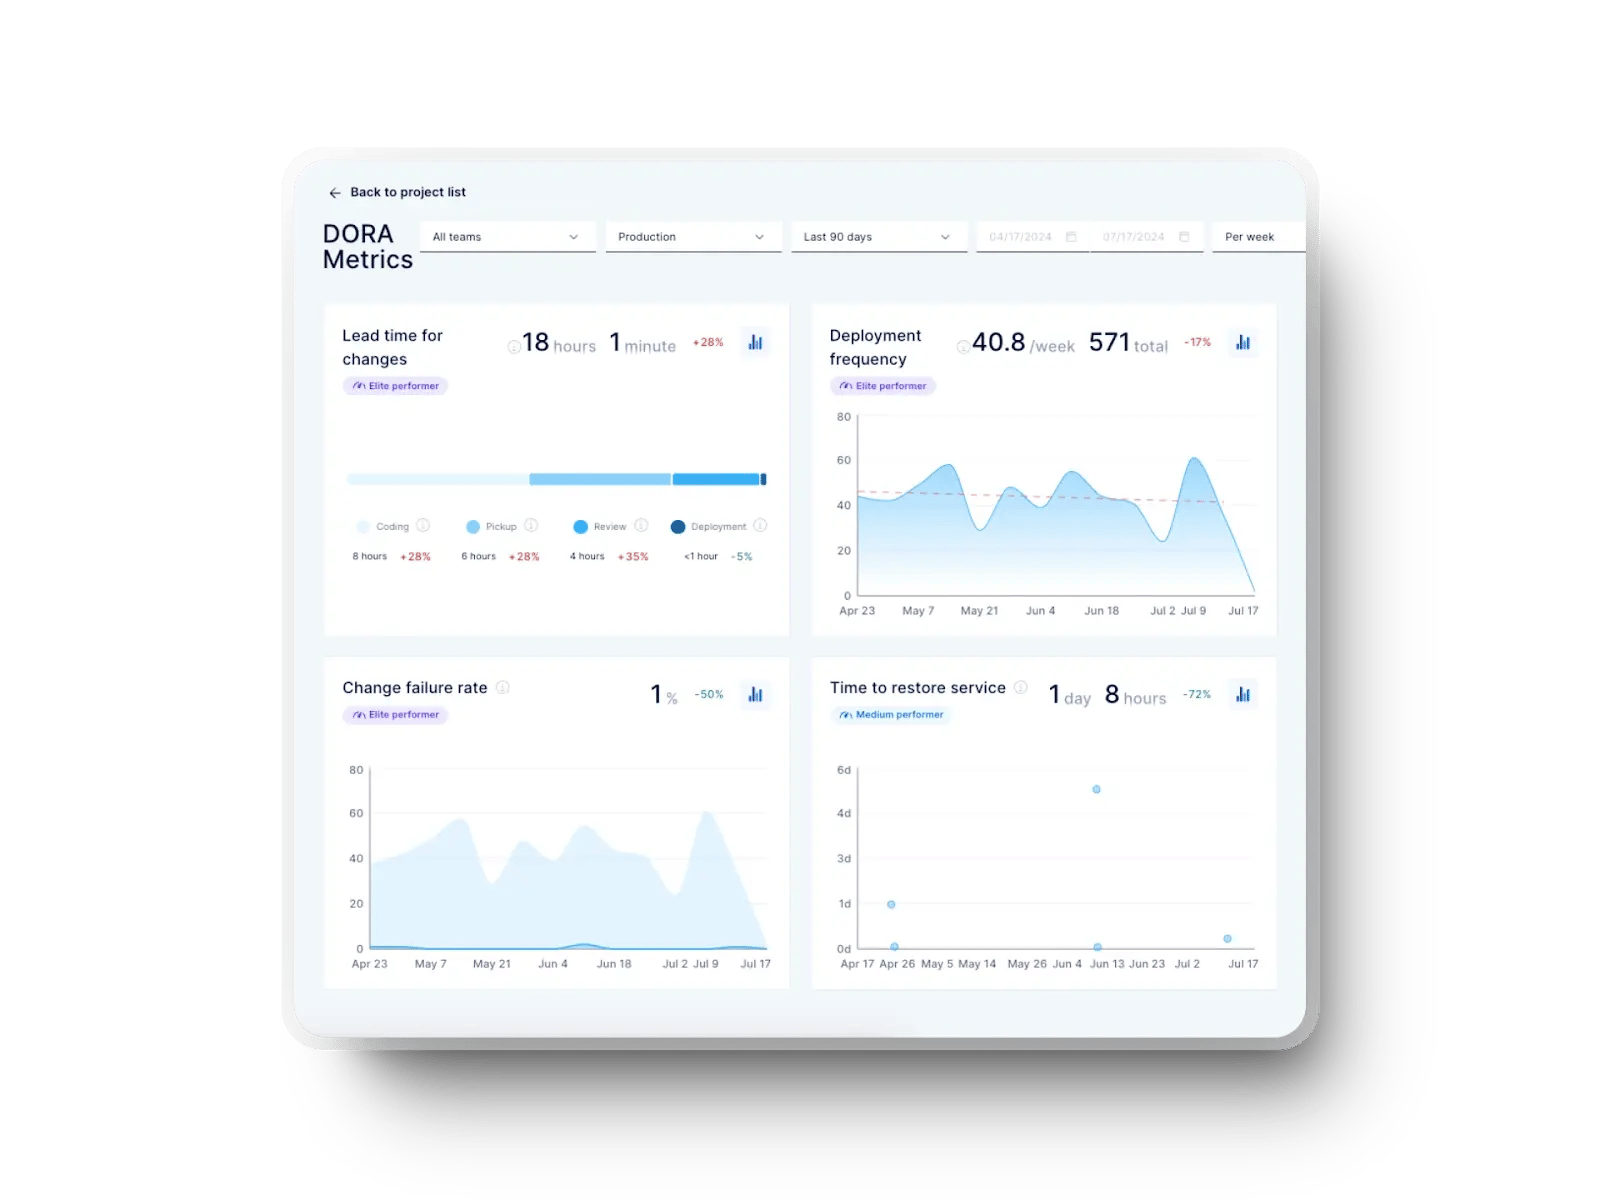
Axify tracks DORA metrics, so you get a precise picture of your delivery stability (through Change Failure Rate and Failed Deployment Recovery Time) and speed (through Deployment Frequency and Lead Time for Changes). You can see that here:
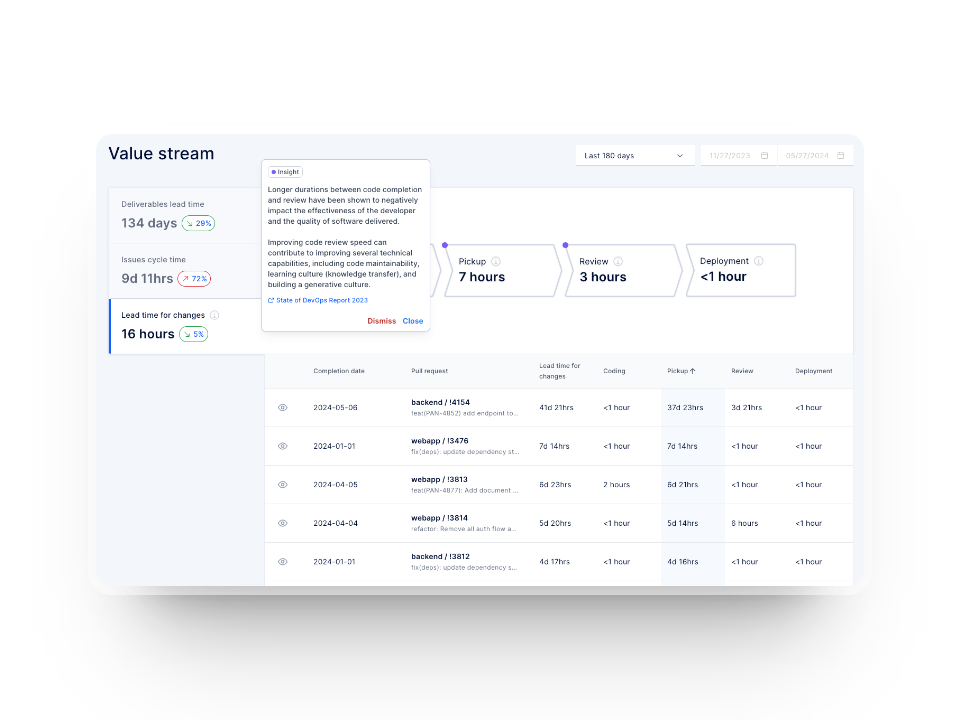
To refine your delivery flow, you need visibility across the entire software development process and this is exactly what Axify does.
With features like value stream mapping, you can see which steps slow you down and where continuous improvement efforts will have the strongest impact. Here's what it looks like:
All of this leads us to the factors that influence lead time in real delivery environments.
Lead time stretches when delays stack up across your flow, even when your coding pace is steady. And because these delays usually stem from everyday practices rather than rare incidents, understanding what slows you down leads to more predictable Agile software delivery. Here are the main factors that typically extend lead time and keep work in progress longer than expected.
Pull request queue time is one of the most common sources of delay. The work is done, the context is fresh, and the next step should be a quick review.
But slow review turnaround stalls momentum, adds context-switching costs, and forces team members to revisit work they thought was complete. This delay compounds when reviewers are spread thin, deep in other tasks, or balancing competing priorities.
For example, reviewers usually juggle feature work, meetings, and support tasks, so their availability drops exactly when your flow needs them. And because review wait time occurs after the code is written but before it progresses, it inflates lead time without anyone actively working on the item.
As a reference point, a 2024 empirical study on code review activity prediction (five datasets across OSS and industry) reports median wait times between roughly 15 and 64 hours. This shows how long changes typically sit idle before feedback arrives.
This waiting period affects planning accuracy because you can’t reliably forecast work that depends on unpredictable reviewers.
Manual testing increases lead time because it depends on human availability, environment setup, and recurring regression cycles. Since QA often receives work late in the process, tasks pile up and push delivery back. Testers lose time rebuilding environments, validating edge cases, and dealing with handoffs that arrive with missing or unclear details.
The real problem is that manual testing scales poorly.
One additional feature can multiply the regression burden across many workflows. And when QA is overloaded, you see delays not just in validation but also in defect turnaround, since context must be reloaded each time.
On that note, a multi-team empirical study on manual testing reports teams running up to 40 test cycles per year (median 4.5). The study also shows issues such as late tester involvement and duplicated effort, all of which stretch cycle times and add friction.
Automation reduces these delays, but you still need clear ownership and accurate inputs. Axify’s value stream mapping view helps you spot long QA stages and identify where automation or earlier tester involvement would reduce your end-to-end time.

Large batches slow you down because they pack too many changes into a single deliverable. Bigger work items take longer to design, code, validate, and review.
And when something fails, the entire batch becomes blocked, forcing the team to wait. This stretches validation cycles and adds risk because issues are buried inside a larger set of changes.
Smaller batches reduce this risk by keeping changes isolated and easier to review, shortening review cycles, and producing faster feedback. They also help stabilize forecasting because the variance between items drops, which gives you a more predictable view of your software delivery lead time.
When leaders see wide variation between story sizes, this is typically the first place to intervene.
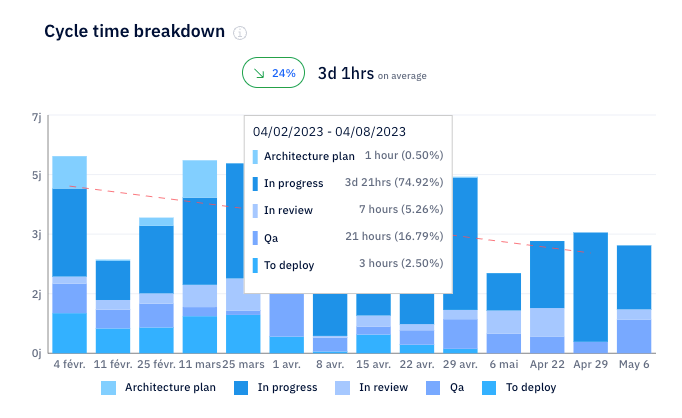
Axify’s cycle time charts make it easy to spot when large work items slow the flow because you see exactly where time increases across stages and how much variation exists between items.
When developers commit infrequently, work stays hidden for longer periods. So if errors appear late, they trigger expensive rework. Infrequent commits also reduce visibility across the DevOps pipeline, which makes it harder to track progress, share context, or split work effectively.
Frequent commits provide smaller review units, cleaner merge paths, and clearer traceability. Shorter intervals between commits also reduce the chance of merge conflicts or duplicated work. As a result, the full stream of engineering activities becomes easier to inspect and adjust.
Long approval chains usually appear in organizations trying to add risk controls. But these controls slow work when approvals move through several external groups or layers of sign-off. Each step introduces waiting time because the people reviewing may not be available when the work arrives.
These delays add up, particularly in regulated or enterprise environments. And long approval paths also make planning harder since you depend on people who are outside your immediate delivery team. Work becomes stuck between roles, and lead time inflates without real progress.
To improve this, leaders typically review which approvals are still necessary and which ones can move to automated checks, policy gates, or role-based trust models.
Deployment steps require clarity around who handles validation, infrastructure changes, and production readiness. Without clear ownership, teams wait for someone to take the next step, and the last part of delivery becomes a guessing game. This typically happens when deployment responsibilities shift between developers, SRE, platform engineering, or release managers.
Unclear paths create friction across the project management chain because no one fully owns the status. And if deployment tasks compete with other high-priority work, they slip even further.
Clear runbooks, automation, and defined responsibilities can help you reduce this ambiguity.
Overloaded sprints spread attention across too many items, and that pressure increases context-switching costs. Developers move between tasks, reset their mental state, and lose track of details, which slows progress across all items. This also impacts team morale because work never feels complete.
Overloaded sprints usually arise from optimistic planning, unpredictable market conditions, or pressure to push more features. And when too many items sit in progress, each one moves more slowly because it competes with others for the same limited capacity.
Here's an example of this in action. A longitudinal study of 4,910 tasks from 17 developers and a survey of 132 developers show that task switching and interruptions impose cognitive load and reduce productivity. The same study reports that self-interruptions (typically caused by juggling too many tasks) are even more disruptive than external interruptions.
Axify automatically tracks your WIP and highlights when your teams are carrying more work than they can handle. With value stream mapping, you can also see where context switching inflates the time spent in specific phases, making bottlenecks and inefficiencies easier to spot.

From here, let’s look at a practical example to see how lead time behaves in an actual workflow.
Lead time becomes clearer when you see how a single feature moves through your system from request to production. And by walking through a real sequence of events, you can see where waiting time builds up and how each stage contributes to the final duration.
Here are the steps a team might follow while delivering a new authentication feature for a SaaS platform.
A stakeholder submits a new requirement, such as a Jira ticket describing an authentication improvement. The work is pulled into the team’s queue, and a developer starts implementing the feature branch.
The first commit lands at 10 a.m. on Monday, signaling the start of active development. From that moment on, progress is shaped by coding speed, how easily developers can access the context they need, and whether the next stage in the workflow is ready to receive the work.
The feature enters peer review the next day. And because review time varies based on workload, the developer waits roughly 12 hours before the reviewer provides feedback.
This interval represents a common waiting period that adds to lead time even when the code is complete. After feedback arrives, the developer begins revisions.
Revisions are implemented throughout the day, and the pull request receives approval by the end of Day 3. At this point, the work is ready for validation through automated pipelines, which begin preparing the change for testing.
Automated tests run early on Day 4 and finish in about three hours. However, QA validation adds another six hours due to environment setup and cross-checking edge cases. These two steps together form a significant portion of the waiting time that stretches lead time.
The change is merged and deployed to production through CI/CD at 2 p.m. on Friday. The total lead time from first commit to production is about 4.5 days.
Axify allows to see each event in this timeline (from commits to review states to merge and deployment). This helps you see where time accumulates and where process adjustments would have the biggest impact.
Now, let’s move forward and look at practical ways to reduce lead time across your system.
Lead time improves when you address the delays that slow work as it moves from idea to production. And since these delays appear at different points in your development process, the most effective changes come from targeted adjustments rather than broad, high-level practices.
Here are the strategies that give you the most leverage.
Automation reduces the idle time that builds up between coding, validation, and deployment. With automated tests and pipelines handling packaging, verification, and promotion, the gap between finishing work and seeing it run in production shrinks dramatically. And by eliminating repeated manual steps, automation reduces the risk of human error.
The real gain comes from speed plus consistency. Automated tests run the same way every time, which helps you spot issues earlier and avoid failures that surface late in the cycle. This tighter loop gives you faster learning and fewer regressions to revisit.
To show how much impact automation can have, a 2024 case study on CI/CD integration reports test execution time dropping from 6 hours to 1.5 hours. Defect detection also increased from 70% to 92% after adopting automated testing and deployment in a real-world project.
This level of improvement reflects how automation reduces handoffs and removes friction in validation. And with fewer manual checkpoints, developers can verify changes themselves without waiting for others to trigger tests or coordinate checks.
We already explained that large batch sizes increase lead time. Of course, the solution is to reduce batch sizes. This has a large number of advantages:
Batch size reduction fits naturally with iterative delivery because it keeps work small, clear, and continuously ready for integration. If you track your flow using Axify’s visualizations, you can see how smaller units shorten review and testing times across your pipeline.

Review delays remain one of the most common sources of avoidable waiting time. Reviewers usually juggle feature work, support duties, and meetings, so reviews get postponed until gaps appear in their schedule. And since review happens after coding but before validation, delays multiply the time work is spent sitting idle.
To reduce this, you can:
Feature flags separate deployment from release, which gives you more control over how and when you expose functionality to users. With flags in place, you can deploy code as soon as it is validated, even if it isn’t ready for full rollout. And since you can toggle features on or off instantly, you reduce the need for emergency patches or rollback-heavy workflows.
This separation is especially helpful in environments where work must pass multiple layers of validation or where product teams need time to coordinate messaging. Deploying code early keeps your pipeline moving and shortens your path to production. When the feature is ready, releasing it becomes a simple switch rather than a full deployment event.
Flags also help reduce batch sizes indirectly, because they let you ship incremental pieces of the feature without exposing incomplete work. This reduces risk and lets your teams test smaller units in production safely.
Approval chains slow delivery when each step depends on someone reviewing work outside the active development flow. These steps usually originate from risk controls, compliance checks, or role-based requirements.
But when approvals stay manual, the delays they introduce can last longer than the work itself.
Automated policies, infrastructure-as-code validation, and policy-as-code systems help you standardize checks that used to require manual oversight.
When these controls run automatically, engineers gain the freedom to deploy without waiting for multiple sign-offs. Automated rollback and audit logging also give stakeholders confidence that their controls remain intact.
This shift can be impactful.
A 2025 cross-sector empirical review of ITSM-based change management automation in cloud environments reports that integrating automation, infrastructure as code, and policy-as-code mechanisms reduced change lead time by up to 70%. The same review notes that rollback incidents have decreased by 40% and audit preparation effort dropped by 60% compared to manual processes.
All these time savings compound, contributing to shorter lead times.
This level of automation suits teams working in regulation-heavy or enterprise environments where consistency matters as much as speed. As these controls move into automated policies, your senior engineers no longer serve as gatekeepers and can focus on higher-impact responsibilities.
Visualizing your delivery flow helps you identify where delays accumulate and which stages need attention. Without clear visibility across tools, it’s harder to implement targeted improvements. With visualization, you see patterns and blockers in your day-to-day work that might otherwise stay hidden.
Axify’s value stream mapping view shows your end-to-end flow from request to production. And because it integrates data from your development tools, it gives you a real-time coherent picture rather than fragmented snapshots.
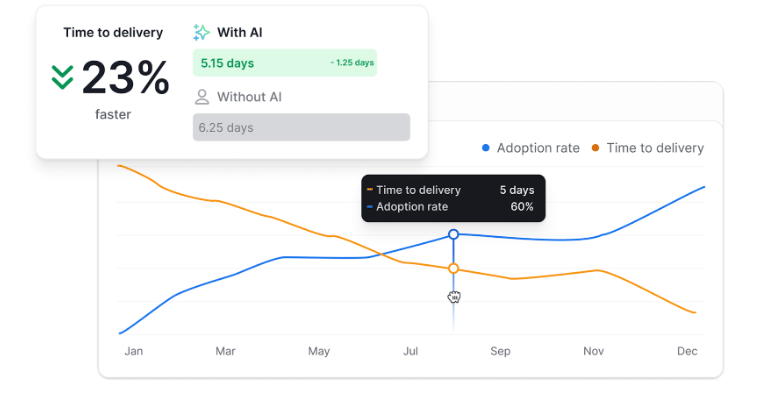
The Axify AI impact feature also helps you see how your delivery metrics change after adopting new AI tools. This allows you to validate whether AI adoption improves your global delivery performance or not.
This visibility creates a tighter loop between diagnosis and action. As teams build a steady rhythm around reviewing these metrics, they gain clearer direction on where to focus and how to adjust workloads, review expectations, or testing efforts.
Reducing lead time depends on clear visibility across your flow, and Axify helps you work with that data in a structured way. It shows where delays appear, how work moves through each stage of the development process, and which patterns slow progress across your teams.
And as your processes mature, Axify tracks how your delivery speed improves over time.
If you want a clearer view of your system and a path to faster, more predictable delivery, book a demo with Axify today.
A good average lead time depends on your system, your release model, and the type of work you ship. Some teams deliver within a day, while others take several days or weeks, depending on complexity and dependencies. The most important signal is whether your lead time trends downward or stays stable over time.
Lead time measures how long a change takes to reach production. Deployment frequency measures how frequently changes reach production. Both matter, but they answer different questions: one focuses on speed, and the other focuses on flow.
The best way to track lead time automatically is to connect your source control, planning tools, and CI/CD system so timestamps move into one place. This removes manual tracking and gives you real-time data across every stage.
Axify visualizes lead time trends by mapping each event in your delivery flow, from request to production. It shows how long work stays in each phase and how those times change over time. This helps you see what improves and what needs attention.