Delivery Performance
13 minutes reading time

Software development analytics tools bring together data from issue trackers, code repositories, CI/CD pipelines, and other engineering systems. They help leaders understand how work moves through the development lifecycle, where delays occur, and whether process or tooling changes improve delivery.
The Business Development Bank of Canada shows what this analysis can support in practice. During a three-month engagement, two BDC development teams used Axify to identify bottlenecks and guide workflow changes. They achieved up to 51% faster delivery and increased team capacity by 24%, contributing to $700K in recurring annual productivity gains. Pre-development time also decreased by 74%, while quality control time fell by 81%.
These results started with activity tracking. But the teams used this delivery data to identify where work stalled and decide which parts of the process to improve.
Remember: “The best software development analytics tool” means different things for different teams. It depends on the questions your organization needs to answer, the systems it must connect, and the decisions its data should support.
This guide compares 10 software development analytics tools based on their metrics, integrations, AI capabilities, and primary use cases to help you choose the best.
Let’s get started!
Software development analytics tools collect and analyze data from across the engineering workflow. They help leaders assess delivery performance, code quality, workflow efficiency, and team-level trends without relying on data from each system separately.
You may also see platforms in this category described as:
These categories overlap, but they are not interchangeable. Git analytics tools focus primarily on repository activity, while broader engineering intelligence platforms connect data from project management, source control, CI/CD, incident management, and other delivery systems. Our guide to software engineering intelligence covers this category in more depth.
Engineering managers typically use this data to investigate bottlenecks and understand changes in team performance. VPs of Engineering and CTOs use it to compare delivery patterns across teams, products, or business units and decide where intervention is needed.
Although developers generate much of the underlying workflow data, these platforms are designed primarily for the leaders responsible for improving the delivery system.
These platforms cover everything from AI impact and delivery performance to code quality and custom reporting. Here are the 10 software development analytics tools worth comparing in 2026:
| Tool | Best for | DORA metrics | AI tracking | Pricing tier |
|---|---|---|---|---|
| Axify | AI adoption and delivery improvement | Yes | Adoption, cost, and impact | $$ |
| LinearB | PR automation and workflow governance | Yes | Impact measurement and code reviews | $$ |
| DX | Developer surveys combined with SDLC analytics | Yes | Usage, code, and impact | $$$ |
| Faros AI | Complex enterprise data and toolchains | Yes | Impact, spending, and AI agents | $$$ |
| Jellyfish | R&D investment and business alignment | Yes | Adoption, spending, and impact | $$$ |
| Span | AI agent observability and spending | Yes | Agent activity, spending, and impact | $$$ |
| DevDynamics | DORA tracking and delivery forecasting | Yes | Adoption and delivery impact | $ |
| Swarmia | Team metrics and continuous feedback loops | Yes | Adoption, cost, and impact | $$ |
| SonarQube | Code quality and security analysis | No | AI-code assurance only | $ |
| Power BI | DIY engineering dashboards | Custom build | Custom build | $ |
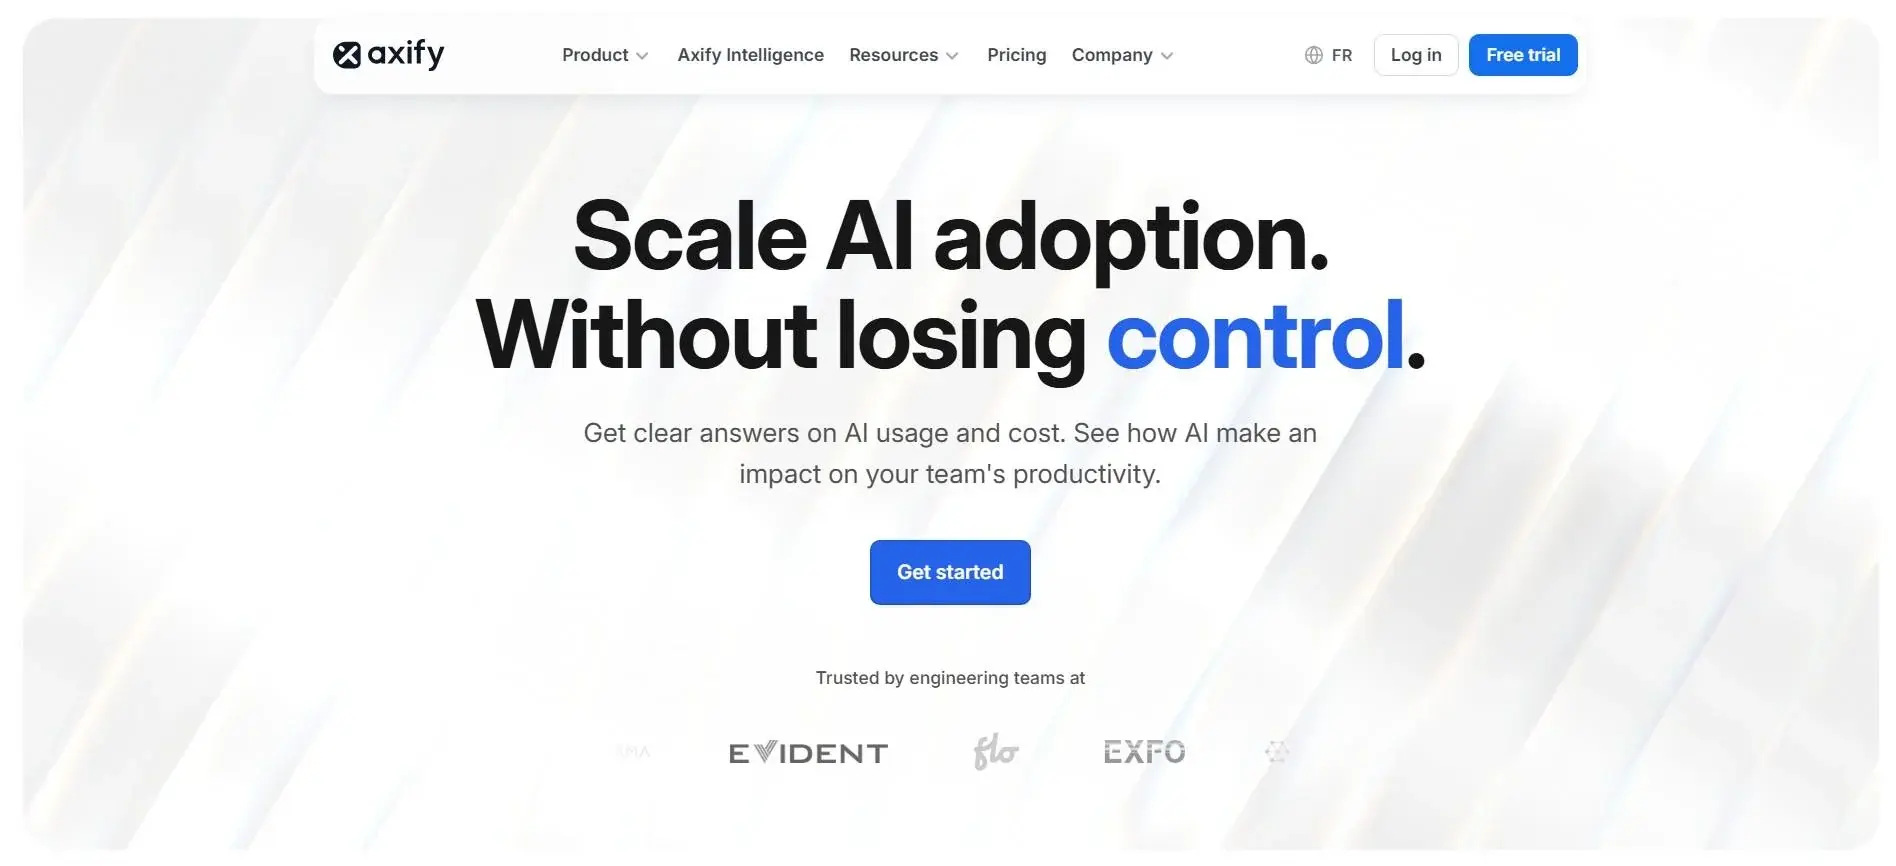
Axify is an engineering intelligence platform for AI-augmented development teams. Axify shows you whether AI coding tools improve software delivery or simply increase activity and cost. It brings adoption, acceptance, and spending data into the same view as cycle time, code review, quality, and DORA metrics. You can compare tools such as GitHub Copilot, Cursor, and Claude Code by team, project, or time period.
More importantly, Axify lets you compare delivery before and after adoption, and across teams with different adoption levels. This helps you see where AI shortens delivery time, where its gains disappear downstream, and whether increased output creates more review or quality work. Axify Intelligence then identifies the bottlenecks behind those results and recommends actions you can apply from the platform.
Key features:
Best for: Engineering organizations that want one place to measure AI value, uncover delivery bottlenecks, and consistently improve flow across teams.
Limitations: Initial configuration and learning the full metric set can take time for beginners during rollout.
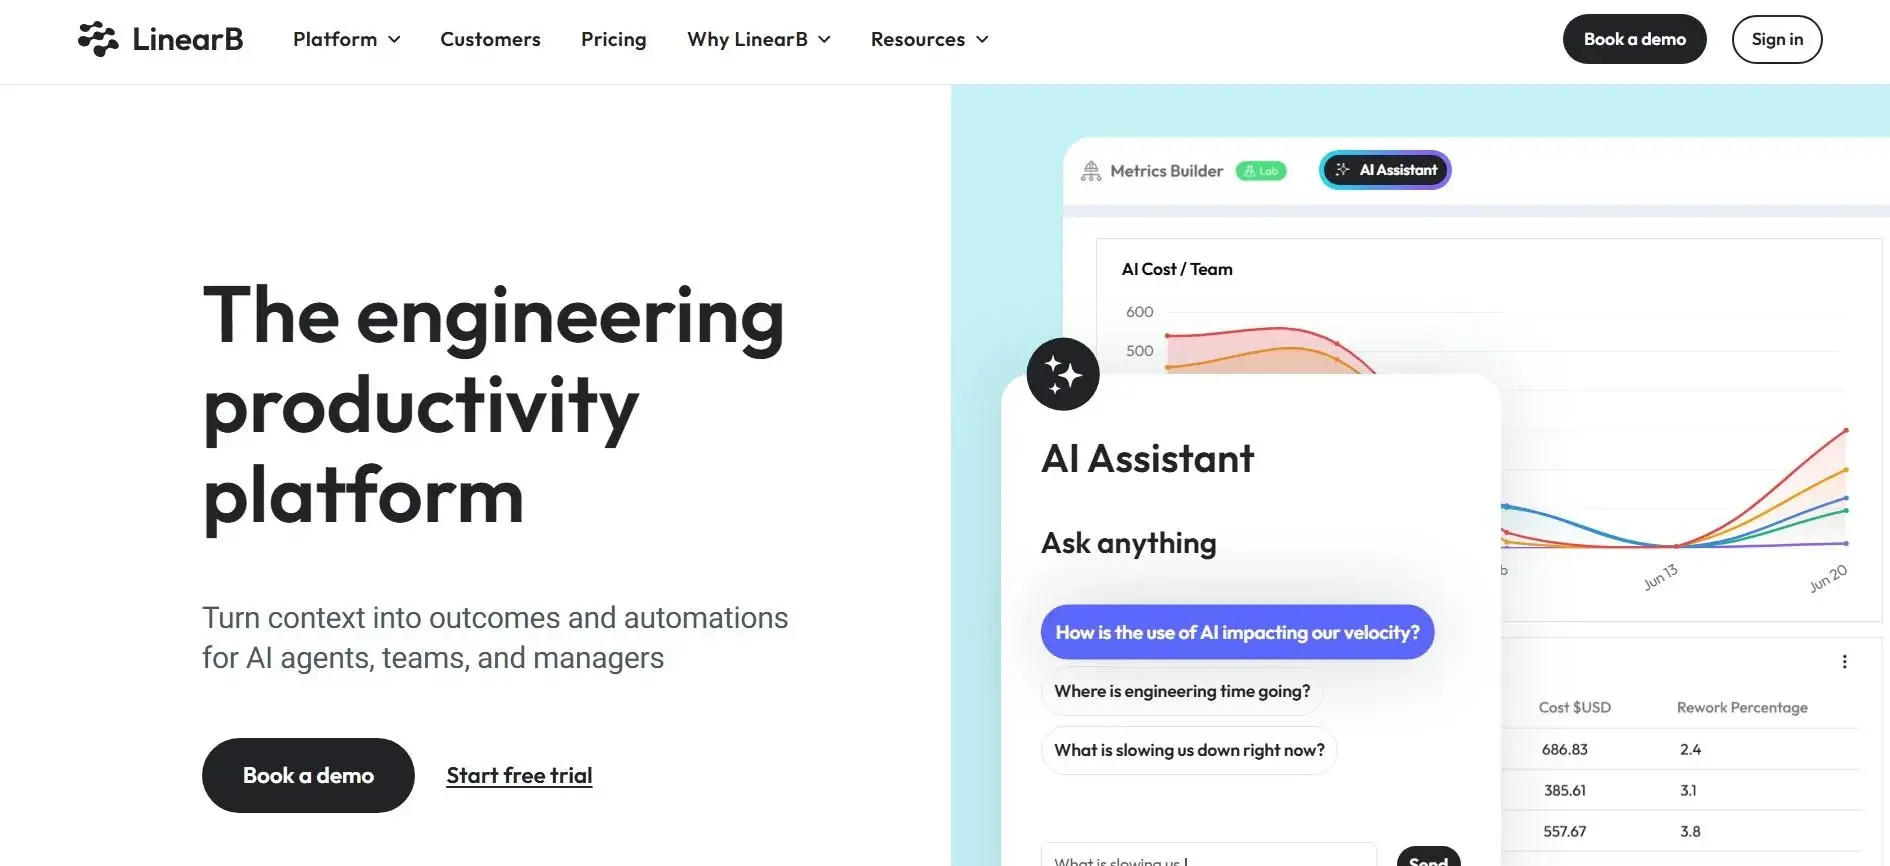
LinearB helps you measure how AI affects software delivery and manage the additional pull-request volume it can create. You can track AI adoption across coding assistants, code-review tools, and coding agents, then connect that activity with commits, pull requests, cycle time, throughput, quality, and developer experience.
Its main differentiator is the connection between analytics and workflow governance. LinearB’s gitStream product lets you define rules for routing pull requests, assigning reviewers, enforcing approvals and tests, and automating merges. Its AI code reviews also identify bugs, security risks, performance issues, and specification mismatches before code is merged.
Key features:
Best for: Mid-sized and enterprise engineering organizations that want to measure AI’s effect on delivery while standardizing how pull requests are reviewed and merged.
Limitations: LinearB tracks adoption across many AI tools and flags pull requests that involve AI, but it doesn’t attribute AI-generated code line by line. Its gitStream automation is also configured as rules in each repository, which adds setup and maintenance work.
Comparing options? See our guide to LinearB alternatives.

DX combines engineering-system data with feedback from developers and AI agents. This gives you both the operational view of what is happening across the SDLC and the qualitative context needed to understand why. Its research-based measurement models include DX Core 4, DORA, SPACE, and DevEx.
For AI measurement, DX tracks AI-generated code by commit and pull request, and by agent for supported tools. You can evaluate adoption, compare vendors, and examine how AI affects delivery performance, software health, and developer experience. Atlassian acquired DX in 2025 and is positioning the platform as part of its broader engineering intelligence and AI-enabled software development offering.
Key features:
Best for: Large engineering organizations that want to combine developer feedback, SDLC data, and AI measurement in one structured program.
Limitations: DX’s full feature set, including surveys and measurement frameworks, takes time and configuration to roll out across teams. Its AI-code attribution is most detailed for tools with native integrations, such as Claude Code, Copilot, and Cursor; other tools rely on less precise detection.
Comparing options? See our guide to DX alternatives.
Faros AI is built for enterprises whose engineering data is spread across cloud, on-premises, custom, and legacy systems. It connects these sources through a unified data model, so you can analyze teams, services, workflows, investments, and delivery outcomes without requiring every group to adopt the same tools or processes.
Its AI capabilities focus on both measurement and enablement. Token Intelligence traces AI spending to the work and outcomes it supports, while AI Transformation analyzes how coding tools and agents affect engineering productivity. Faros also provides AI agents with organizational and technical context from its unified engineering data.
Key features:
Best for: Large enterprises that need to analyze engineering and AI performance across complex organizational structures, custom data sources, and mixed deployment environments.
Limitations: Faros AI’s flexibility comes with a learning curve. Modeling complex organizational structures and custom data sources takes configuration effort, especially for teams without dedicated data analysts.
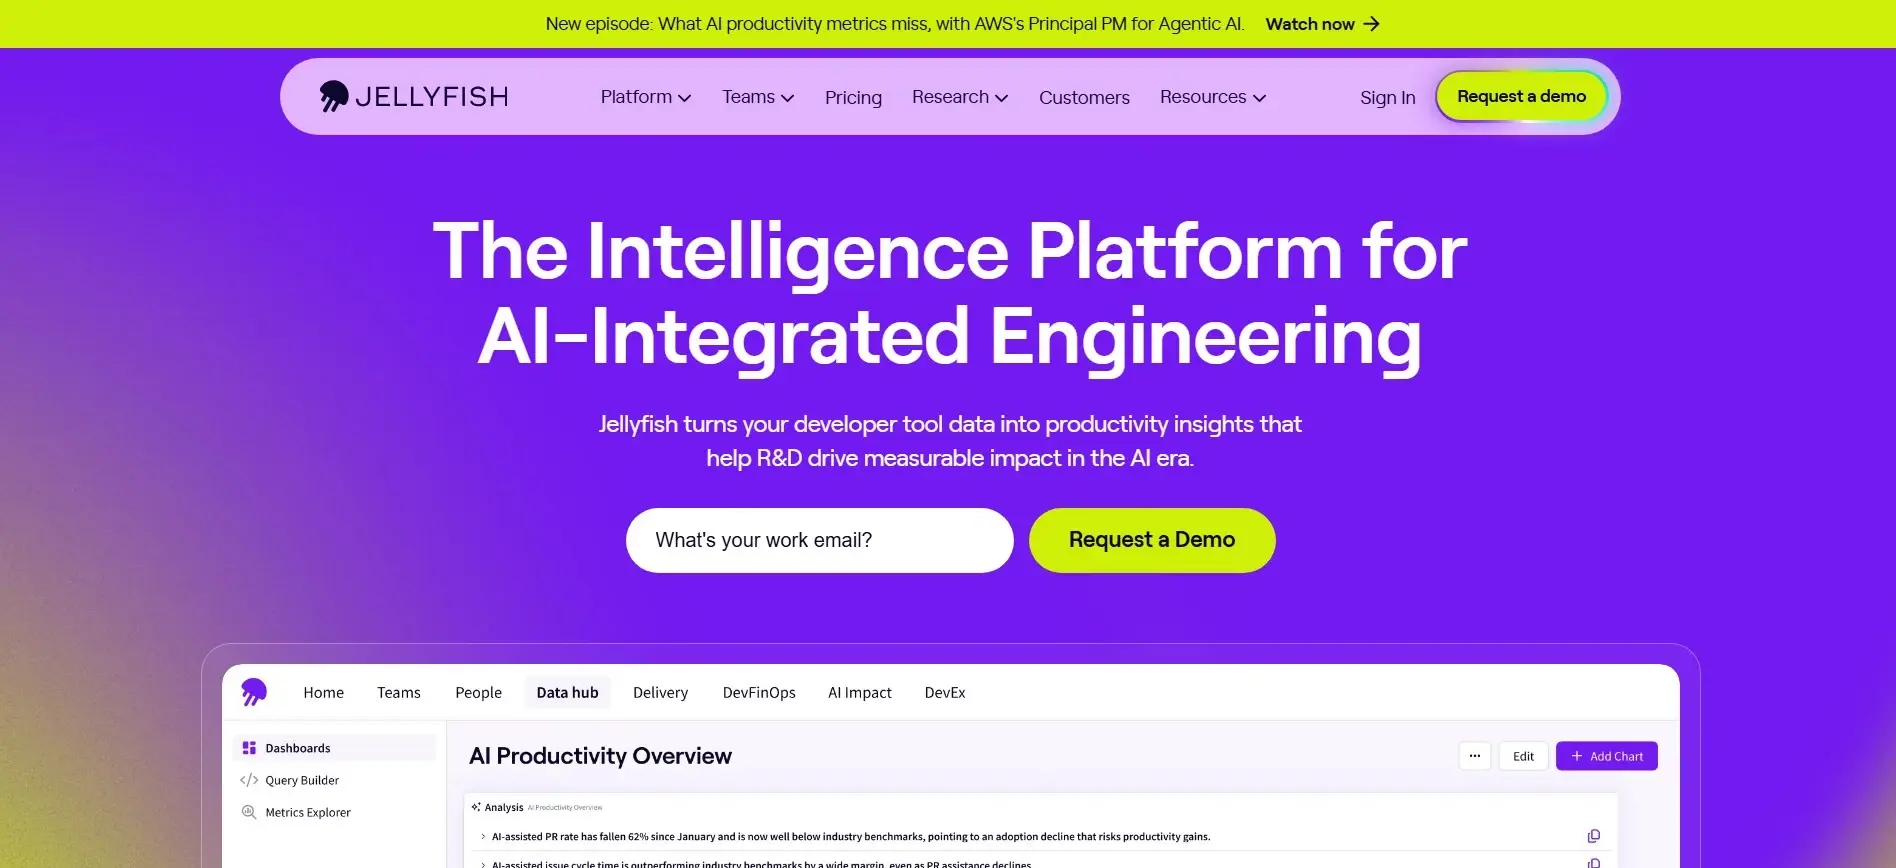
Jellyfish is an engineering intelligence platform for R&D leaders who need visibility into delivery, engineering investment, and business alignment.
It combines SDLC data with resource allocation, developer experience, and financial reporting. This way, leaders can track where effort goes, how teams deliver, and what development work costs across planning cycles.
Jellyfish evaluates AI adoption, token spending, and delivery impact across tools and teams. The platform also shows how engineering capacity supports company priorities.
Key features:
Best for: Enterprise R&D organizations connecting engineering operations with finance, investment decisions, and business planning across large, complex engineering portfolios.
Limitations: Jellyfish’s allocation model depends on linking Git activity to Jira issues, so work that isn’t linked to a ticket is harder to attribute. Its organizational hierarchy can also add setup overhead for companies with fluid team structures.
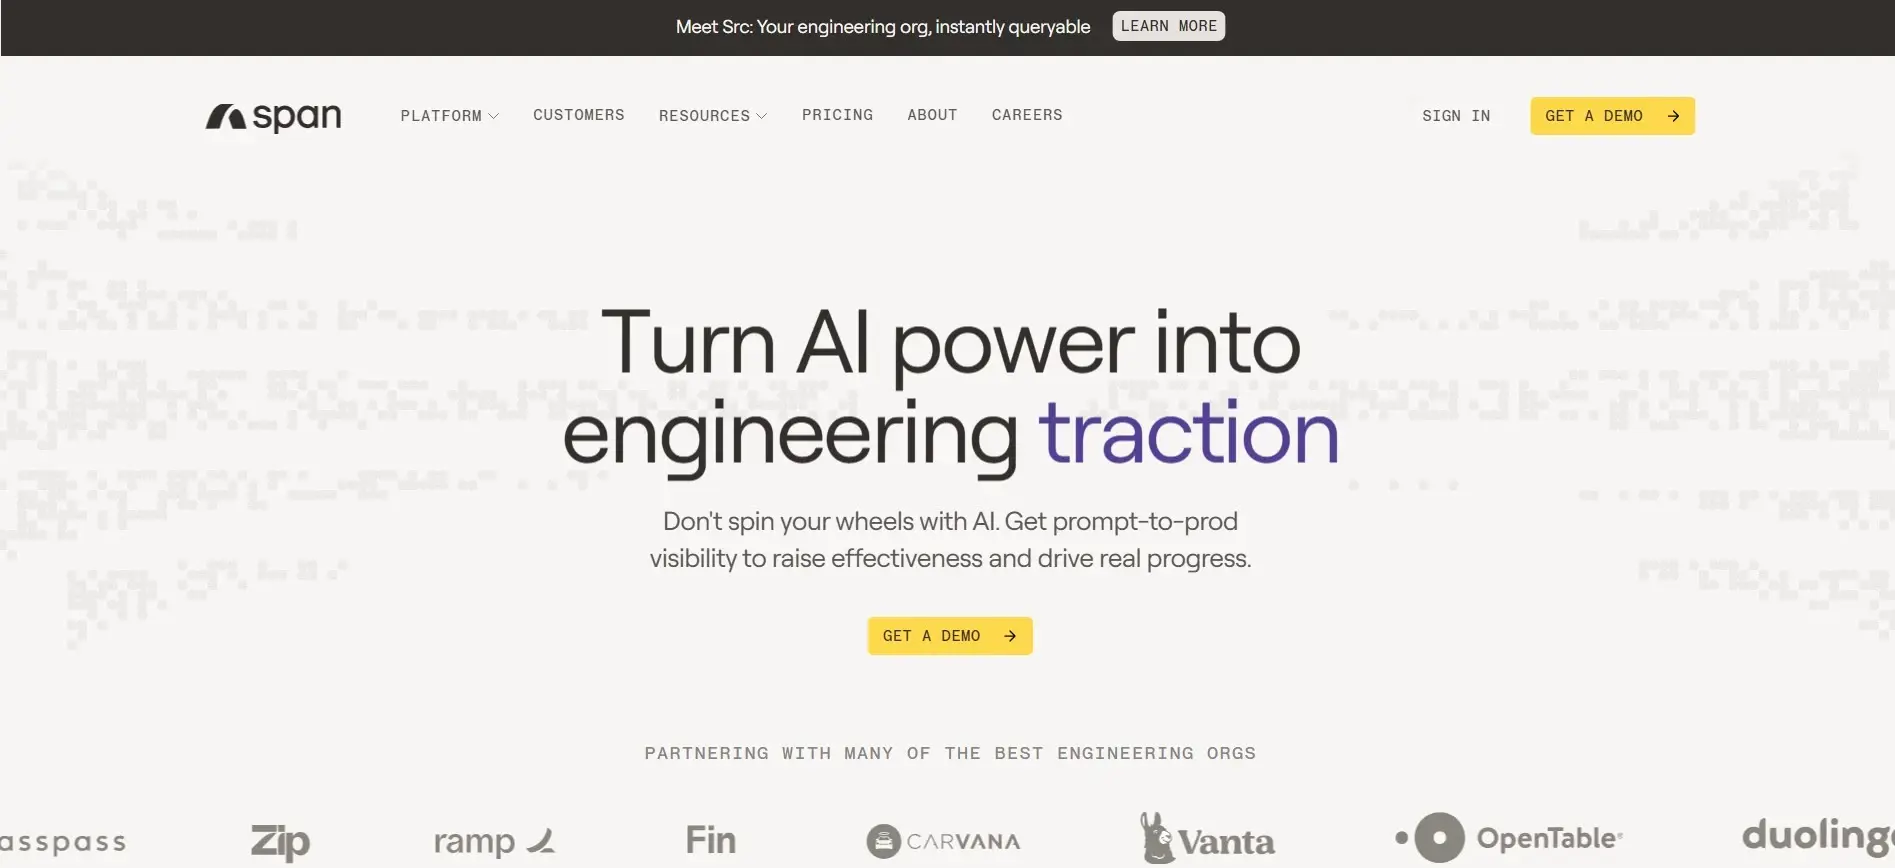
Span focuses on the work performed by AI coding agents, not just whether developers have access to them. It analyzes agent traces and connects individual sessions with pull requests and shipped outcomes. This helps you see which agents produce useful work, how much that work costs, and where it creates additional review, rework, or quality concerns.
Span combines this agent-level observability with broader developer intelligence. You can compare AI usage and spending by team, tool, model, or contributor while reviewing engineering flow, investment allocation, and developer experience across the same organization.
Key features:
Best for: Mid-market and enterprise R&D teams evaluating AI integration across agents, code repositories, and delivery outcomes.
Limitations: Span's AI-code detection (span-detect-1) works from metadata and code-chunk analysis instead of deep longitudinal code tracking, which limits visibility into AI-related technical debt over time and across multi-tool AI ecosystems. Agent observability also depends on trace data from connected AI tools, so depth of insight varies by which tools a team has integrated.
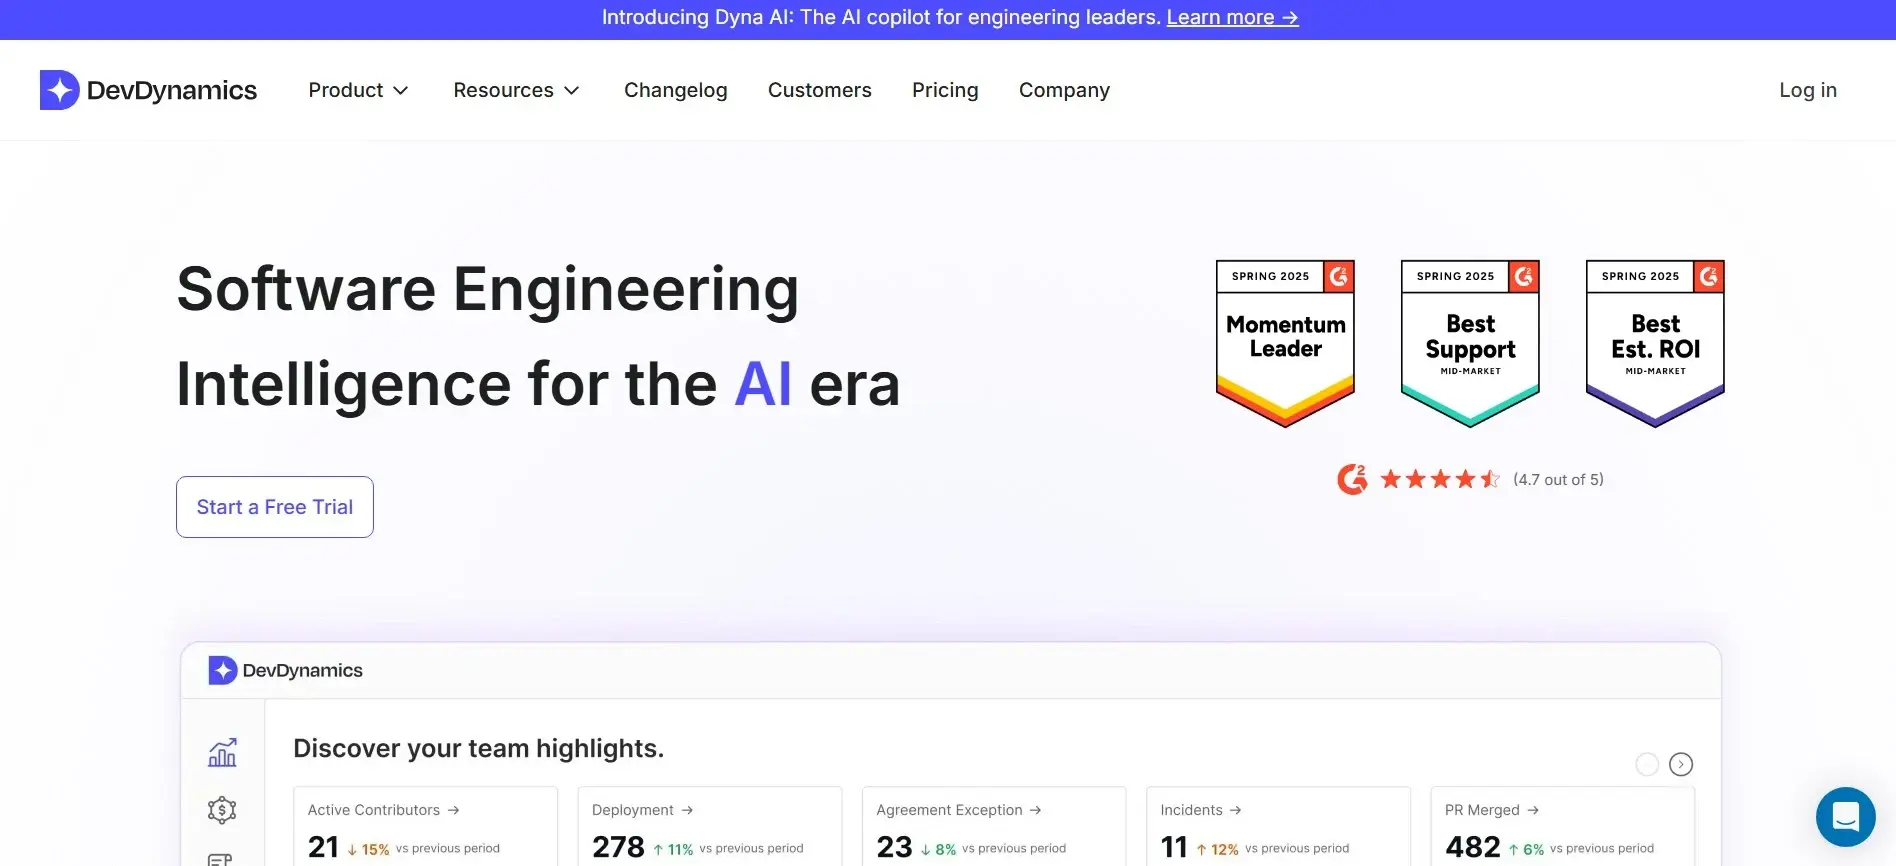
DevDynamics is a software engineering intelligence platform for engineering managers, product leaders, and delivery teams. It brings DORA metrics, AI Impact, surveys, delivery forecasting, and workflow data into role-based dashboards.
Managers can use predictive analytics to estimate initiative, epic, and release completion from historical engineering data. Dyna AI adds natural-language answers and Gen AI reports based on connected development systems.
Key features:
Best for: Small and mid-market engineering organizations combining delivery measurement, forecasting, and structured improvement programs across multiple software repositories and CI/CD platforms.
Limitations: Its delivery forecasts depend on consistent historical data, so teams with irregular ticket hygiene will get less reliable estimates. Team setup and contributor mapping also need attention during onboarding.
Swarmia connects engineering metrics with team-level improvement practices. You can examine cycle time, review time, batch size, deployment performance, engineering investment, and developer experience, then use Working Agreements and automated notifications to address recurring workflow problems.
Its AI features connect adoption and cost data with delivery and quality metrics. Swarmia tracks supported coding tools by person and team, helping you see who uses each tool, what it costs, and whether adoption coincides with better pull-request and delivery outcomes. Additional tools can be connected through its API.
Key features:
Best for: Software organizations seeking team-level metrics and feedback loops across code repositories and issue trackers.
Limitations: Swarmia’s AI tracking covers a set of supported coding tools; other tools need to be connected through its API.
Comparing options? See our guide to Swarmia alternatives.
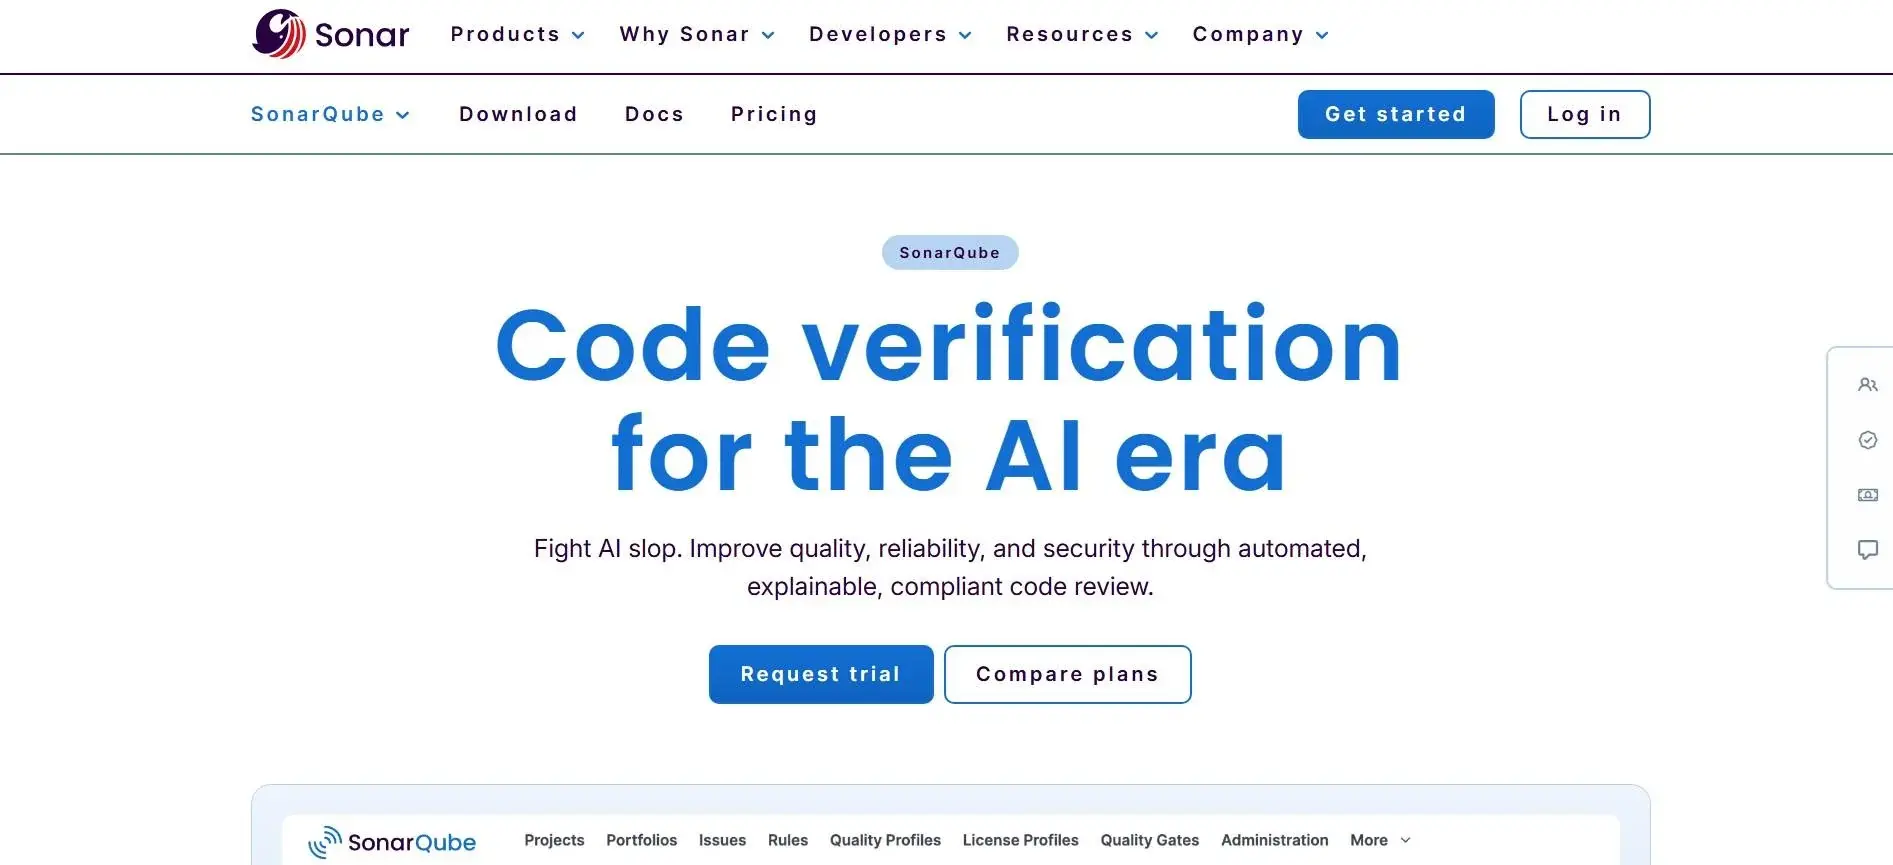
SonarQube is a code-quality and application-security platform rather than a full engineering intelligence system. It analyzes human- and AI-generated source code in IDEs, pull requests, repositories, and CI/CD pipelines to detect bugs, vulnerabilities, code smells, and maintainability problems before release.
Its AI Code Assurance feature applies a strict quality gate to projects containing AI-generated code. AI CodeFix addresses a different part of the workflow: it uses an LLM to propose context-aware fixes for issues SonarQube has already identified. Developers can review the suggested changes before applying them.
Key features:
Best for: Development and DevOps teams that need automated code-quality and security checks for both human- and AI-generated code.
Limitations: SonarQube analyzes source-code quality and security. It does not provide broad delivery-flow, engineering-investment, AI-adoption, or developer-experience analysis. Also, a first scan on a mature codebase can surface a large number of issues, so teams usually need to tune rules and quality gates before rolling it out widely.
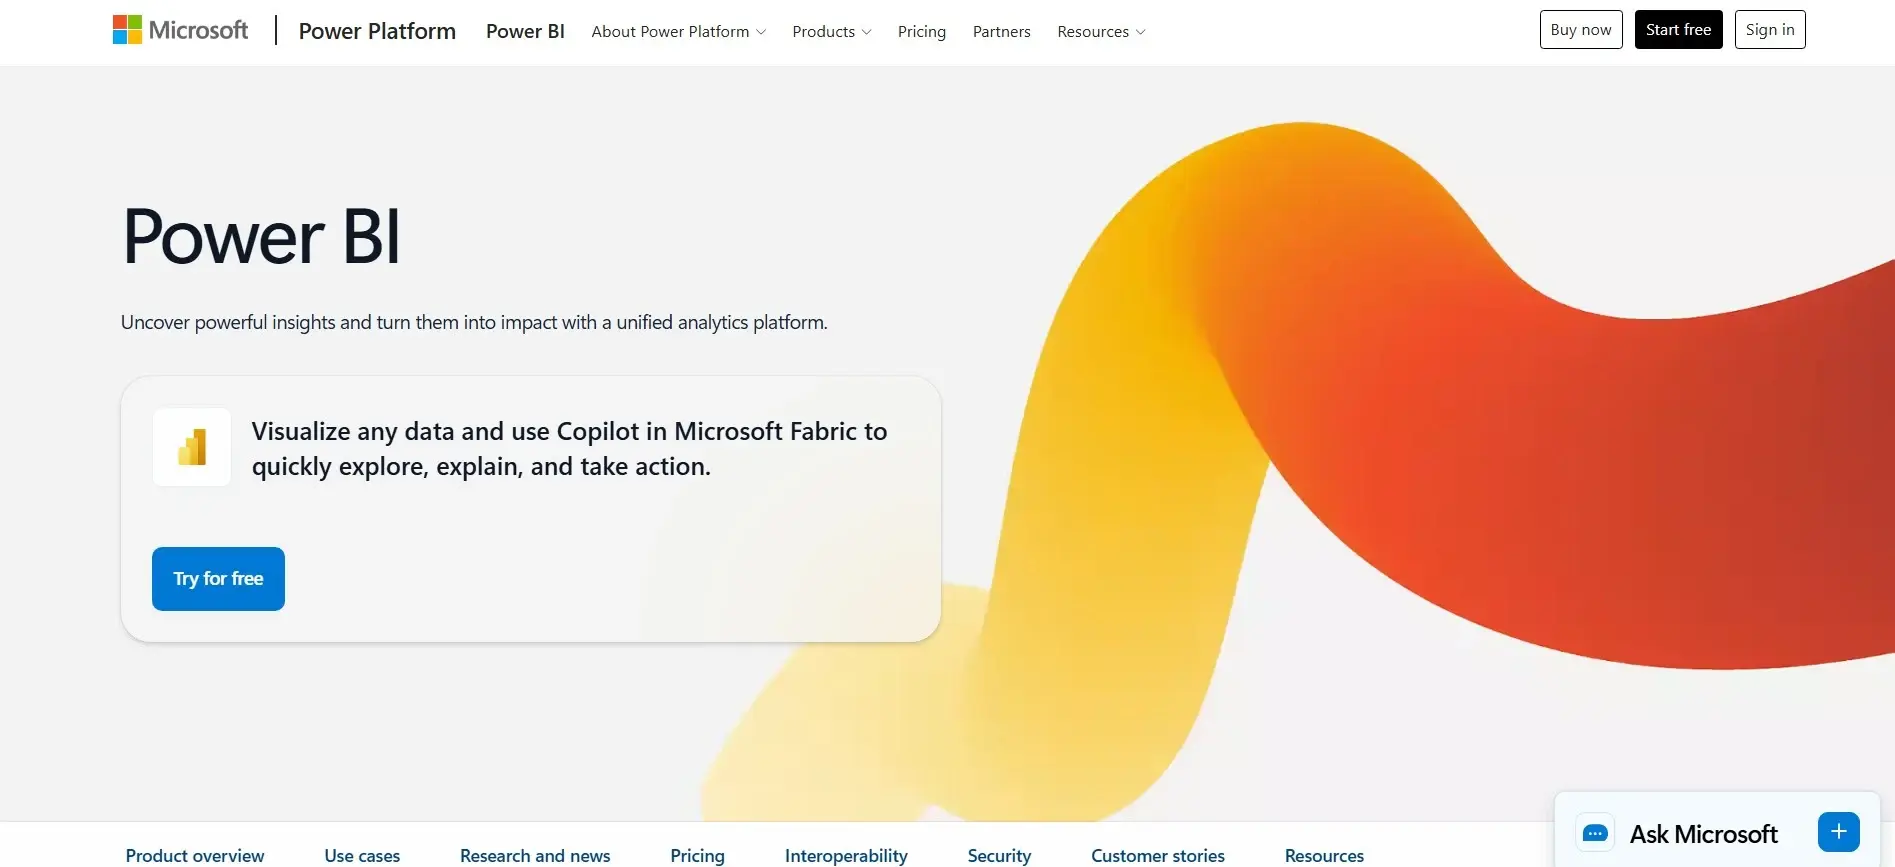
Power BI is a general business intelligence platform that can be adapted into a DIY software development analytics tool. Data teams can combine Azure DevOps Analytics with Jira or Git data obtained through APIs, databases, files, or third-party connectors.
Forecasting and anomaly detection can support delivery planning when reliable historical data is available. Also, reports can be shared with engineering, product, and business stakeholders through Microsoft Teams, PowerPoint, and SharePoint.
Key features:
Best for: Teams with internal BI expertise seeking a lower-cost, customizable engineering reporting option.
Limitations: Power BI has no native engineering intelligence model. Your team must build and maintain DORA, DevEx, investment, and AI-impact reporting internally. Microsoft’s standard Azure DevOps connector is also limited to Boards data, so broader reporting generally requires OData queries or additional data pipelines.
Software development analytics helps leaders move from isolated metrics to specific delivery decisions. The goal is to identify where work slows down, test whether an intervention improves the system, and understand the tradeoffs between speed, quality, cost, and business outcomes.
Software development analytics combines data from issue trackers, source-control platforms, code reviews, CI/CD pipelines, and incident-management systems. This lets you break cycle time into stages and see whether work spends most of its time in planning, development, review, testing, or deployment.
Review these patterns at the team, service, or product level. Comparing developers by commits or completed tickets produces weak conclusions because task complexity, review responsibilities, and operational work differ.
Once you identify a constraint, establish a baseline and compare the same metric after making a targeted change. For example, you could compare median review time before and after introducing reviewer rotation.
Use comparable reporting periods and account for changes in workload or task type. A shorter review time after the intervention supports further investigation, but it doesn’t prove that the process change caused the entire improvement.
Faster delivery is only useful when quality remains stable. Review deployment frequency and cycle time alongside change failure rate, rework, incidents, and technical-debt allocation.
If deployment frequency increases while failed changes and rework also rise, your team may be moving work downstream faster without improving the delivery system. Looking at speed alone would hide that tradeoff.
Engineering metrics become more useful when you compare them with product and customer outcomes over the same period. For example, you can examine whether a change in deployment frequency coincided with changes in support volume, feature adoption, or customer-reported defects.
Treat these comparisons as decision signals; they’re not always proof of causation. Revenue and renewals should also remain at the product or company level because pricing, sales cycles, market conditions, and contract timing extend beyond the engineering organization.
Once you have reviewed the tools, evaluate the strongest candidates against the same criteria. The best platform should answer the decisions your engineering organization makes and produce data that teams trust.
Here's what you need to consider.
The broadest metric catalogue is not necessarily the most useful. Choose coverage based on the problem you need to investigate:
Metrics should also be available at the team, application, service, or product level. Company-wide averages can hide meaningful differences between delivery systems.
Check whether the platform connects the systems where engineering work happens, including source control, issue tracking, CI/CD, incident management, developer surveys, and AI code review tools.
More integrations don’t automatically produce better analysis. The platform should connect related records so you can follow an issue through its pull request, deployment, and production outcome. If those systems remain separate, your team will still need to reconcile the data manually.
Pro tip: Test your production toolchain during the evaluation. Don’t base the decision on the number of integration logos on the vendor’s website.
Ask how the platform calculates every metric you plan to use. The definition should explain:
You should also be able to trace a metric back to its source records. During the pilot, manually compare a sample of issues, pull requests, and deployments with the platform’s calculations. This catches integration and mapping problems before leaders begin using the reports.
Engineering analytics should support team-level improvement, not rank individual developers. Commit counts, lines of code, and completed tickets do not account for task complexity, review work, mentoring, or operational responsibilities.
Check whether the platform lets you:
A technically accurate dashboard can still damage trust if leaders use activity data as an individual scorecard.
A platform that uses AI to summarize a dashboard is not necessarily capable of measuring AI adoption or impact.
For adoption, look for active use, frequency, acceptance data, interaction volume, and cost by tool, model, or team. For impact, check whether the platform connects those signals with cycle time, pull-request size, review time, rework, quality, and deployment stability.
The strongest platforms let you compare:
DORA’s research describes AI as an amplifier, meaning its effect depends on the delivery system around it. That’s why purchased licenses, estimated hours saved, or AI-generated code volume don’t show whether work reached production faster or required more downstream review.
Software development analytics platforms may process repository metadata, issue content, employee identities, and AI-usage data. Confirm:
Permissions should match each user’s responsibilities. Broad administrator or repository access increases exposure when the analysis does not require it.
Scalability includes more than processing a larger number of records. The platform must also represent reorganizations, changing service ownership, and portfolio-level reporting without rewriting historical results.
Check how the platform handles:
Historical work should remain associated with the structure that existed at the time. Otherwise, a reorganization can appear as a performance change.
Compare the total cost over the first 12 months rather than looking only at the advertised seat price. Include:
Confirm whether pricing is based on active contributors, total seats, teams, modules, or a company-wide fee. Apply each model to your expected usage instead of comparing list prices directly.
Finally, run a pilot with representative teams and services. Define the question it must answer, the data it needs, and the decision you will make from the result before the pilot begins.
The best platform depends on the decision your current data cannot support:
Choose Axify when you need to manage AI adoption as an engineering investment rather than another tooling rollout. Its AI Adoption and Impact feature shows how teams use different tools and whether that usage improves delivery. AI cost tracking connects those results with spending, while Axify Intelligence identifies the bottlenecks limiting adoption or impact and recommends the next actions to take. Value stream mapping helps you see where those effects appear across the broader delivery system, and Axify MCP lets you investigate live engineering data from a compatible AI assistant.
Pro tip: Before evaluating any platform, establish a delivery baseline. Start with Axify’s free cycle time calculator to identify where work currently slows down, then use that result to define the question your chosen platform must answer.
Want to see how AI adoption, cost, and delivery compare across your own teams? Book a demo of Axify.

A software development analytics tool evaluates how engineering work flows and performs, while Jira records and manages tasks, backlogs, and projects. Analytics platforms typically combine Jira data with code repositories, CI/CD systems, and incident tools to reveal delivery trends and bottlenecks.
Your engineering team is ready when it uses development tools consistently, has reasonably reliable workflow data, and agrees on a specific improvement goal. Start with a small pilot if ticket hygiene, metric definitions, or leadership expectations still need refinement.
Yes, modern software development analytics tools can estimate the ROI of GitHub Copilot, Cursor, and similar assistants. They compare adoption and spending with cycle time, throughput, rework, code quality, and developer feedback, although attribution requires consistent baseline data.
Start with DORA metrics, cycle time, throughput, work in progress, and change failure rate. Establish a baseline before adding specialized developer metrics, then investigate trends at the team level rather than using isolated numbers to evaluate individuals.
Responsible analytics platforms protect developer privacy by emphasizing aggregated team trends, role-based access, and transparent metric definitions. Organizations should tell developers what is collected, restrict individual views, and avoid using activity counts or AI-generated code volume as performance scores.