


.png?width=60&name=About%20Us%20-%20Axify%20(2).png)
%20(2).png?width=60&name=Icons%20-%20Lookalike%20Axify%20(44%20x%2044%20px)%20(2).png)
%20(1).png?width=60&name=Icons%20-%20Lookalike%20Axify%20(44%20x%2044%20px)%20(1).png)
Delivery Performance
14 minutes reading time

See exactly how AI impacts your team's performance.
-3-1.png?width=60&name=Icons%20-%20Lookalike%20Axify%20(5)-3-1.png)
AI decision partner helping engineering leaders with actionable insights.
Real-time tracking and insights into DORA metrics.
Detailed visual maps of your entire software development process.

Help development teams monitor and benchmark their productivity.
Improve your software engineering with accurate metrics tracking.
Set inspiring objectives and track their progress.

Are we improving? Are we better than we were in the last sprint? Should we change our approach? I can’t recount the number of times I’ve been asked those questions as a Scrum Master. And I was never satisfied with the answers I would give to directors, managers, or even VPs. But, of course, I can feelthat we are progressing and getting better, that our process is more efficient and robust. But communicating with gut feelings should not be our standard for reporting progress.
How can I, as an Agilest, make sure that the higher-ups see the value of adopting Agile as we strive to be the best in our field? Lean manufacturing and the DORA research program inspired me to go back to basics. And it all starts with measuring your process! Below is my journey to get some basic metrics on the quality of our process and my humble advice on improving those key performance indicators.
Here’s my rule of thumb when trying a new habit: start with the easiest thing. If you want to start measuring your development process, start with data you already have on hand. How long does it take for a story, a task, or Post-it to go from in-progress to done or deployed? As Agilest, we should try to reduce cycle time in our process. It’s an indicator of how things are going on the job. Here’s a small experiment that could help you get started.
If you use a project management tool like Jira or Azure DevOps, you can directly access data on your cycle time in your dashboards. If you’re not there yet, here’s a simple way to start measuring cycle time.
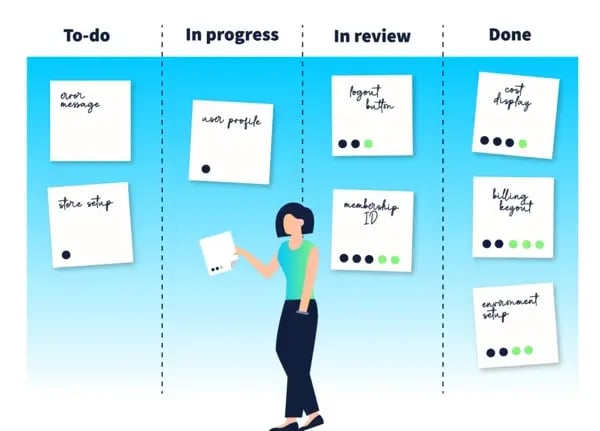
You can then crunch the data by counting the dots for each colour on each Post-it note. The result will be your basis to calculate the average cycle time for a given period (a sprint, a week, or whatever makes sense to you).
Cycle time can help you better communicate the progress you’re making with the team and stakeholders. It’s an excellent high-level indicator of your average dev team velocity and process, all other factors being equal. In general, you want a stable or decreasing trend for cycle time. So if you observe your cycle time increases, it can act as a trigger for action.

If you see an increase in the average cycle time during your sprint, dig deeper! Here are some questions to help you understand what’s going on:
But cycle time alone isn’t enough to assess the quality of your process. This brings us to throughput!
Now that we measured cycle time let’s zoom out and look at team throughput. This performance indicator is dependent on your team’s context. Throughput is the number of work items processed over a given period. It’s simple enough to gather data for this one. Let’s say your time reference is a week: count the number of tasks that went from to-do (backlog) to done. You only have to look at the last column of your process.

Throughput is also a key performance indicator that you can observe in Jira or Azure DevOps. If you don’t use these tools,here are some key points to consider to get started:
The team’s throughput by itself is not the most helpful information you can gather. Instead, it should serve as an indicator of the team’s productivity to determine if you’re delivering more or less value to your customers over a fixed period. Many variables can influence throughput. After a while, you can even use this metric to predict your team’s capacity to deliver a project. Pretty cool, right?

Here, we are looking for a stable or increasing trend. If your throughput for a given period is lower than your average, you might want to investigate. Here are some places to start:
Cycle time and throughput aren’t the only metrics indicating the overall quality of your development process. But you’d be surprised at the level of information they can give you about your team. Confirming your gut feelings with these key performance indicators will make you more confident when you speak with directors, managers or VPs. You’ll also see the impact that your actions as a Scrum Master can have on your team!
Counting these metrics manually takes quite a bit of effort on your part. And let’s be honest, your added value is not being a data scientist for your team: it’s helping them. That’s precisely why we created Axify: a web platform that increases visibility in the software development process. It allows you to easily keep track of the key performance indicators mentioned above along with many more (we talked about a few of these metrics here).