Delivery Performance
12 minutes reading time


Calculate cycle time for tasks, tickets, or pull requests in seconds.
Cycle time in software development measures how long it takes work to move from idea to delivery. It tracks the elapsed time between starting a piece of work and delivering the finished product to your clients.
But you can also measure smaller parts of that journey. Issue cycle time focuses on one portion of the full cycle: how long a ticket takes to move through your issue tracker, usually from an active status like “In Progress” to a completed status like “Done.”
This helps you see how efficiently work moves through your development process.
But the ticket view only reflects the workflow captured in your issue tracker. It doesn’t always show the full path from idea to production. For example, an issue may be marked as “Done” before the change is actually deployed to customers.
Together, these views (cycle time as a whole and cycle time per issue) help you spot where work slows down, reduce waiting time, and improve delivery speed without pressuring developers to simply “move faster.”
You can check out this video to learn more:
This leads us to...
It’s important to track cycle time because it shows where your work slows down after it enters active delivery. That gives you a clearer basis for deciding which workflow stage to change first.
These are the main reasons to track it:
So, what’s the formula?
There are two main cycle time formulas: the one that gives you the total cycle time and the one for average cycle time. It’s also important to select the right unit of measurement for “time.”
That’s what we’ll discuss below.
Cycle Time = End Time − Start Time
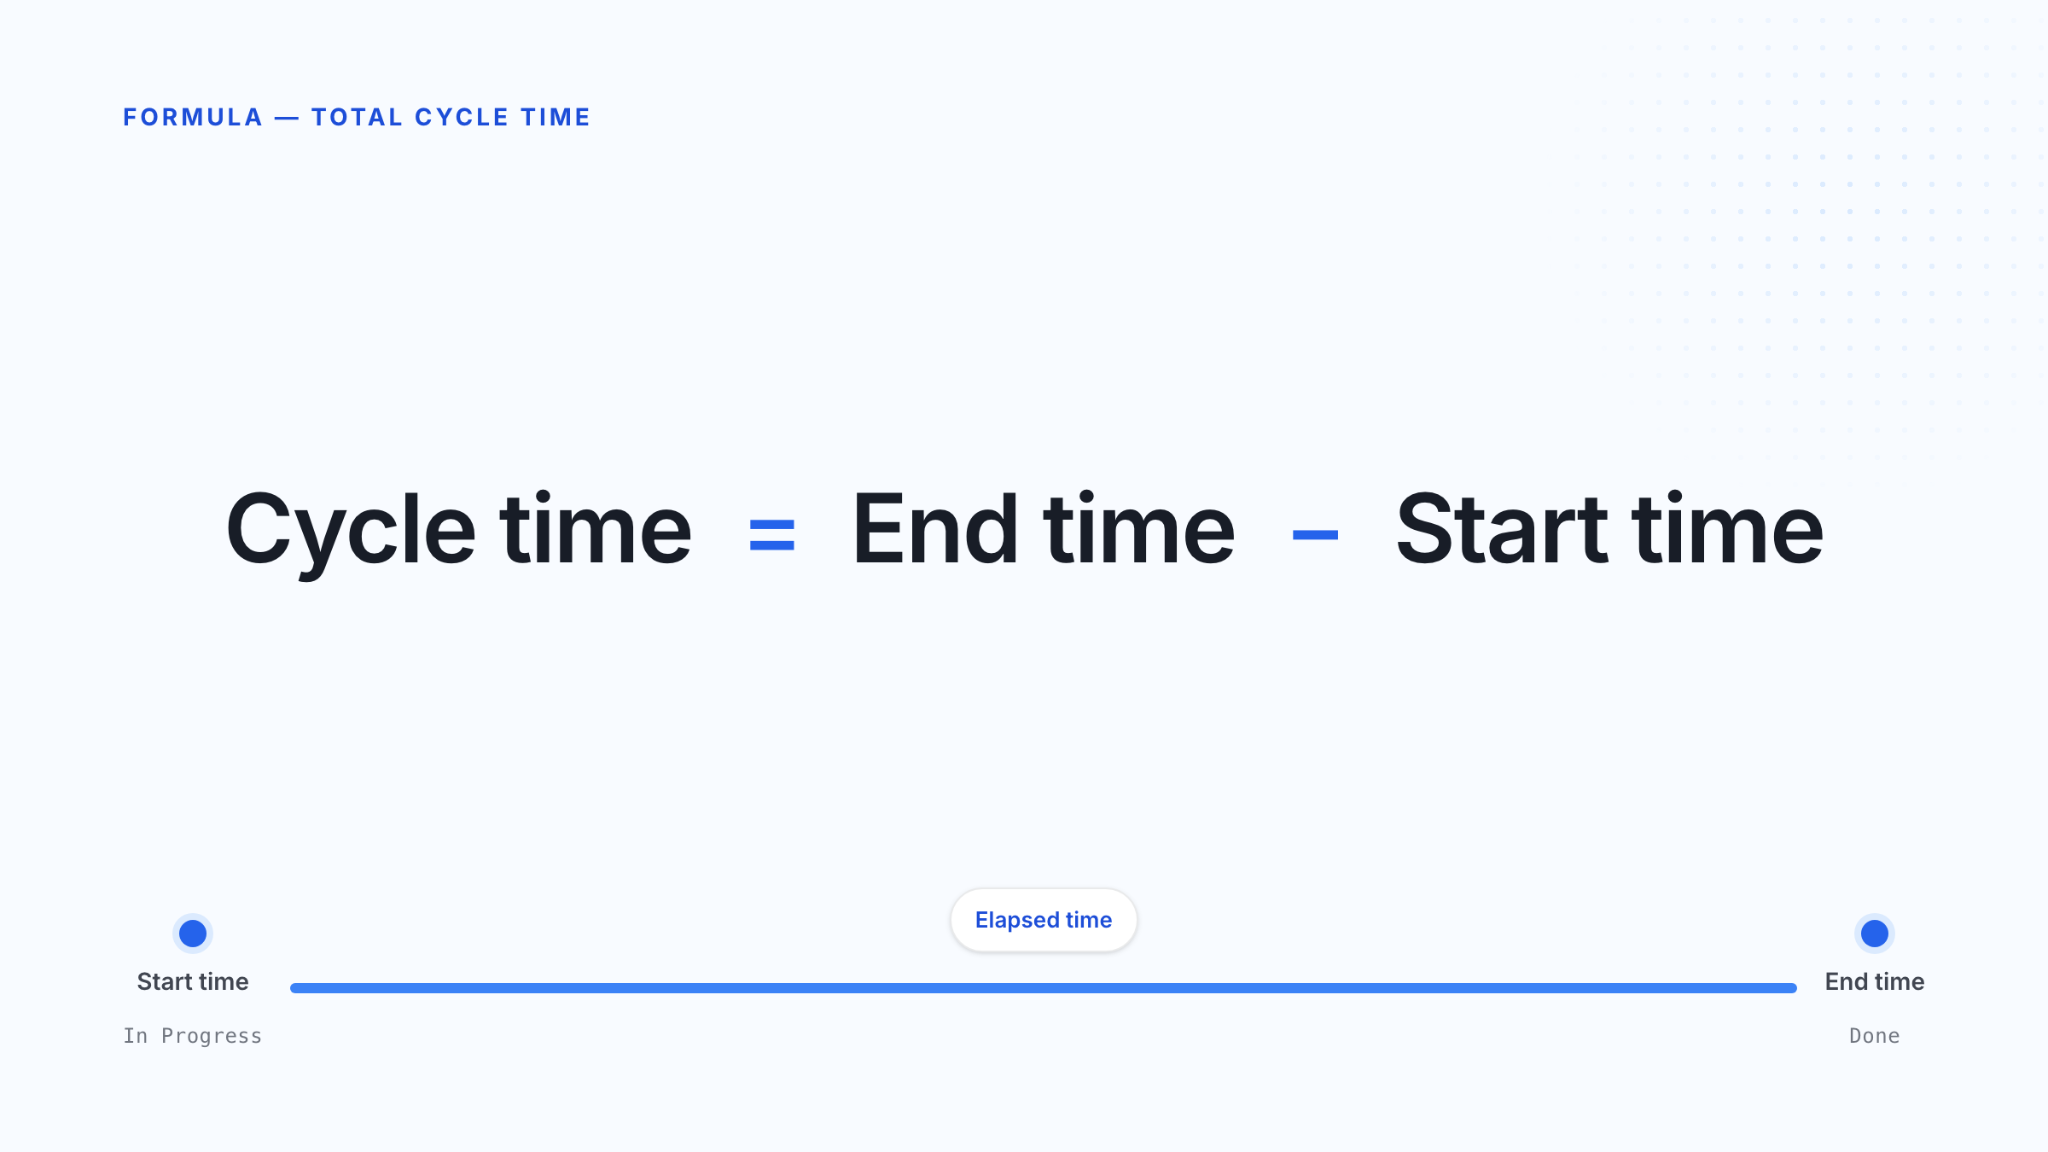
This formula measures elapsed time between two timestamps. You can use it for cycle time from ideation to delivery as well as for issues cycle time.
Let’s take a ticket, for instance. The start time may be when it moves to “In Progress,” and the end time may be when it reaches Done or Work Complete. For a PR, the start time may be when the PR opens, and the end time may be when it merges.
As such, a ticket-based result may include coding, review, QA, and blocked time. A PR-based result usually focuses on the review and merge flow.
Average Cycle Time = Total Cycle Time ÷ Number of Items
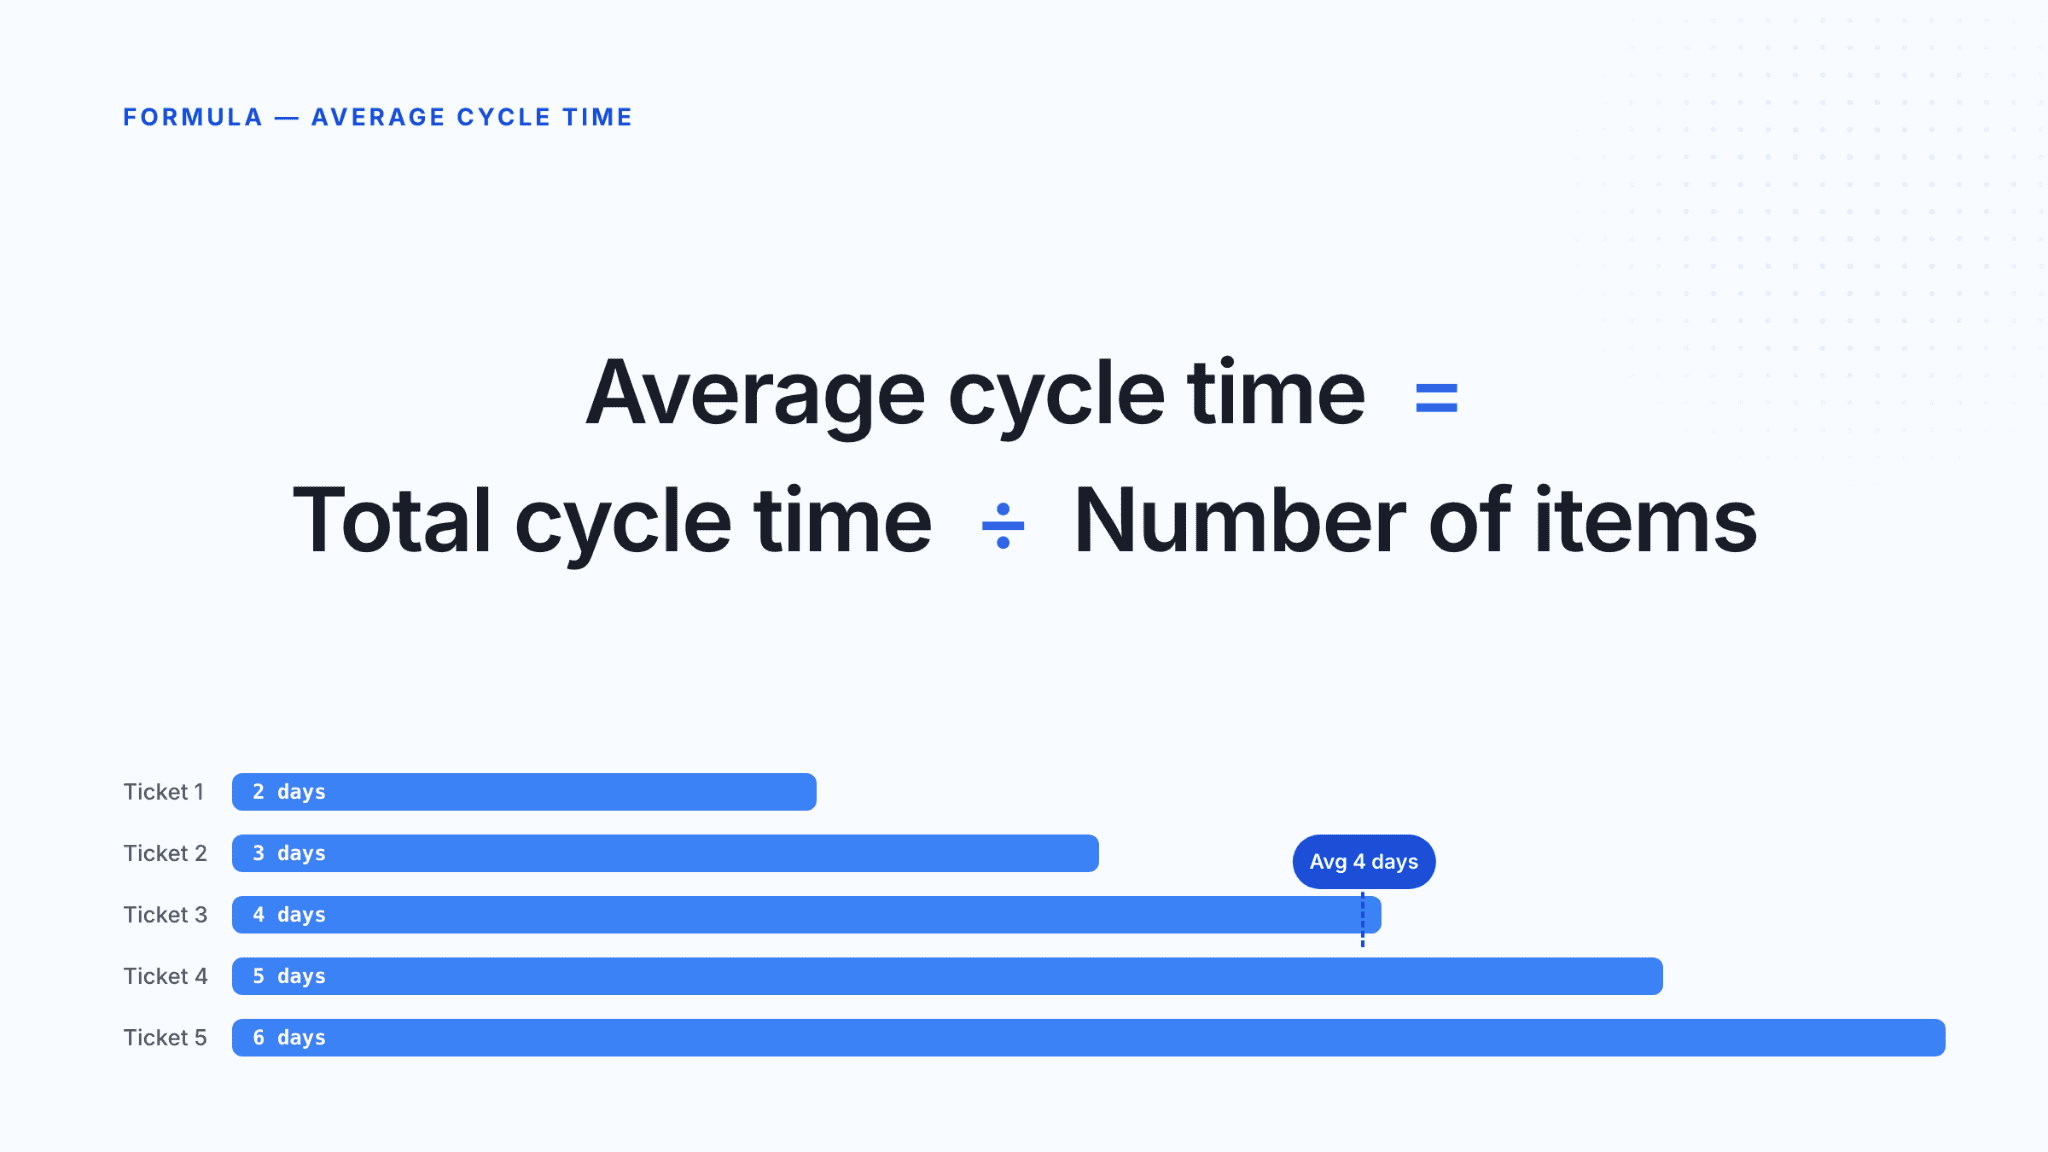
You can use this formula when you want to review several completed tickets, PRs, or issues from the same time period. For example, if five tickets took 2, 3, 4, 5, and 6 days, the total is 20 days. The average cycle time is 4 days.
That average helps you compare the same type of work over time, but it can alsohide outliers. One ticket stuck in review for 12 days can pull the average up and make the full workflow look slower than most items actually were.
The unit should match the size of the work you are measuring. Otherwise, the number becomes harder to connect to a real workflow decision. Here’s what we recommend:
Now, you might be wondering how to calculate it. Let’s cover that next.
Once you have the formula, the next step is choosing timestamps that match the workflow you want to measure. These are the steps you should follow if you want to measure cycle time using a cycle time calculator, which relies on some manual observations (we’ll discuss automated tracking in a second).
Start with the point where work becomes active. For feature cycle time, that may be when the feature is approved for development, pulled into the sprint, or moved into an active “In Progress” state. For incident resolution cycle time, the clock may start when the incident is assigned to an engineer or when active investigation begins.
In practice, we’d avoid mixing these definitions in the same report because the result will no longer describe one clear workflow path from start to finish.
The endpoint depends on whether you want to measure PR review time or production delivery time.
If you measure feature cycle time, the item may end when the feature is released or deployed to production. If you measure incident resolution cycle time, the item ends when the incident is resolved and the system is back within the expected service level.
That distinction matters because different endpoints answer different questions. “Released” tells you when customer-facing value shipped, while “resolved” tells you when service recovery work ended.
Next, subtract the start timestamp from the end timestamp. If a feature moved into active development on Monday at 9:00 and reached production on Thursday at 15:00, the cycle time is 3 days and 6 hours.
This gives you the elapsed time, including review delays, blocked work, and waiting time. A free cycle time calculator does this subtraction automatically.
One item shows what happened in one case. Several completed items show whether review delays, blocked work, or handoff delays repeat across similar tickets or PRs.
So, calculate cycle time for work of the same type before you compare results. If you’re using a cycle time calculator, you can get these comparisons fast.
For sprint analysis, add the cycle time of all completed items and divide by the number of items. This shows the average elapsed time between your chosen start and end points for completed sprint items.
Also, use the result carefully.
If one large item sat in review for several days, check that item separately before you use the average as a team-level delivery signal for the sprint.
Using a cycle time calculator becomes harder to trust at scale, which means you may not be able to use it for accurate planning. Here’s why:
You can use Axify to track cycle time more easily. Let’s see how.
A free cycle time calculator gives you one cycle time result. Axify gives you repeated measurements across the work already moving through your Git and project tools.
Plus, Axify has a free pricing tier for one team tracking one project.
These are the main differences:
| Feature | Calculator | Axify |
| One-off calculation | ✅ | ✅ |
| Automatic tracking | ❌ | ✅ |
| Historical trends | ❌ | ✅ |
| Bottleneck detection | ❌ | ✅ |
| Team-wide insights | ❌ | ✅ |
| AI decision support | ❌ | ✅ |
With Axify, you connect tools such as Jira, GitHub, GitLab, Azure DevOps, and deployment webhooks. From there, you can track cycle time across the full workflow, including issue cycle time, PR cycle time, and total cycle time.
You need this because, for example, a Jira issue can be marked “Done” when development is done, even if the PR hasn’t been merged or the change hasn’t been deployed. So you need full visibility to avoid misinterpretation.

With Axify, you can see exact time allocations. For example, Axify can show whether work spent two days in coding, four days in review, or another period waiting before it moved through the production process.
This becomes more important once AI coding tools enter the workflow. After all, AI tools tend to shorten coding time, but increase ideation or maintenance phases.
Axify’s AI Adoption and Impact feature compares delivery patterns before and after AI tools are used. With it, you can see whether cycle time actually decreases or whether delays move from coding into review, QA, or rework. And yes, it’s included in the free pricing tier.

Axify Intelligence adds the decision layer on top of that data. If cycle time increases because tasks sit in review, it can surface the bottleneck, explain likely causes such as slow pickup time or large PRs, and recommend actions like review ownership or WIP limits.
That helps you act on cycle time data without turning it into individual scorecards.

Cycle time helps you understand where your delivery time is actually spent.
A single task can reveal one workflow issue, multiple tickets can show a repeatable sprint pattern, and a pull request can expose review delays before they slow down delivery. A typical cycle time calculator may not be able to give you such a detailed breakdown as you will see below:
For a single ticket, start with one item and one workflow path.
This result means the ticket spent 54 elapsed hours between active start and completion. If your team uses business hours instead of calendar time, the number will change, so the rule needs to be consistent before you compare tickets.
In the image below, Axify’s issue cycle time shows issue cycle time at 2d 8hrs and breaks the work into In Progress, In Review, and QA. This helps you see whether the delay came from active development, review waiting time, or validation.

Once you calculate one ticket, the next step is to calculate several completed tickets from the same review period. For example, if four tickets took 1 day, 2 days, 4 days, and 5 days, the total cycle time is 12 days. The average cycle time is 3 days.
That result helps you discuss planning in Agile development without treating one unusual ticket as the full team pattern. If one item waited in QA for several extra days, you should inspect that ticket separately before using the average in a sprint report.
The Axify cycle time breakdown chart fits here because it shows cycle time across multiple weeks and splits each period by workflow stage. This lets you see whether the average changed because work stayed longer in In Progress, QA, or To Deploy.

A PR cycle time example should follow the code path: PR opened → review starts → PR merged.
For example, the coding work may take 11 hours, pickup may take 7 hours, and review may take 2 hours. The total is 20 hours, but only part of that time is active review. Pickup time shows waiting before a reviewer starts.
That matters because a long PR cycle can come from review queues, unclear ownership, or large PRs. This helps you fix the workflow disruption without blaming one developer.
Here’s what that looks in Axify:

Cycle time gives you a view of how long work takes after it enters active delivery. But you need to interpret it alongside other metrics to make the best engineering decisions. A free cycle time calculator doesn’t help you interpret these metrics together, much less make engineering decisions based on them.
Cycle time measures how long work takes after it starts. Meanwhile, lead time measures how long the request takes from creation to completion and is usable by the end-user.
Lead time includes waiting before active work begins, such as backlog aging, prioritization delay, or a ticket sitting in To Do. Cycle time starts later, usually when the ticket moves to In Progress, the first commit is made, or the PR opens.
That separation matters because each metric points to a different workflow decision.
If lead time is long but cycle time is stable, the delay may sit in intake, prioritization, or capacity planning. But if cycle time is long, the delay is usually inside active delivery, such as coding, review, QA, blocked work, or deployment steps.
Here’s a video explaining more about this:
So if you’re using a cycle time calculator online, you may also want to use a separate lead time calculator to connect insights from these two tools.
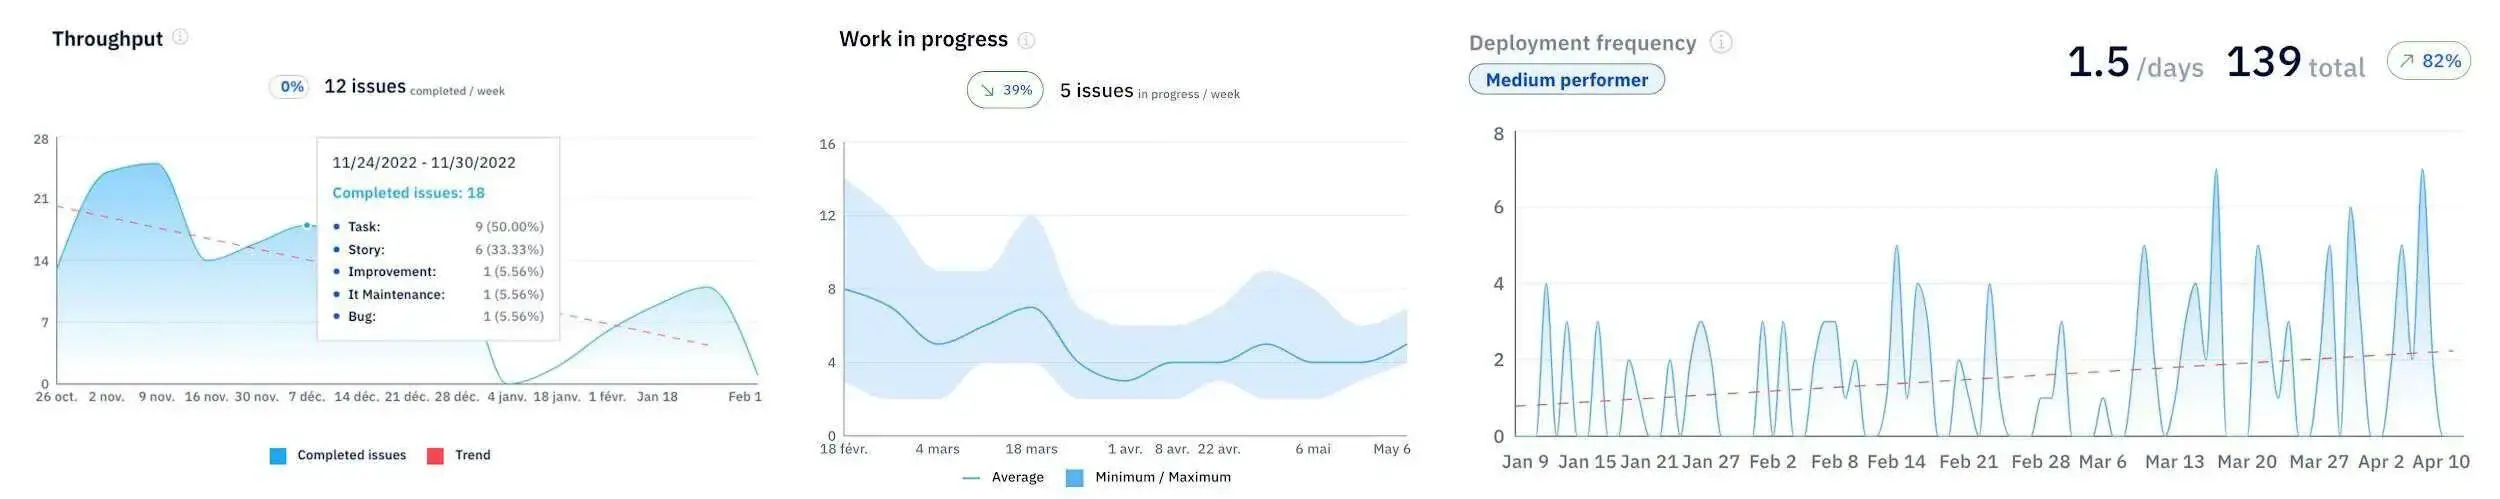
Cycle time becomes more useful when you compare it with metrics that show volume, active load, and production movement. These are the related metrics to review with it:
A free cycle time calculator doesn’t show you these metrics, but you can track them in Axify, which is also free for one team and one project:
A good cycle time is a short, consistent time range for similar work, measured with the same start and end points every time. The exact number depends on your team size, the amount of review, QA, security, and deployment work required, and product type.
A small platform team fixing internal tooling issues may finish tickets faster than a product team building regulated payment features. That does not make one team better than the other. It means the work has different review, QA, security, and deployment requirements.
So, benchmarks can help, but they should not replace your own historical data. Recent engineering benchmark data shows that the top 25% of successful engineering teams achieve a cycle time of 1.8 days.
That gives you an external reference point for short-cycle teams, but your next step is to compare similar tickets, PRs, or feature types over the same review period.
In our own practice, we recommend tracking variation first, then investigating what caused the outliers. If one ticket finishes in one day and another similar ticket takes nine days, you need to inspect which workflow stage caused the extra waiting time.
Long review queues, blocked work, unclear requirements, or repeated QA rework usually tell you more than the average alone.
Cycle time usually drops when you reduce waiting time, review delay, rework, and oversized work items. So, these are the practical changes to review first.
We’d treat AI coding agents as a workflow change rather than as just a coding-speed change.
AI can shorten the time from first commit to PR opened, but cycle time may still stay flat (or even increase) if larger PRs create longer reviews, more rework, or extra QA checks.
So, measure cycle time before and after AI adoption across the same work types. Then check whether any delays moved from coding into review, QA, or deployment waiting. You can do that with Axify, as we explained above.
Pro tip: If you want the deeper version of this topic, read our guide on whether AI coding assistants are really saving developers time.
A lot of work in progress means more active items compete for the same reviewers, QA capacity, and deployment attention. All this increases waiting time considerably.
For example, if five PRs are waiting for two reviewers, starting a sixth ticket will usually increase the queue instead of moving completed work closer to production.
That’s why we recommend limiting parallel tasks and focusing on finishing work already in progress.
Large tickets and large PRs take longer to review because reviewers need more context. They also increase the chance of follow-up comments, failed checks, and late rework.
We advise our clients to split work into smaller tickets and smaller PRs where the change can still be tested and understood on its own. This gives reviewers a narrower scope and helps completed work move through the merge and deployment steps sooner.
Code review speed improves when ownership is clear. So, assign reviewers early, set review expectations, and agree on what counts as a complete PR description.
After all, faster feedback reduces pickup time, which is the waiting period between PR opened and first reviewer action.
Lastly, use cycle time breakdowns to identify problematic stages (unusually long compared to the pattern, for instance). Do this before changing your team process. For instance, if work waits longest in QA, review policy changes will not fix the main delay.
Try to automate repeated checks where possible, such as linting, tests, and deployment validation. That reduces manual handoffs and gives your team faster signals before work reaches later stages.
The tips above are proven to work, but only if you choose the right one according to your needs.
A free cycle time calculator won’t be able to help you with personalized suggestions, like our engineering intelligence assistant.
As we explained above, this tool helps you see the exact causes of your increased cycle time, based on your work history. Then, it gives you recommendations to improve it and helps you implement them straight from the platform, like so:

A cycle time calculator helps you understand the formula, test start and end points, and explain one ticket or PR result clearly. But once you need to compare sprints, teams, review queues, QA delays, blocked work, or AI adoption effects, manual tracking becomes too limited.
Axify tracks cycle time across your existing Git and project tools, so you can see where work waits, which stages slow delivery, and what action your team should take next.
Plus, it helps you with direct insights and recommendations to decrease your cycle time.
Book a demo with Axify today to track cycle time automatically and turn delivery data into specific workflow decisions.

Cycle time can include weekends or only working hours, but you need one rule for every report. Calendar time shows the full elapsed delay. Working hours show delivery time during your team’s active schedule.
Code review time should be included if you want to measure how long work takes after it starts. A ticket is still in progress while the PR waits for review, receives comments, or waits to merge.
Blocked or waiting time is included in the total cycle time metric. If you remove it, you hide delays caused by missing requirements, unavailable reviewers, failed checks, or release approvals.
Active time is when someone is working on the item. Total cycle time includes active work plus waiting time, such as review queues, blocked tickets, QA delays, or deployment waiting.
Calculate cycle time across multiple teams by using the same start point, end point, time unit, and work type rules. Without that, one team may measure ticket completion while another measures deployment.