DORA Metrics
10 minutes reading time


Shipping software faster doesn’t automatically mean you’re delivering more reliably. You can deploy more often and still struggle with instability, long recovery times, or high variance in release cadence.
That’s why measuring DevOps performance matters. That’s especially true when leadership needs to understand whether delivery improvements are reflected in reliability and recovery metrics or just increases in deploy frequency without corresponding reliability gains.
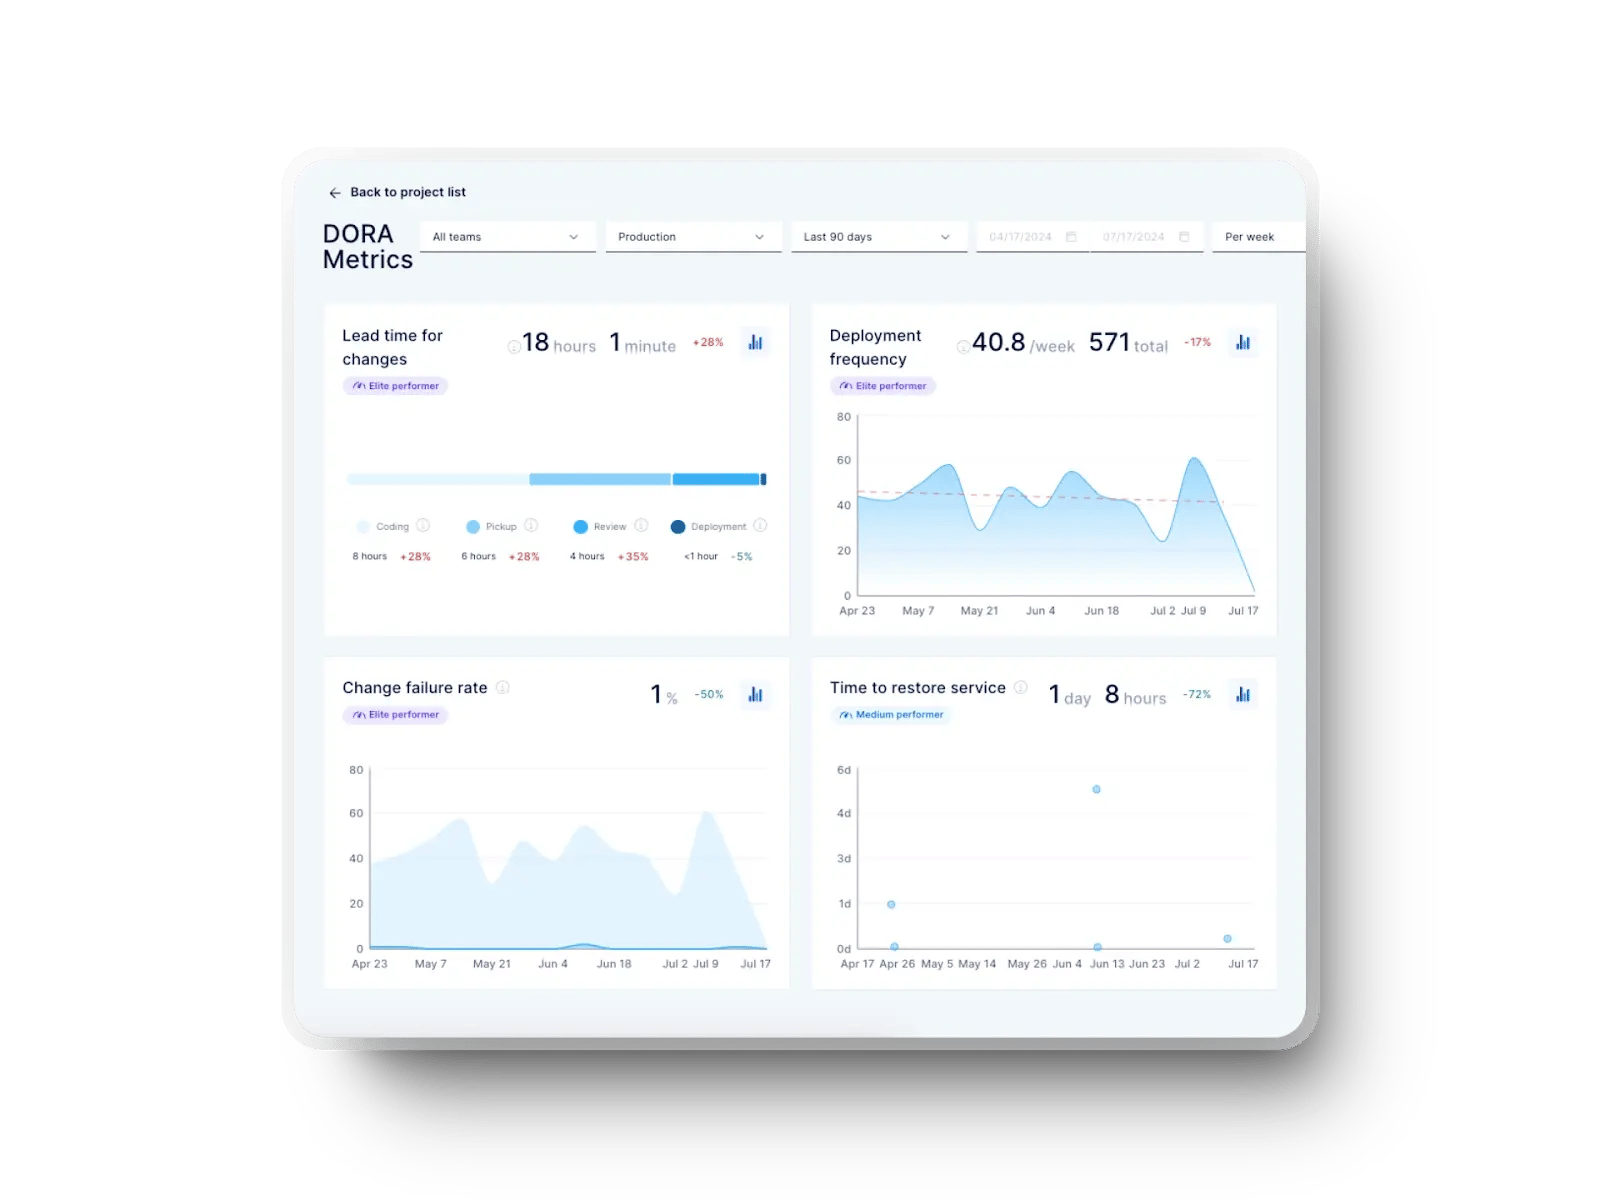
DORA metrics give you a way to evaluate delivery performance using signals like lead time for changes, deploy frequency, change failure rate, and failed deployment recovery time.
That's why this guide discusses how to implement DORA metrics step by step and use them to inform release pacing, risk tolerance, and recovery tradeoffs.
Let's get right to it!
This updated guide shifts DORA metrics from a conceptual overview to implementation guidance inside CI/CD and incident workflows. While the previous version explained what the four metrics are and why they matter, this one shows how you actually implement them inside real delivery systems.
What does that mean? You now get:
The result is a guide built for leaders who need clarity, consistency, and decision support.
Before you implement DORA metrics, you need to be clear on what each metric indicates about delivery and operational performance. These metrics should not be used to rank teams based on performance.
DORA metrics help you understand how delivery speed, stability, and recovery performance interact and whether your system can improve one without degrading the others.
The four key DORA metrics are:
Deployment frequency reflects how frequently code that has passed CI and review gates reaches production. You should treat it as a signal of commit-to-deploy throughput, rather than productivity.
Higher frequency usually means smaller batch sizes, shorter production feedback loops, and fewer risky releases. The 2025 DORA report shows top-level teams deploying multiple times per day on demand, with 16.2% reaching continuous, on-demand releases and another 22.7% shipping at least hourly.
In practice, this benchmark gives you a concrete reference point for whether your pipeline supports frequent, low-risk production deployments, or still creates approval and release bottlenecks.
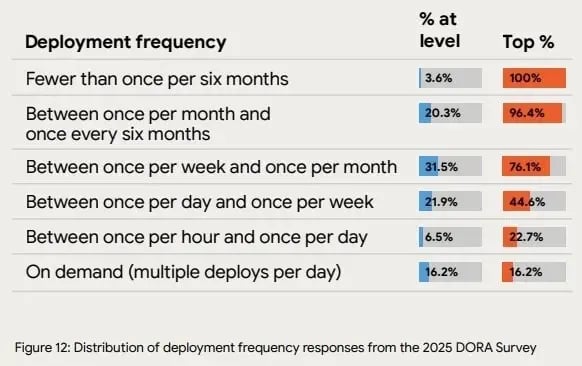
Source: 2025 DORA report
Lead time for changes measures how long it takes a code change to move from commit to production. To optimize lead time for changes, consider how quickly production feedback reaches the team and how long co confusion entre janviermpleted changes wait in review, test, or release queues.
According to the 2025 DORA report, top-level teams ship changes within one day or less, with 24.4% delivering in under a day and 9.4% pushing updates in under an hour.
If your lead time for changes is longer, check whether delays come from reviews, testing, handoffs, or release controls. After fixing the bottlenecks in the corresponding stage(s), your lead time for changes will decrease.
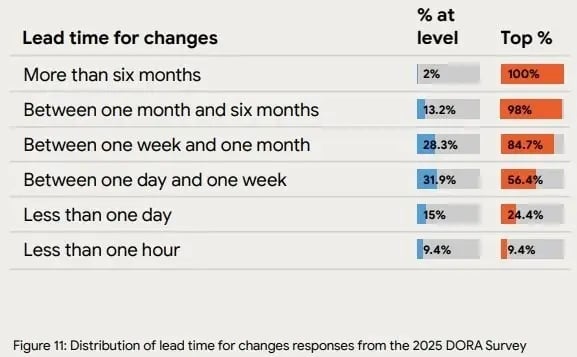
Source: 2025 DORA report
Change failure rate tracks how frequently deployments cause production incidents that require rollback, hotfixes, or remediation.
The 2025 DORA data shows that a subset of high-performing teams operate with very low failure rates, including:
From our experience, it’s best to use this metric as a delivery risk indicator, not a target to optimize in isolation.
Higher failure rates increase operational load, disrupt delivery flow, and reduce confidence in release decisions. Addressing the root causes behind those failures helps eliminate these downstream consequences.
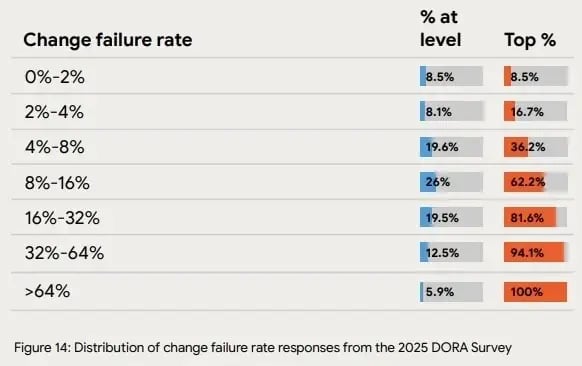 Source: 2025 DORA report
Failed deployment recovery time, sometimes called Mean Time to Recovery (MTTR), measures how quickly production service is restored after a production incident. This metric primarily reflects incident detection, ownership clarity, and recovery capability, and not necessarily code quality.
In the 2025 DORA report, 56.5% of top-level teams restore service in under a day, and 21.3% resolve incidents in under an hour.
Comparing your MTTR against these benchmarks shows whether your recovery time is outside expected ranges. If it is, you can then investigate contributing factors such as detection speed, escalation paths, or recovery automation.
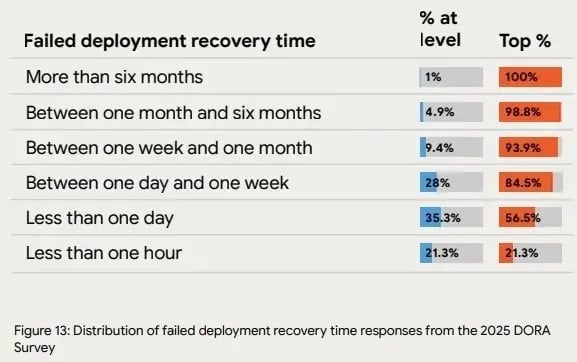
Source: 2025 DORA report
The 2025 DORA report moves away from rigid performance tiers like Elite, High, Medium, and Low.
Instead of optimizing for a category label, teams are encouraged to interpret DORA metrics in the context of their own delivery constraints and trends over time.
That way, your attention stays on the trade-off between:
Besides, teams that evaluate these signals together tend to avoid optimizing one metric at the expense of overall delivery reliability.
Teams implement DORA metrics to understand how software moves from commit to production and where delays or failures occur. Here are the primary benefits of tracking DORA metrics explained in more depth:
Research from prior DORA studies shows that organizations combining strong operational practices with disciplined measurement are 1.4X more likely to report higher software delivery performance and 1.8X more likely to report improved business outcomes.
These findings describe correlation, not guaranteed causation, but they reinforce the value of consistent measurement paired with process improvement.
One important constraint should be stated explicitly: metrics do not improve delivery on their own. Their value comes from how teams use them to prioritize work, test changes, and verify whether those changes improved throughput, stability, or recovery performance.
Implementing DORA metrics means recording the exact timestamps that show when code is committed, reviewed, deployed, and recovered after failure. Without consistent event data from your delivery systems, the four DORA metrics cannot be measured accurately or reproducibly.
The steps below show how to collect the minimum data required and turn it into metrics that can be reviewed during planning, release, and incident follow-ups.
Start by capturing a small set of events that already exist inside your engineering tools instead of attempting to integrate every platform at once.
At a minimum, integrate your measurement layer with:
From those systems, record the following timestamps:
If these events are missing or inconsistent across repositories, the resulting metrics will vary by team and cannot be compared reliably.
Warning: Expanding data collection beyond these core events too early can introduce gaps or duplicate records, which makes trend analysis harder.
By the end of this step, you should have:
Clear incident definitions sit at the center of CFR and MTTR accuracy. In fact, organizations that implement formal incident classification typically reduce MTTR by 40-60%. This happens because consistent categorization shortens triage and ownership handoffs.
So, we recommend defining incidents as events that require human intervention, disrupt service, or trigger a rollback or mitigation action. Anything that resolves automatically or never affects users should stay out of your incident dataset.
To keep classification consistent, incident categories should stay limited and outcome-focused:
At the end of this step, a written incident definition, a fixed category list, and a shared logging standard should be in place. That clarity supports CFR accuracy while improving developer experience during incident response.
Connecting tooling to DORA metrics works best when the goal is narrow: capture the events required to calculate the four metrics and automate their collection so timestamps stay accurate.
In practice, start with the systems that record authoritative delivery events, then link them using shared identifiers such as commit SHAs, pull request IDs, build numbers, and deployment IDs.
The integrations should stay simple and focused:
Accurate DORA measurement requires end-to-end automation. Manual exports and reconciliation create inconsistencies, distort timestamps, and make trend comparisons unreliable.
At the end of this setup, DevOps teams should have one continuously updated dataset that supports consistent measurement across repositories, services, and time periods.
Baselines matter more than targets when introducing DORA metrics into daily delivery operations because:
For that reason, start with at least one to three months of historical data for each metric so normal variation becomes visible.
Pro tip: Avoid cross-team comparisons at this stage. Differences in codebase complexity, on-call coverage, release controls, and compliance requirements can distort results before metrics stabilize. Premature ranking can also reduce trust in the measurement process.
Instead, evaluate trends within the same team over time. Directional improvement in lead time for changes or recovery time indicates healthier delivery performance, even when absolute values remain higher than those of other teams.
Filters should isolate teams, projects, and time ranges so results are not mixed across unrelated contexts. This separation allows teams to review progress using consistent data.
By the end of this step:
This ensures future changes are measured against the team’s starting point rather than against unrelated benchmarks.
DORA metrics create value only when trends are reviewed regularly and used to adjust delivery practices. This step helps you make specific workflow changes based on the patterns you notice in your DORA metrics.
First, review team-level trends weekly and portfolio-level trends monthly. The objective is to identify repeatable signals.
High-performing teams use a simple delivery feedback loop to keep speed and stability aligned. Rather than reacting to a single metric, they look for patterns across metrics, interpret what the system is signaling, and adjust accordingly.
For example:
This delivery feedback loop ensures that delivery metrics drive concrete changes in your delivery practices.
This is where Axify’s AI-generated insights change how teams work.
Instead of manually correlating charts, Axify continuously analyzes delivery data in the background and surfaces explanations for why metrics changed.
You can also ask follow-up questions directly through an AI assistant that provides context-aware recommendations based on real delivery behavior.

What is the difference between Axify Intelligence and a regular AI agent or LLM?
Unlike generic LLMs, this AI agent understands your context and workflow. It can give you informed, actionable insights based on your situation.

Remember: Decision triggers, action owners, and review rituals should be clearly defined. That structure reflects DevOps best practices and keeps metrics tied to execution.
DORA metrics influence how teams act, even when they are introduced only for visibility. To avoid unintended behavior, define clearly how these metrics will and will not be used.
This approach keeps discussions focused on workflow design, ownership clarity, and risk management rather than individual output.
Organizations that review delivery metrics collaboratively tend to sustain higher performance over time. Research from Phoenix Group Strategy reports that teams with strong cross-functional collaboration are significantly more likely to reach high-performance operating levels, with measurable gains in productivity and profitability.
To support consistent behavior:
As team structure, tooling, and release practices evolve, metric definitions and data sources must be checked periodically.
Schedule recurring reviews to confirm:
This periodic validation prevents outdated definitions or broken integrations from distorting delivery decisions.
DORA metrics are useful only when they are calculated from the same systems that record commits, builds, deployments, and incidents. The practices below focus on turning DORA metrics into reliable inputs for delivery decisions, protecting teams from misuse, and ensuring the data reflects actual release activity.
Automated data collection reduces reporting errors and keeps metric calculations consistent across teams and time periods. Manual tracking often remembers events late, applies inconsistent definitions, or misses incidents that were resolved quickly.
For that reason, collect DORA data directly from the tools that already record delivery activity.
Platforms such as Axify connect to systems like Jira, GitLab, Azure DevOps, CI/CD pipelines, and incident management tools to capture:
With these events captured automatically, teams can review DORA trends during sprint reviews or incident follow-ups using the same definitions across all repositories and pipelines. That makes it easier to link specific workflow changes, such as new test gates or release controls, to measurable shifts in delivery performance.
A single, centralized dashboard prevents fragmented conversations. The dashboard should show all four DORA metrics together, filtered by team, service, or time range. And access should be open to engineers, managers, and leadership.
When everyone sees the same signals, conversations shift from finding numbers to fixing flow. This is a core habit in high-performance organizations.
For mobile teams, the moment a release is technically ready does not always match the moment users receive it. After a build is deployed, Apple App Store or Google Play review and approval can delay public availability by several hours or days.
If deployment frequency or lead time is measured using the store release date, those metrics will include external approval delays that engineering teams do not control.
To avoid this, define the production event as the final internal distribution step, such as:
In other words, you will measure completion when the engineering team completes the release, not when the marketplace approves it. As a result, DORA metrics reflect delivery performance that your team can actually influence.
Surface DORA metrics in the same meetings where your team makes delivery decisions, sprint reviews, retrospectives, and operational check-ins. That way, changes in DORA metrics can be evaluated using current data.
Pro tip: Metric decomposition supports this analysis.
For example, Axify separates lead time for changes into coding time, pickup delay, review time, and deployment stages. Viewing these segments independently allows teams to determine which step in the workflow is contributing most to the overall delay.

As such, you can investigate and address the cause most likely to affect that particular stage in the SDLC. That’s how you improve flow and stabilize outcomes across all four metrics.
By comparison, evaluating lead time for changes as a single aggregated value doesn’t provide the same level of insight.
Continuous delivery works when batches stay small and frequent. So, try to set explicit expectations for PR size, limit parallel work, and require large changes to be split before merge.
Smaller batches reduce risk, shorten lead time, and make rollbacks routine. When delivery stays incremental, all four DORA metrics improve together instead of trading off speed for stability.
Adoption needs clear ownership. Because of that, assign one or two advocates per team who already influence delivery decisions, such as a tech lead or EM. Their role is practical: explain metric definitions, flag misuse early, and bring feedback into retros. This keeps everyone focused on fixing flow issues.
Implementing metrics fails when numbers turn into targets. We recommend explicitly stating that DORA metrics are not used for individual evaluation. Goodhart’s Law applies quickly when numbers affect compensation or rankings. Keeping the metrics system-focused preserves honest signals.
Metrics matter only when they inform business decisions. Connecting lead time to release predictability, change failure rate to customer risk, and recovery time to operational resilience turns DORA from a reporting tool into a strategic control system.
This shift allows leaders to evaluate trade-offs between speed, stability, and roadmap commitments with greater confidence.
Retrospectives are where learning happens. Discussing DORA metrics here helps people understand system behavior. That framing keeps discussions productive and helps DevOps teams improve without blame.
Standardization is what makes DORA metrics comparable and usable across an organization. Without shared definitions and collection rules, the numbers turn into local artifacts that cannot support planning, incident review, or investment decisions.
Below is a practical way to standardize DORA metrics without flattening meaningful team differences.
Standardization begins with writing down exact definitions and applying them across all teams. This step sounds obvious, but most breakdowns happen here.
At a minimum, document and align on the following:
DORA metrics were built to assess system performance and not individual developers’ productivity. So, measurements should take place at the system level, such as a deployable service, a production application, or a bounded platform component.
Avoid comparing individuals with their coworkers. Once metrics are attached to people, behavior shifts away from delivery quality to assigning blame.
Consistency requires shared inputs. Pick one source per event type and apply it across teams:
Do not let teams substitute local tools without mapping events back to the same logical sources. A deployment in one system must mean the same thing as a deployment in another.
Trend analysis depends on identical time frames. So, you should define standard rolling windows, such as 30 days, 60 days, or 90 days.
All teams should be evaluated using the same windows at the same time. Mixing calendar months with rolling windows introduces artificial shifts caused by window boundaries, which can be misread as a real performance change.
Product teams, platform teams, and infrastructure teams release and operate software under different constraints. If you compare their DORA results directly without accounting for those differences, the conclusions will be misleading.
Standardization means calculating DORA metrics the same way across all teams, while adjusting how results are interpreted and compared.
In practice, this can include:
The key rule is simple:
Use the same formulas everywhere, but compare results within a similar operating context.
Single data points rarely justify a change in process. A one-week spike in change failure rate or a temporary drop in deployment frequency can result from a specific release, outage, or staffing change.
So, review DORA metrics as trends across multiple sprints or release cycles.
Reviewing trends shows whether failure rate, incident volume, or rework is increasing, decreasing, or remaining stable across multiple sprints.
Absolute values differ between systems, so progress should be evaluated by comparing each team’s current performance against its own historical baseline, not against other teams.
DORA metrics only remain comparable if everyone uses the same definitions. Store each metric’s formula, data sources, and calculation rules in a single location that both engineers and leaders can access.
This location can be:
When definitions are easy to find, teams spend less time debating what a number represents and more time deciding what action to take.
Metric definitions evolve as tooling, workflows, or release models change. When a definition is updated, record:
Maintaining this history prevents misinterpretation of trend shifts that result from calculation changes rather than real delivery changes. Without version tracking, teams may treat a reporting change as a performance regression or improvement.
DORA implementations usually fail because of how metrics are used, not because of tooling limitations. The issues below appear early and reduce the reliability of the signals if they are not corrected.
DORA metrics should be used to identify constraints in the delivery workflow, not treated as targets on their own. Reviewing a single metric in isolation hides where work is actually delayed.
In practice, teams should review deployment frequency, lead time for changes, failure rate, and recovery time together and trace changes back to specific workflow steps.
Example: Deployment frequency drops, leadership pushes for more output, but pull requests accumulate in review because work-in-progress remains high, and review capacity does not increase.
Metrics become unreliable when teams calculate them differently. If start or end points vary, reported lead time or recovery time can change even though the underlying process did not.
Using shared definitions ensures comparisons reflect actual delivery performance.
Example: One team measures lead time for changes from the first commit, while another measures from ticket creation. Leadership then debates the numbers instead of addressing delivery delays.
Incomplete or inconsistent data produces misleading results. Missing timestamps, manual tracking, or disconnected tools create gaps that prevent accurate measurement.
Collecting events automatically from source control, CI/CD, deployment, and incident systems ensures trends reflect actual delivery activity.
Example: Recovery time appears stable on dashboards, but incident resolution timestamps are not recorded consistently, so outages last longer than reported.
DORA metrics are useful only when they inform release decisions, stability expectations, and roadmap tradeoffs. When metrics are tracked without influencing priorities, improvements in one area may not affect overall outcomes.
Example: A team reduces lead time for individual changes, but release predictability does not improve because deployment windows, approval steps, or scope decisions remain unchanged.
DORA metrics are valuable when you can make engineering decisions based on them. So, the first step is to implement them correctly: connect delivery data to real workflow constraints, track trends over time, and keep metrics tied to system-level improvement.
We also discussed the importance of consistent definitions, automated data, and action-focused reviews. When all these conditions are met, DORA metrics can be used as a reliable signal for delivery speed, stability, and risk.
This level of visibility supports your most important business decisions.
Axify brings the best of both worlds: it showcases DORA metrics and has an AI assistant that makes personalized recommendations, based on your bottlenecks and questions.
Curious to learn more?
Book a demo today and see how Axify brings DORA metrics into everyday decision-making.

Deployment frequency is calculated by counting the number of successful deployments to production during a defined time period (for example, per day or per week). Each completed production deployment is counted once, regardless of the amount of code included. The metric reflects how often releases occur, not how large each release is.
Lead time for changes is calculated as the elapsed time between a code change being committed to version control (or merged into the main branch) and that change running in production.
Formula: Deployment timestamp − Commit (or merge) timestamp = Lead Time for Change
This metric shows how long work takes to move from development into a live environment.
A change failure occurs when a deployment causes a production issue that requires rollback, hotfix, or other remediation. Events that resolve automatically without user or service impact should not be counted. The definition remains tied to observable production impact.
For mobile delivery, app store approval delays can distort deployment frequency and lead time. To keep the metric tied to engineering execution, many teams treat the final internal distribution step (such as internal testing tracks or staged rollout configuration) as the production event for DORA tracking.
Yes. Small teams often see results faster because delivery paths are shorter and easier to observe. DORA metrics still highlight delays in review, release, and incident response even when deployment volume is low.
Weekly reviews allow teams to detect changes in delivery performance early. Bi-weekly reviews may be appropriate for teams that deploy less frequently. Reviews should focus on trends across multiple releases rather than isolated data points.
Common issues include incomplete data collection, inconsistent metric definitions across teams, and dashboards that are not used to guide decisions. Metrics lose value when they are reported but not connected to release planning, risk management, or workflow changes.