AI
11 minutes reading time

You probably already use AI coding tools across real development workflows, so you know that using it more can appear to signal higher productivity. And you're not alone in thinking this. In fact, the DORA 2025 report found that 90% of technology professionals used AI at work, while more than 80% believed it increased their productivity.
Yet perception alone cannot tell you whether AI-assisted code genuinely reaches production faster, reduces delivery time, or creates additional review and rework.
So, in this article, we'll discuss tokenmaxxing and show you how to assess AI token consumption alongside accepted work. You will also learn which delivery, quality, adoption, and cost metrics give you a clearer view of AI’s impact.
Let's get started!
Tokenmaxxing is the practice of treating the number of AI tokens you consume as evidence that your engineering team is productive.
In this sense, it becomes the AI-era version of lines of code. This is where you reward visible activity even when that activity says little about whether useful work reaches production.
Tokens are an input you pay for, while accepted pull requests, shorter cycle time, stable deployments, and less rework are the outputs you need to assess.
For example, an AI agent may consume twice as many tokens while retrying a task, yet still give your reviewers noncompiling code that they must rewrite. If you evaluate that session by token volume, you record high activity as success and hide the extra review time it created.
Many other guides stop at saying tokens do not equal productivity. Here, we wanted to give you something more. Below, you will find a replacement measurement system that connects AI-generated work and costs to accepted changes, delivery flow, defects, and incidents.
The term spread in spring 2026, when reports showed large tech companies ranking employees by token use. Meta's internal "Claudeonomics" dashboard ranked staff by consumption, and Meta shut it down two days after the news broke. The Pragmatic Engineer found similar token leaderboards at Microsoft and Shopify. Shopify has since renamed its board a "usage dashboard."
The backlash came quickly. By late May, Fortune reported that tokenmaxxing was over: some Amazon employees ran agents on pointless tasks to pad their numbers, and Uber used up its 2026 token budget in four months. Meta then moved toward "token-managing", with token budgets planned for 2027, and its CTO said token usage alone is not a measure of impact.
The approach replacing it now has a name: valuemaxxing. IBM and Flexera both describe it as measuring business outcomes and treating tokens as a cost. The rest of this guide shows what that looks like for engineering teams.
This leads us to our next point.
Your enterprise token bills are growing because you send more input, generate longer responses, repeat context, and use expensive models for routine work. These are the main patterns that increase your AI inference costs:
As these patterns keep repeating, you start paying increasingly more without knowing whether the generated work was even useful. So, the next question is...
Token count fails as an engineering metric because it shows you how many AI tokens your teams consume without showing whether that work is accepted, deployed, or later rewritten. Here are the main reasons why you can’t use token volume as a productivity measure:
So, the next logical thing is to learn what you should do to measure AI engineering ROI.
AI engineering ROI shows you whether AI usage and spending lead to more accepted work, faster delivery, and stable quality. To measure it, review connected evidence across the same teams, projects, and reporting period.
Here are the five measurement layers you need.
AI adoption measures whether licensed tools have become part of your teams’ regular software engineering work.
We recommend reviewing this layer at the team, project, or business-line level over a consistent period, such as four to eight weeks. Individual comparisons can mislead you because engineers work on tasks with different complexity, risk, and opportunities for AI assistance.
Axify’s AI Adoption and Impact view brings the following metrics together:
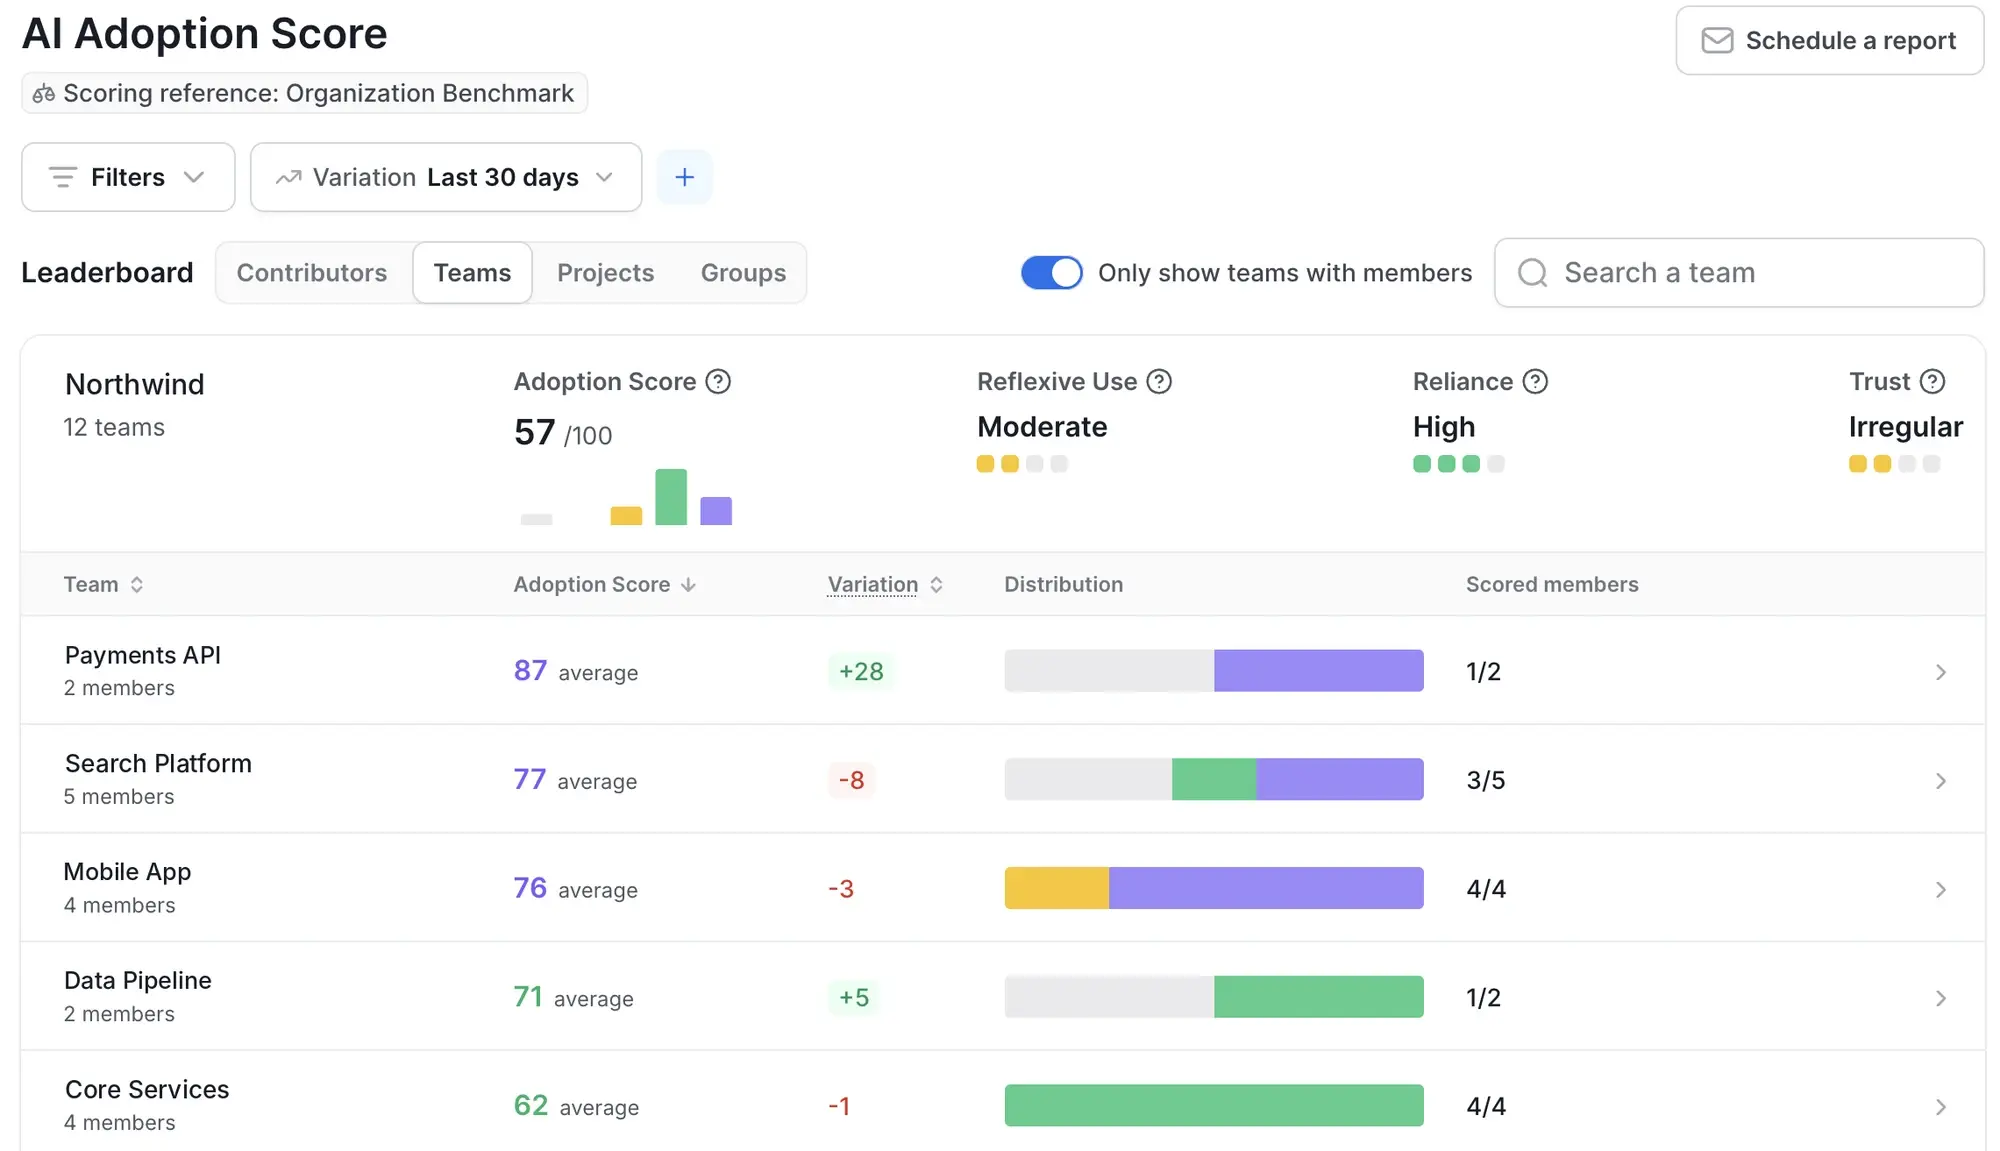
These metrics tell you where AI is present and how consistently it is used. They cannot show whether that usage shortens delivery time or reduces rework, though. That’s why the adoption dimension is just the first layer of your ROI review.
At the usage quality level, you’ll want to look at the tasks your teams assign to AI and the amount of validation those tasks require. This matters because, for example, reviewing generated tests is easier than asking an agent to change authentication logic across a legacy service.
So, your workflow review should include:
Risk level is where this gets concrete.
A randomized study from Anthropic found that the 52 engineers using AI to learn a new coding library scored 17% lower on evaluations, with no meaningful time savings. In other words, the AI generated activity without improving performance.
The lesson for your workflow review: unfamiliar or complex tasks need closer scrutiny than routine ones, because generated output there is more likely to require correction.
To measure delivery impact, you need to assess if work items move through your development system faster after AI becomes part of your workflow. Axify connects AI usage with delivery data, which lets you review adoption alongside pull request, work-item, deployment, and stability metrics.
You can include the following metrics:
We advise you to interpret these metrics together because improvements in one stage may shift work elsewhere. For example, a product team may reduce median cycle time from eight days to six over a six-week release period. Meanwhile customer support tickets connected to released defects can rise from 30 to 47 during those same six weeks.
If you see the bigger picture, you can make a good decision faster. For instance, in this case, you can keep AI for code preparation while adding review or test requirements before expanding the workflow.
Pro tip: Axify’s guide to GitHub Copilot productivity impact explains how to connect tool adoption with review, rework, and delivery results.
When you’re assessing quality impact, look at how much correction work appears after AI-generated output enters a pull request, passes review, or reaches production. Faster code creation doesn’t automatically correlate with faster review time; it can even be associated with a higher change failure rate.
So, track these metrics at the team or project level:
Use the same definition of rework across teams and keep the observation window fixed. For example, you could count substantial changes made within 14 days of a merge. If you’re using different time intervals for different teams, the rates can’t be compared fairly.
Cost efficiency connects AI spending with accepted engineering outcomes. You can review this layer by tool, team, model, and workflow so you can see where enterprise AI costs produce usable work and where expensive sessions end in discarded output.
Your cost review should include:
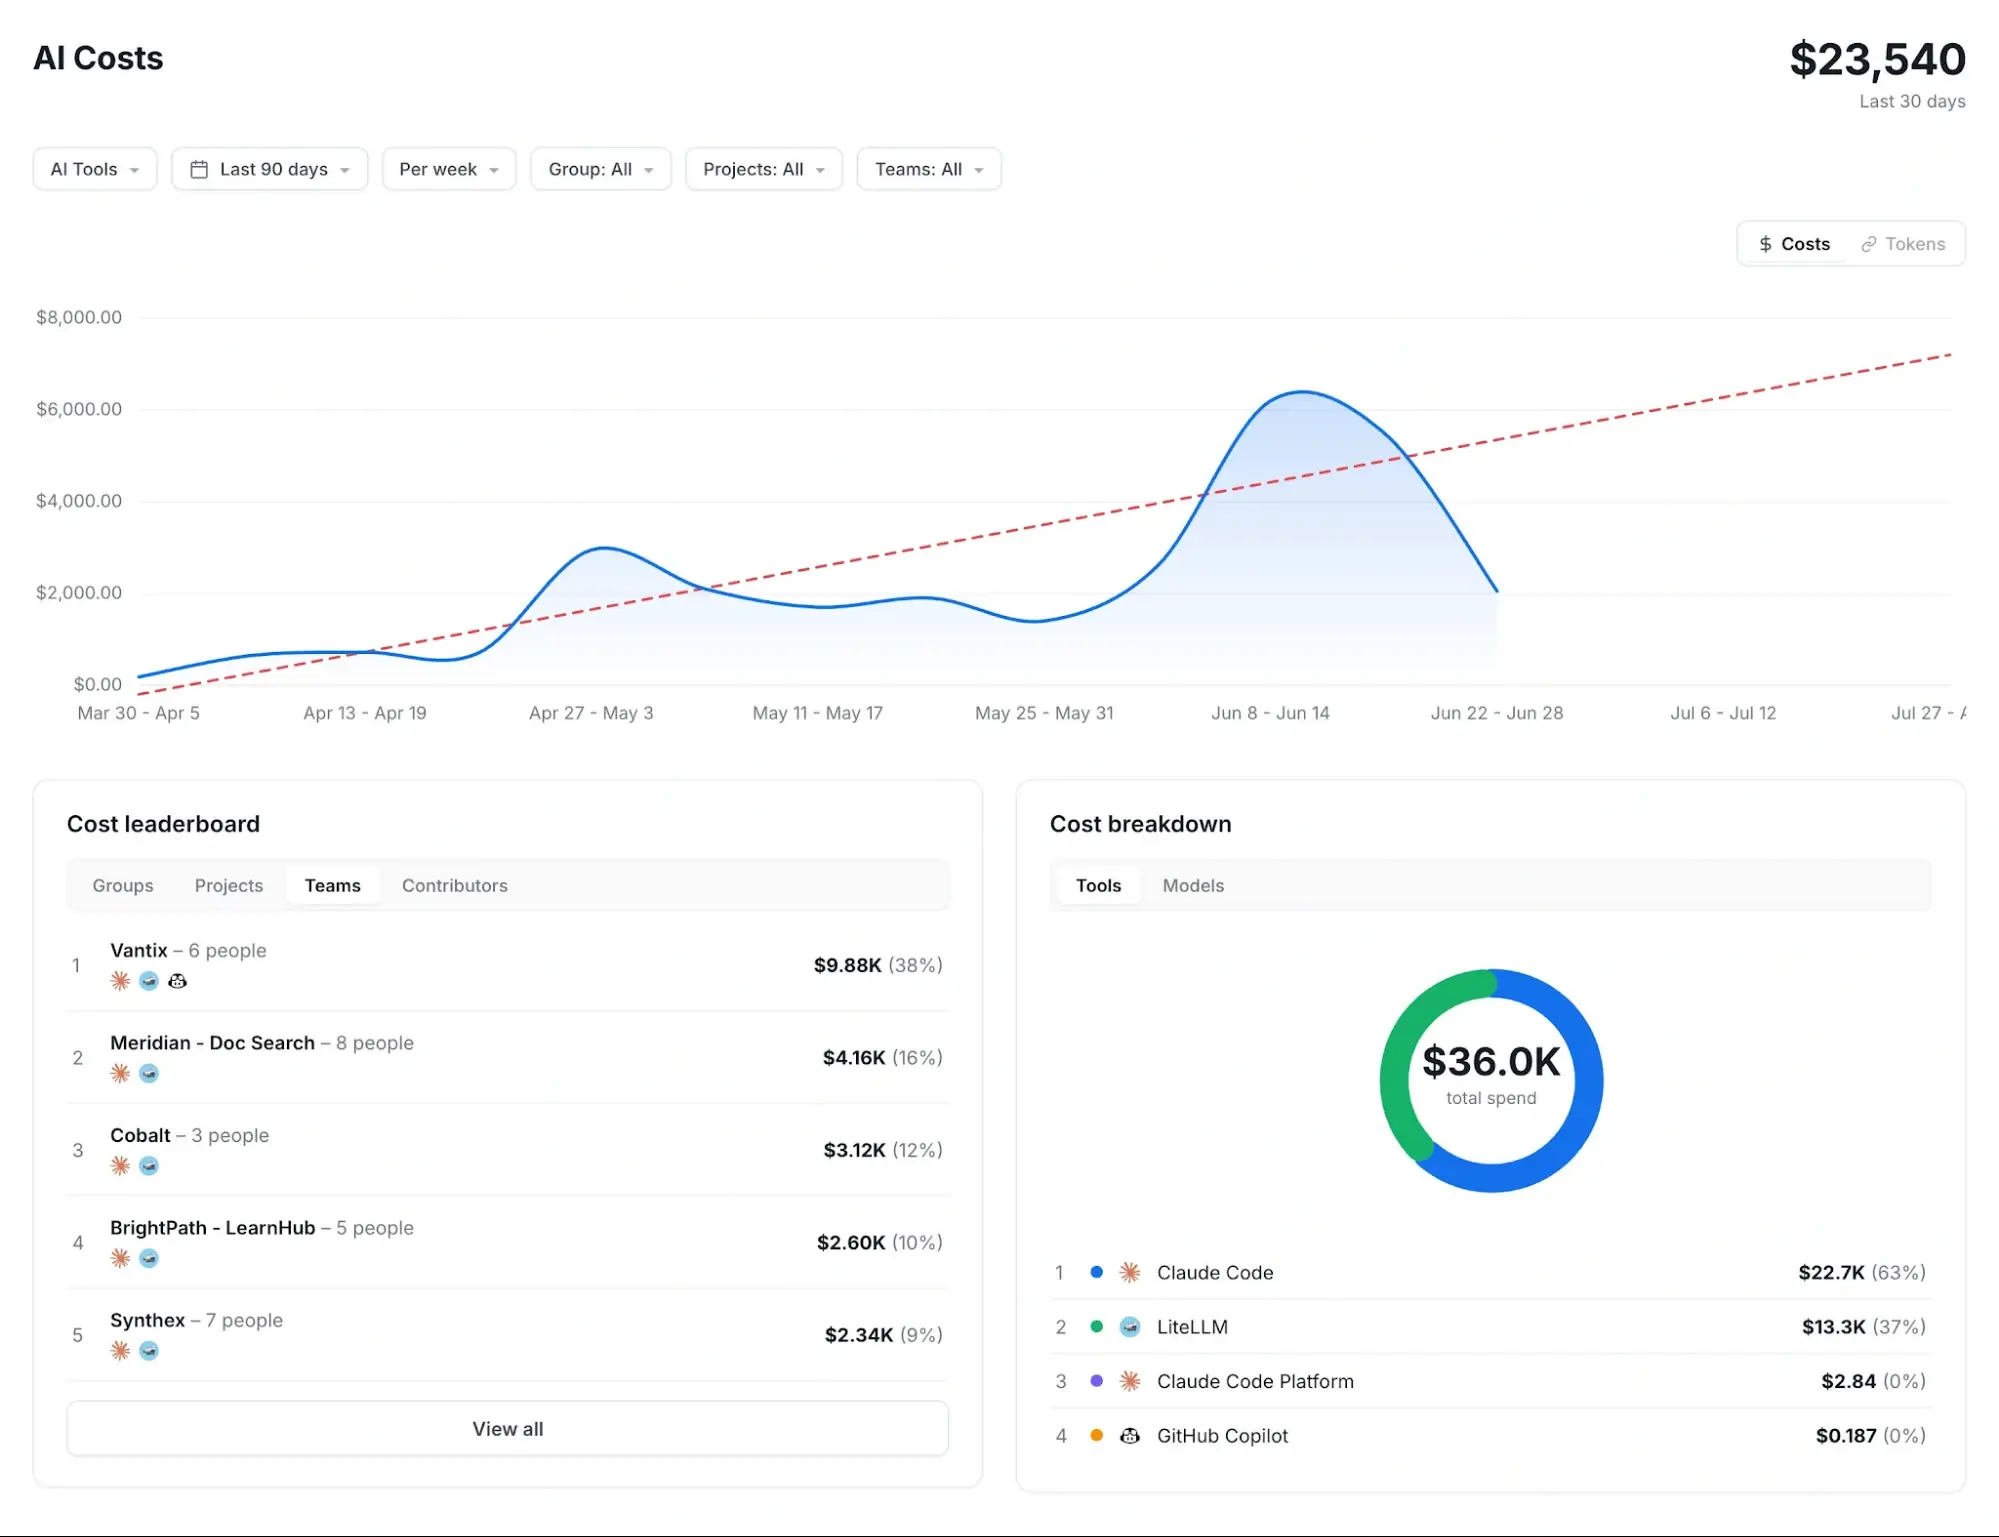
Some tools trace AI consumption and connect spending with engineering work. Axify does more: it brings AI spend, tool and model usage, adoption, and delivery metrics into the same measurement system. This lets you see whether a team's higher Claude Code spend comes with shorter cycle time, faster reviews, or more deployments.
Pro tip: For a detailed cost review process, see Axify’s guide to AI cost optimization.
We recommend measuring accepted work, delivery speed, rework, defects, and cost per completed workflow instead of token consumption.
After all, your team’s perceptions cannot replace measured results. Take, for instance, METR’s randomized trial: it found that experienced developers believed artificial intelligence made them 20% faster, although were in fact 19% slower after using the tested early-2025 AI tools.
This gap shows why you need to compare delivery data before and after implementing AI.
Here are the metrics we don’t recommend and the ones to replace them with:
| Bad metric | Why it fails | Better metric | What it tells you |
|---|---|---|---|
| Total tokens consumed | Measures your activity rather than value | Cost per accepted workflow outcome | Whether your spend produces usable work |
| AI requests per developer | Rewards your usage volume | Habitual usage by approved workflow | Whether AI helps in approved workflows |
| Lines of AI-generated code | Encourages output bloat | Merged changes with stable quality | Whether your code survives review and production |
| Acceptance rate alone | Hides your downstream rework | Acceptance, rework, and defects | Whether accepted output stays useful |
| AI tool spend alone | Excludes your delivery context | Spend by team and workflow with delivery impact | Whether your costs map to delivery results |
| Self-reported time saved | Depends on your perception | Cycle time, PR time, and DORA trends | Whether your delivery flow improved |
You can reduce AI token spend by routing each workflow to the lowest-cost model that meets its quality requirements, limiting agent loops, and removing repeated context. The goal is to cut wasted consumption while preserving accepted output.
Here are six controls you can apply:
Token data still matters when you use it to control AI costs and diagnose waste within specific workflows. When you track tokens by model, team, and task type over the same reporting period, you can identify sudden cost spikes, oversized context windows, and repeated attempts that fail to produce accepted work.
You’ll also need this evidence for model-routing decisions.
Pro tip: To set up token tracking by team, budgets, and spending limits, read our guide to Claude Code token usage.
The rule for your reporting remains “useful for AI cost optimization, dangerous as a performance scoreboard.” Token data shows you where consumption rises, while accepted pull requests, rework, defects, and delivery time show you what that spending produced.
Tokenmaxxing became the default measurement approach of AI tools because token counts were the first AI metric you could collect easily. Vendors tracked tokens to calculate your bill, so that figure started being included in leadership dashboards before anyone had built a connection between AI usage and delivery outcomes.
The problem: a token count only measures what the vendor sold you. It says nothing about what your team produced. Accepted work, review time, rework, and deployment stability, meaning the metrics that actually indicate whether AI use is helping, stay off the report entirely.
The fix is to treat token data as a cost figure to weigh against delivery outcomes.
Don’t use it as a performance metric in its own right. Compare it against accepted work, review time, and deployment stability from the same team and workflow, over the same time period.
That comparison shows what token counts alone can't: whether higher spend is producing merged changes with stable quality, or simply generating more review work without a matching gain in output.
Axify puts AI adoption, AI cost, and delivery metrics in one view, so you can make that comparison without stitching reports together.
Want to see what your AI spend is producing? Start your 14-day free trial of Axify.
For a practical measurement framework, see our guide to AI coding tools' impact, which shows how to connect adoption and cost data with delivery and quality evidence.
You should set token budgets per team and approved workflow instead of per developer. Individual limits ignore differences in task complexity, repository health, and role, while team-level budgets take all that into account.
Yes. GitHub Copilot’s token-based billing changes how you track spending because usage now converts directly into AI credits. Since June 1, 2026, one credit equals $0.01, so your reports should correlate credits by team and workflow with accepted outcomes.
You can identify a problem by comparing token use with the same team’s task type, code health, accepted work, and rework. CodeScene found that agents used 35% to 45% more tokens on unhealthy code, so higher usage may reflect maintainability problems.
You usually need four to eight weeks of comparable data to see whether AI is helping delivery. Compare cycle time, pull request review time, deployments, and defects for the same team before and after adoption, while accounting for major workload changes.
Anthropic reports about $13 per active developer-day and $150 to $250 monthly, with 90% of users staying below $30 per active day. However, don’t treat these numbers as universal benchmarks; model choice, task complexity, and codebase health will affect your consumption and, as a result, your token spend.
Mostly not. After Meta shut down its token leaderboard in April 2026 and reports of wasted spend at Amazon and Uber, companies moved toward token budgets and outcome metrics, a shift often called valuemaxxing. Token data remains useful as a cost signal, not as a productivity score.
No. Tokenmaxxing can affect any function where you mistake AI consumption for useful output. In marketing, support, legal, or finance, high token use tells you little unless you connect it to approved work, correction time, cost, and quality.