AI
18 minutes reading time

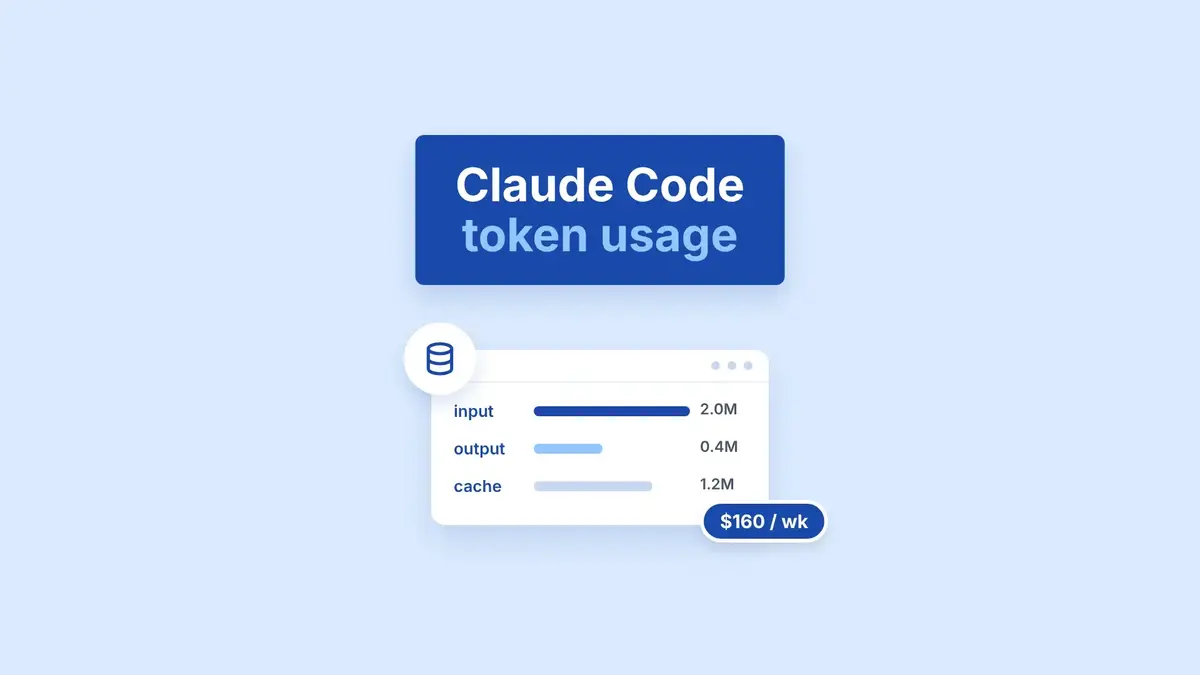
Claude Code token usage can rise quickly when you load extensive project context, run agentic loops, review code, call MCP tools, or repeat failed prompts. But are you spending too much?
Anthropic’s reports average enterprise costs of about $13 per developer per active day and $150 to $250 per developer per month, while 90% of users remain below $30 per day. These figures help you identify unusual spending, although they cannot show where Claude performs best and if your costs are, indeed, optimized.
Instead of cutting access after a cost spike, you need to trace spending by team, developer, model, workflow, and delivery outcome. So, in this article, you will learn what consumes tokens and where reliable usage data appears.
You will also see how to improve attribution, set controls, and support AI cost optimization without disrupting useful workflows.
Let's get started!
Claude Code token usage includes everything you send to the model, everything it generates, and the context added while it reads files, runs tools, and completes multi-step tasks. These are the main sources you need to track:
Anthropic currently charges $4 per million input tokens and $20 per million output tokens for Opus 5.5, its newest Opus model. Sonnet 5.5 costs $2 and $10. Haiku 5.5 is priced by prompt size: $0.10 and $0.50 for prompts up to 100,000 tokens, and $0.50 and $2.50 above that. Bash and text-editor tools also add their own input tokens, so your cost optimization review must include tool activity alongside model usage.
Anthropic's Opus pricing has also changed significantly across model generations. Claude Opus 4 and Opus 4.1 cost $15 per million input tokens and $75 per million output tokens. From Opus 4.5 to Opus 5, the price dropped to $5 and $25, and Opus 5.5 lowered it again to $4 and $20.
This represents a substantial reduction in the cost of using the Opus family, particularly for workloads that generate large amounts of output. Because pricing changes can alter your cost per workflow, you should recalculate budgets and AI ROI whenever Anthropic updates its rates.
That's because the per-million-token figures can make AI usage appear inexpensive until they are applied to an actual engineering workload. For example, suppose a 10-person software engineering team uses an AI coding agent that consumes an average of 2 million input tokens and 400,000 output tokens per developer each week. At Opus 5.5's current rates, that amounts to $8 of input-token cost and $8 of output-token cost per developer per week, or $160 per week for the team. Over a year, that is approximately $8,320 in model-token costs alone. A heavier workflow consuming 10 million input tokens and 1 million output tokens per developer per week would cost the same team approximately $600 per week, or $31,200 per year.
You can see Claude Code usage through two native analytics views, the Analytics API, Claude Agent SDK cost fields, and OpenTelemetry exports. Here are the differences you need to account for when choosing a source:
If you use Claude for Teams or Enterprise, you can open claude.ai/analytics/claude-code to review usage metrics, contribution metrics, a leaderboard, and CSV exports. User-level token counts and cost estimates are available through OpenTelemetry or your spend report.
If you use the Console or API, platform.claude.com/claude-code gives you another view of usage and spend. It shows lines of code accepted, suggestion acceptance rate, daily active users and sessions, and daily API spend. The team insights table also shows per-user spend and accepted lines of code. Anthropic notes that the spend figures in this dashboard are estimates, so you should use your billing page for actual costs.
If you need to pull Claude Code usage data into your own reporting system, Anthropic provides a Claude Code Analytics API for API customers. It gives you daily, per-user usage metrics programmatically, including usage, cost, and productivity-related data. You need an Admin API key to access it.
For Claude Enterprise customers, Anthropic also provides an Enterprise Analytics API. It can return per-user engagement, usage, and cost reports across Claude surfaces, including Claude Code. This API requires an Enterprise plan and a Primary Owner to create an API key with the read:analytics scope.
Because records can be delayed by up to one hour, you should use the API for daily analysis and reporting as it's not a realtime view.
Next, you can use total_cost_usd or costUSD to inspect approximate costs for individual interactions during AI development. These values are client-side estimates, so you should reconcile budgets and invoices against Anthropic’s Usage and Cost API or the Console usage page.
Lastly, you can export raw usage events into your observability stack when you need more detailed filtering than Anthropic’s aggregated views provide. This gives you more control over the data, while your platform or observability team must build and maintain the collection pipeline.
At organization scale, Claude Code usage can become difficult to translate into meaningful team-level costs unless you structure your billing and usage data for attribution. You may know how much your organization is spending overall, but that total does not necessarily show which engineering teams, products, or workflows are responsible for the spend.
Depending on how you deploy and bill Claude Code, you may need to map usage records to your organizational structure before you can perform detailed cost analysis.
As more developers and teams adopt Claude Code, the risk is not simply that your overall bill will increase, but that you will not know why it increased. For example, you may see monthly spending rise by 30% without knowing whether the increase came from:
Without clear attribution, you cannot set realistic team budgets or identify where usage needs review.
To address this, you need to:
The next two sections explain how you can build that attribution and use it to produce meaningful team-level reporting.
To attribute Claude Code spending, you need a reliable way to connect usage to the engineering team or cost center responsible for it. You can use Anthropic's usage data alongside your own team and cost-center records to create these mappings. The exact approach depends on how you deploy and bill Claude Code, but you need this attribution in place before you can reliably compare team costs or apply team-level usage policies.
Here are the attribution controls you need.
You can assign each workspace or key to one team, which keeps usage separated so the billing report is clearer. For developer-level attribution, you should also preserve the user identifier attached to each Analytics API record.
When you export usage data, you can map each user, workspace, or key to a team, product, and finance cost center. If a developer changes teams, you should date that change so historical spending remains assigned to the correct team.
If you use multiple routes, you should record the provider, endpoint type, and region alongside token volume. This matters because regional and multi-region Amazon Bedrock and Google Cloud endpoints carry a 10% premium over global endpoints for supported Claude models.
Without that distinction, you may attribute a cost increase to higher token consumption when the endpoint premium caused it.
You can combine usage data from Anthropic’s Analytics API with your own records that identify each user’s team or cost center. You can then group token usage and costs by team to create a “Tokens by team” report. This gives you a team-level view of Claude usage that you can use in your BI or FinOps tool. Anthropic does not automatically provide this team-level breakdown.
The most useful Claude Code metrics help you understand where you use tokens, what is driving changes in cost, and whether the resulting work is actually useful. You should look at costs, usage patterns, and results together because total token usage alone cannot tell you whether the work was completed successfully or whether the model had to retry after failures.
These are the metrics you should review:
| Metric | Why it matters |
|---|---|
| Tokens by team | Shows you where usage and spending are concentrated. |
| Tokens by model | Shows you whether higher-cost models are being used for suitable tasks. |
| Tokens by workflow | Helps you compare repeatable work with costly experimentation across dynamic workflows. |
| Cost per active user | Helps you measure actual adoption instead of paid seats. |
| Cost per developer, ranked | Helps you find unusual spending for troubleshooting or coaching. It cannot tell you who is productive. |
| Cost per accepted PR | Shows you how much Claude Code spending is associated with merged work. |
| Cost per reviewed change | Helps you assess AI-assisted code review costs. |
| Cost per incident summary or documentation update | Helps you compare the costs of smaller automated workflows. |
| Failed or abandoned sessions | Shows you where tokens produced no completed output. |
| Repeated retries | Shows you where agents may be struggling with unclear tasks, missing context, or tool failures. |
| Prompt cache hit rate | Shows you whether repeated context is being reused. |
If you're doing model comparisons, make sure you understand which Claude version you're using. Claude 4.7 and later models use a newer tokenizer that produces approximately 30% more tokens for the same text than earlier models. As a result, you could misread a model change as increased developer usage unless your report separates model versions.
Workflow reporting can also help you identify small maintenance tasks that might otherwise be overlooked.
Anthropic found that 8.6% of the Claude Code tasks analyzed internally involved “papercut fixes,” such as refactoring code for maintainability or making small quality-of-life improvements. Tracking these tasks separately can help you understand how AI usage is contributing to work that may not show up in conventional feature-delivery metrics.
Token budgets help you control unexpected costs once you attribute Claude usage to the correct teams and workflows. You should set controls around spending, alerts, model access, and exceptions.
Follow this plan:
Of course, you should revisit these limits whenever Anthropic changes model pricing. A price decrease or increase changes the amount of work each budget can support, so your earlier limits and ROI calculations may no longer be accurate.
Pro tip: For a deeper look at whether Claude Code improves delivery, check out our guide to measuring Claude Code’s engineering impact.
To control Claude Code token usage without discouraging adoption, you need clear workflow rules, model routing, caching, agent-loop controls, centralized enforcement, and weekly reviews. These controls help you reduce avoidable spending while preserving access for work that produces useful results.
Here are the steps you can take.
You should approve Claude Code for documentation, PR summaries, tests, code explanations, narrow bug fixes, incident summaries, and backlog cleanup. For production-critical code, security-sensitive repositories, unstable legacy modules, and broad architecture changes, you should require senior review.
Clear rules can support adoption because you tell developers where they can use the tool safely. DORA’s research on generative AI supports this: organizations with clear AI acceptable-use policies show a 451% increase in AI adoption compared to those without.
You should route routine summaries and simple transformations to Haiku, general coding work to Sonnet, and complex agentic tasks to Opus.
Under current Anthropic pricing, you pay $0.10/$0.50 per million input/output tokens for Haiku 5.5 (on prompts up to 100,000 tokens), $2/$10 for Sonnet 5.5, and $4/$20 for Opus 5.5.
These price differences give you a reason to test whether a less expensive model can complete each workflow reliably before granting Opus access.
When your workflows repeatedly send long repository context, coding standards, or the same system instructions, you pay more so Claude can process information it already knows. Prompt caching lets you reuse that stable context across related requests, which reduces repeated input processing and lowers the cost of recurring workflows.
You can set session limits with --max-turns in print mode and control tools through --allowedTools, --disallowedTools, permission modes, and output formats. These Claude Code CLI controls help you stop repeated tool calls and restrict unnecessary command access.
Claude Code can keep working autonomously for a surprisingly long time, so controls that limit how many steps it can take or which tools it can use become more important.
In fact, Anthropic found that the longest turns (the 99.9th percentile) grew from under 25 minutes to more than 45 minutes between October 2025 and January 2026, making session and tool limits more important as these runs get longer.
When you need consistent enforcement across teams, you can use an LLM gateway to apply the budgets defined earlier. The gateway can track usage, route approved models, apply rate limits, record requests, and block calls after a team reaches its threshold. This gives you one enforcement point across direct API, Bedrock, and Vertex traffic.
Each week, you should review top spenders, costly models, failed runs, repeated retries, and expensive sessions without accepted output. You should then evaluate cost changes based on delivery results over the same period.
For example, if incident-summary spending rises during one week, you can evaluate that week’s recovery time and customer support volume, too. This analysis helps you decide whether to continue, adjust, or restrict the workflow.
The team-level setup above shows you where spending goes. Individual developers also need a quick way to check and trim their own sessions. Claude Code has built-in commands for this:
A few habits make the biggest difference: clear the context between unrelated tasks, compact long sessions before they fill the window, and keep your CLAUDE.md files short, since they load into every session. For more, see Anthropic's guide to managing Claude Code costs.
You should choose a Claude token tracking setup based on the questions you need to answer and the engineering effort you can support. Here are the three setups you can consider:
If you manage a small team using only Claude Code, the native Console or analytics view may be enough. You can review usage and spending quickly, although your analysis stops at Claude Code.
The disadvantage is that you cannot connect that data with metrics like accepted PRs, PR review time, completed Jira issues, deployment frequency, incident volume, or customer support volume.
If you already use an observability stack like Grafana, you can export raw Claude Code events through OpenTelemetry (OTEL). This gives your team more control over the data, but it also means someone needs to own the setup and keep the collector, storage, data fields, dashboards, and alerts running.
Claude Code default configuration sends metrics every 60 seconds and log events every five seconds. That gives you timely data for agent teams and other high-volume workflows. But OTEL still needs ongoing maintenance, so it works best when you have someone responsible for keeping it running.
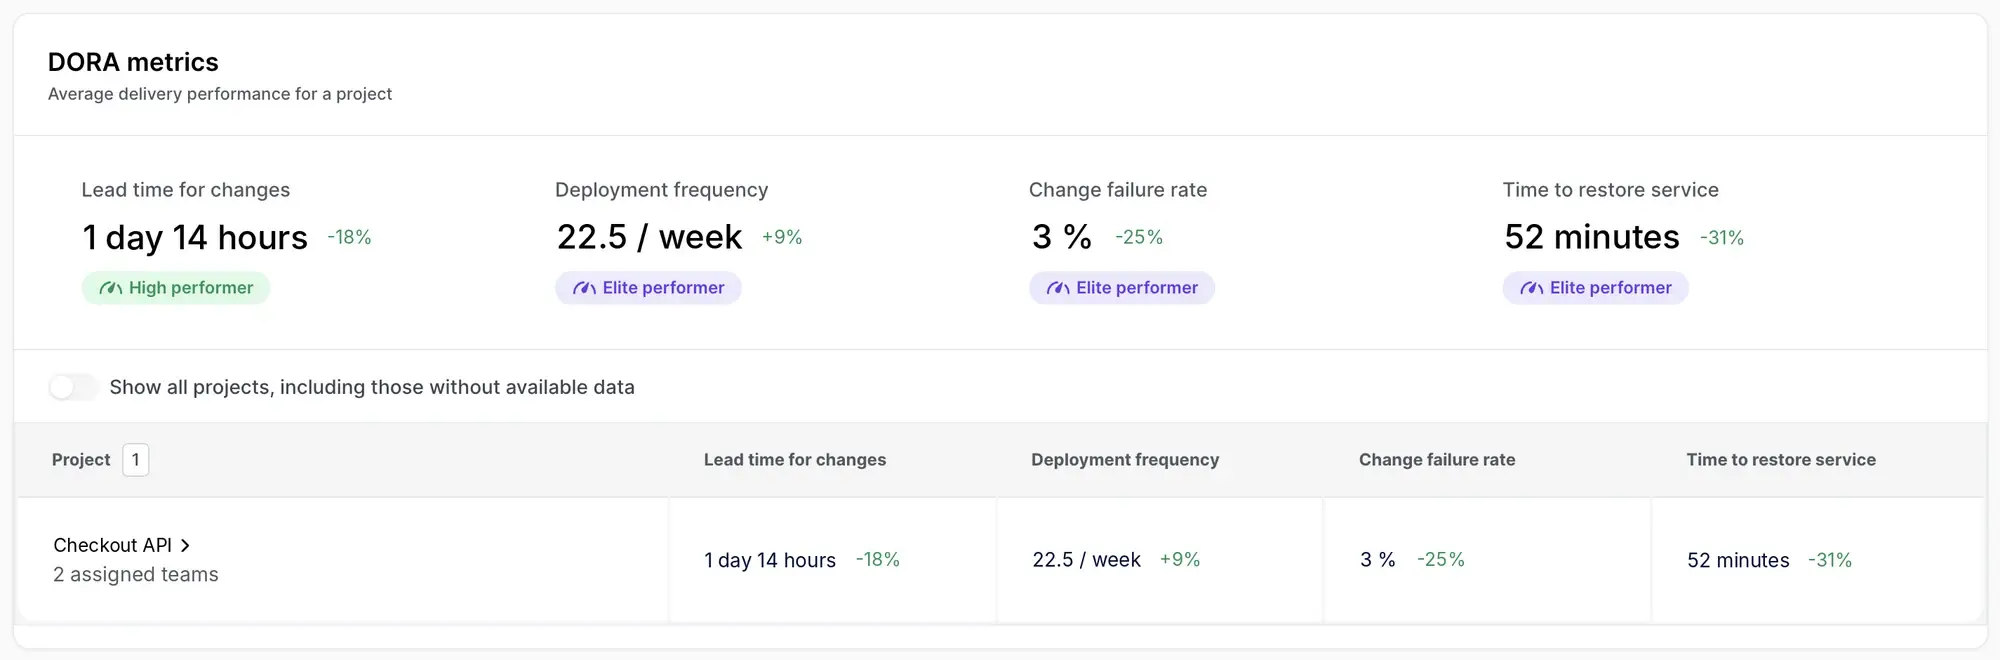
If you want to compare Claude Code costs with GitHub Copilot or Cursor adoption, you need more than AI usage data alone. You also need to connect it with Git and Jira activity, cycle time, and DORA trends.
A platform layer brings these data points together, so you can see AI costs alongside engineering activity and delivery performance. That way, you can understand how AI is affecting your development workflow.
Pro tip: If you are evaluating which AI coding assistant fits your teams, check out our GitHub Copilot and Claude Code comparison.
Token usage alone is not enough to measure AI productivity. It tells you how much you spent, but not what you got in return. That’s why token usage belongs in your cost layer, not your productivity metrics. Treating it as a productivity score is the trap our guide to tokenmaxxing warns against.
Pro tip: Running coding agents at scale? Our guide to harness engineering shows how to measure whether agent runs end in accepted work, and what each accepted task costs.
For example, two developers could use the same number of tokens but get very different results. One might produce an accepted PR on the first attempt. The other might repeat failed attempts, use more retries, and eventually abandon the task. Token usage treats both sessions the same, so you need metrics like PR status, retries, and cycle time to see the difference.
DORA’s 2024 report shows why this matters. A 25% increase in AI adoption was associated with a 1.5% decrease in delivery throughput and a 7.2% decrease in delivery stability. Higher AI adoption, by itself, does not prove that delivery performance improved. That's why you need an AI impact measurement framework that ties usage and cost to delivery outcomes.
Instead, look at what happened to your delivery metrics:
Axify helps you track Claude Code cost and impact by combining AI adoption and spending data with Git, Jira, DORA, and value-stream metrics in one platform.
Claude Code analytics tells you how the tool is used, while Axify shows you whether higher adoption is associated with changes in delivery performance. Anthropic remains your authoritative billing source, though.
These are the Axify views you can use to add team and delivery context.
Axify’s AI Adoption & Impact dashboard lets you review AI usage by team, person, and tool. Its AI Cost view shows gross cost at provider list rates, broken down by tool, model, team, and person, along with token consumption and how costs change over time.
This way, you can identify which teams regularly use Claude Code, which models drive costs (unnecessarily), and where paid access is correlated with little use.
Warning: When you review individual data, use it to investigate adoption gaps or expensive workflows rather than rank developer productivity.
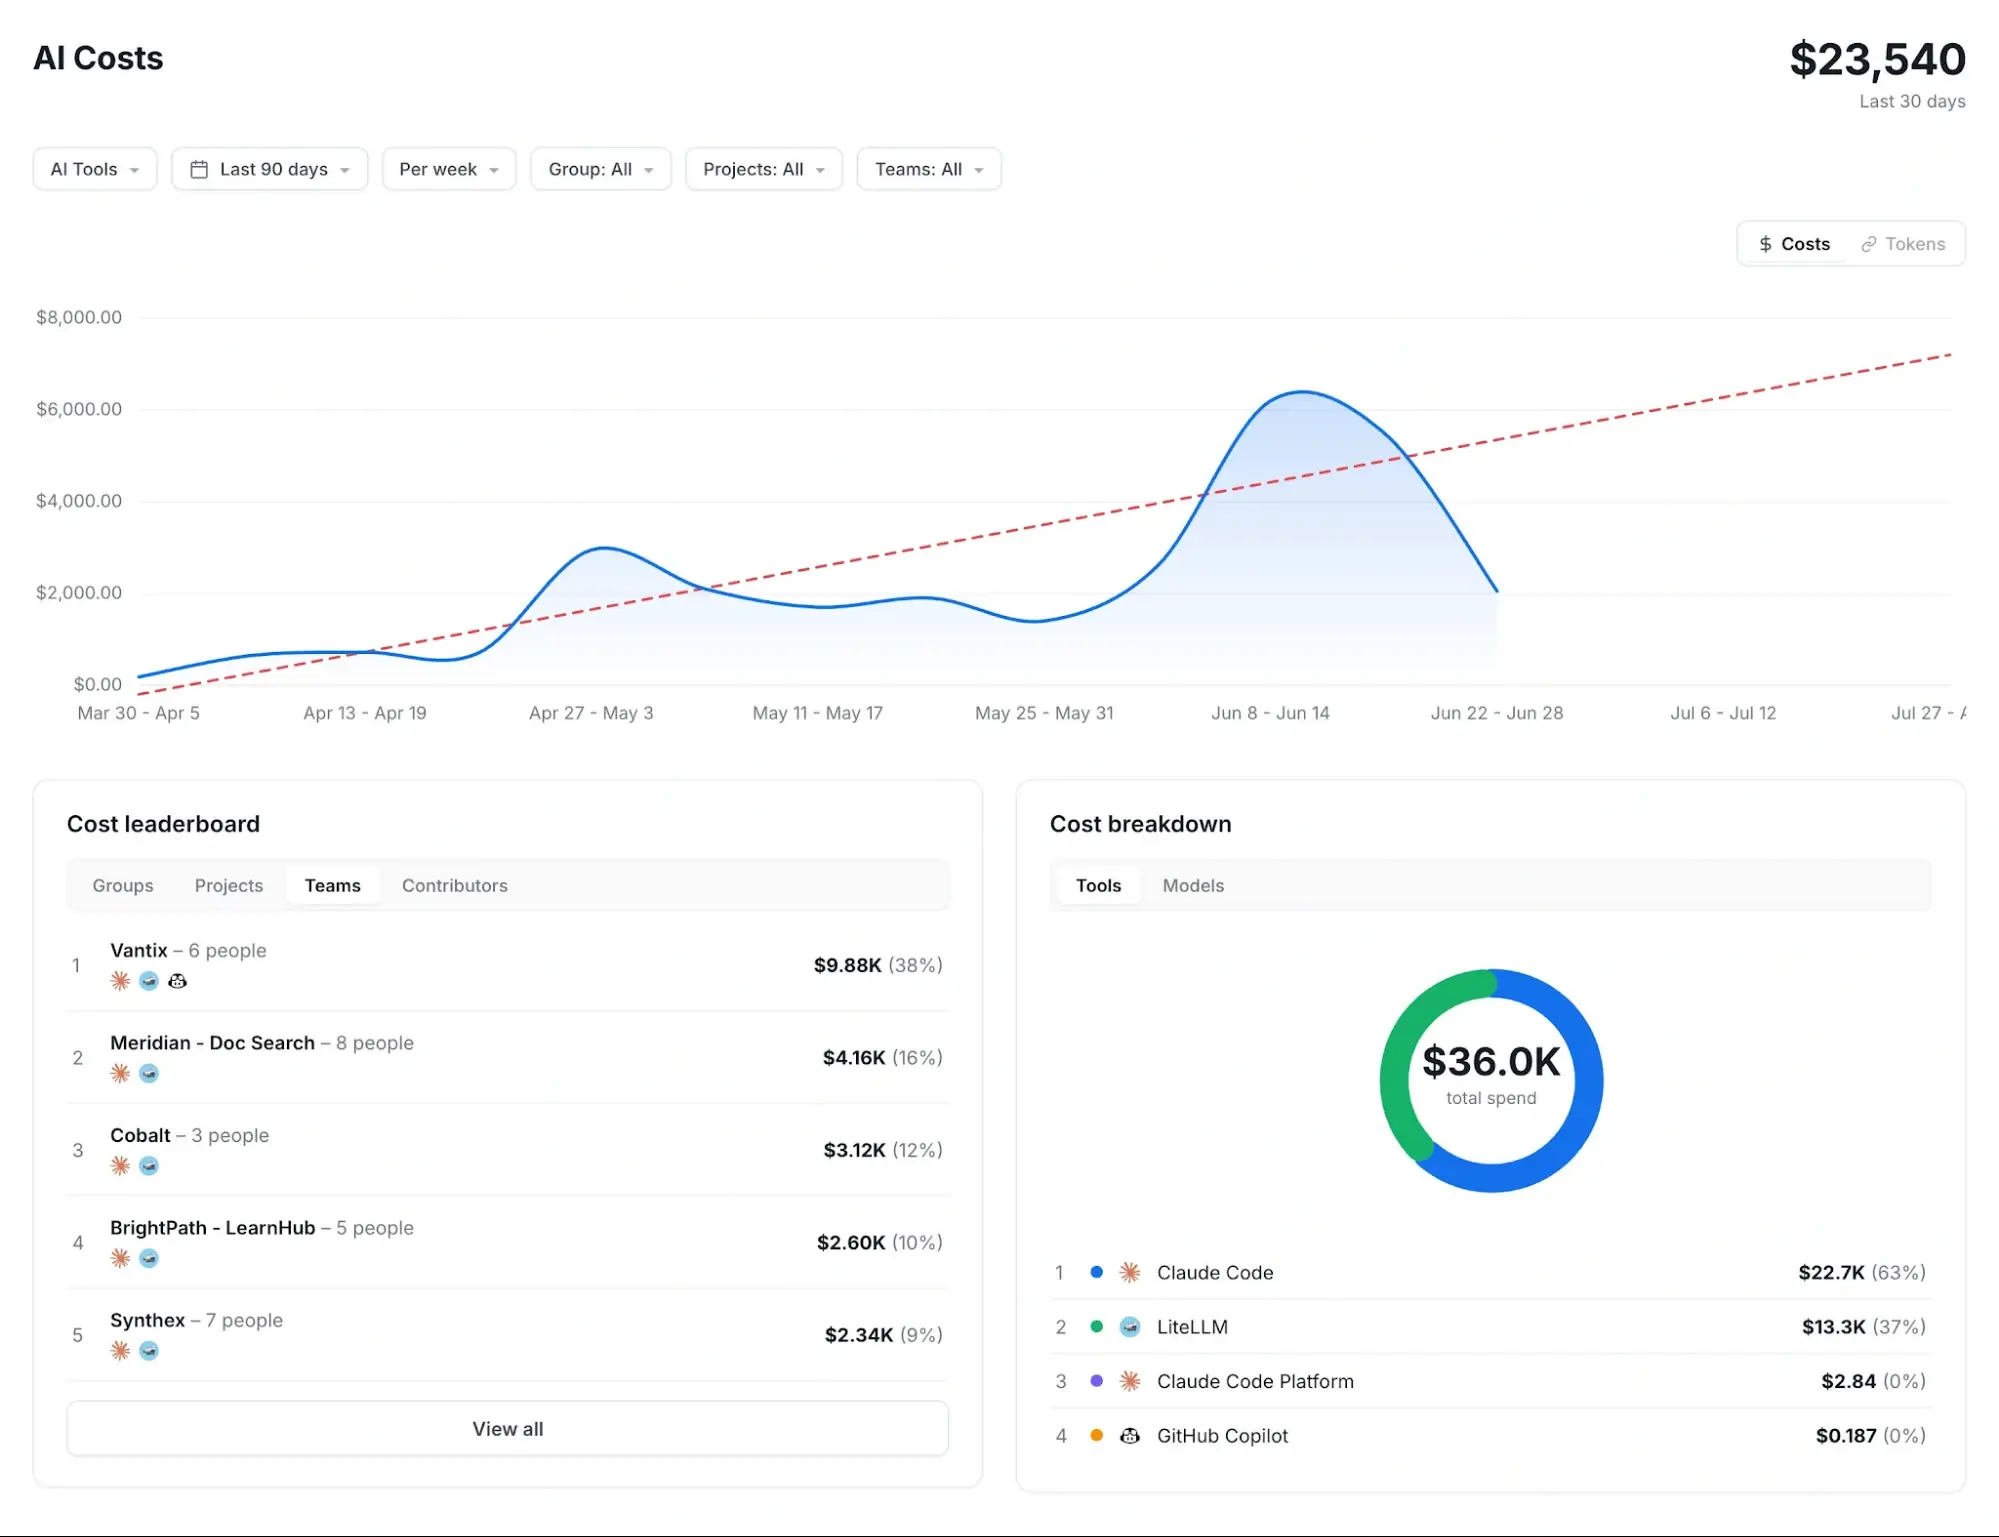
Axify connects AI activity with Git and Jira data, so you can review adoption and cost alongside accepted work and delivery metrics. The dashboard gives you several ways to examine that relationship:
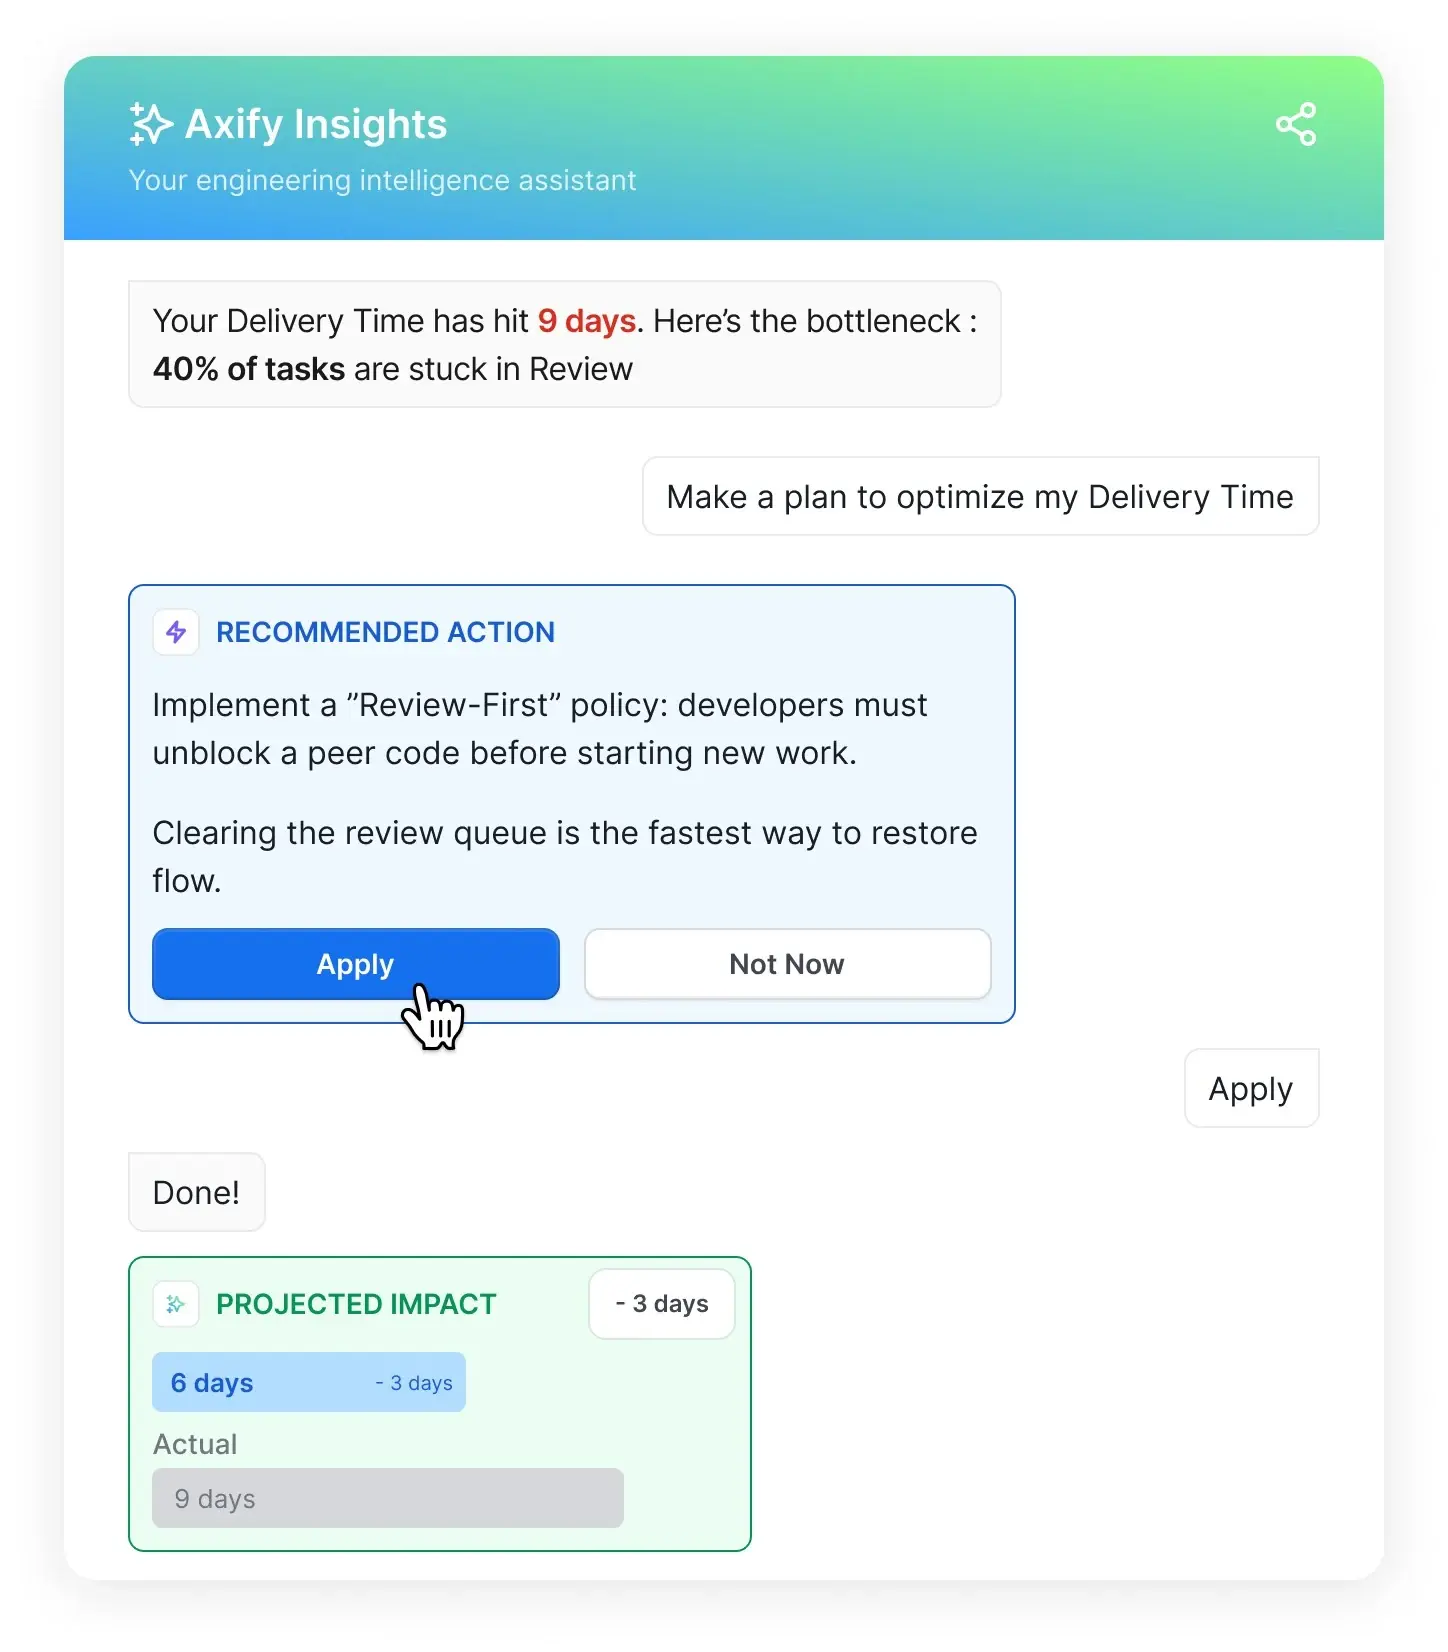
Axify Intelligence helps you examine why delivery metrics changed after AI adoption increased. It analyzes data from multiple sources, identifies bottlenecks, and gives you contextual recommendations based on the affected team and workflow.
For example, if Claude Code adoption rises while PR review time also increases, you can investigate review capacity and PR size before deciding whether to expand, adjust, or restrict the workflow.
Your token-control strategy should focus Claude Code on work that produces measurable engineering value. Route routine tasks to lower-cost models, keep stronger models for complex work, and stop repeated agent loops that don’t lead to accepted output.
From there, connect spending with accepted PRs, cycle time, review time, and change failure rate for the same team and reporting period. This comparison helps you decide which workflows to expand, adjust, or restrict without reducing adoption across teams.
Axify puts Claude Code adoption and cost next to your delivery metrics, so you can make that call with data.
Want to see what your Claude Code spend is buying? Start your 14-day free trial of Axify.
Need more guidance on task selection, model use, permissions, context management, and rollout controls for Claude Code? Read our guide on 39 Claude Code best practices.
You track Claude Code token usage through Anthropic’s native analytics views, Analytics API, Agent SDK estimates, or OpenTelemetry exports. Use the comparison in Where Teams Can See Claude Code Usage Data to choose the source that matches your reporting delay, detail, and ownership requirements.
Claude Code gives you user-level usage and cost records, while team-level costs require your own attribution setup. Follow How to Attribute Token Spend Across Teams and Developers to map users, workspaces, scoped keys, and cost-center tags before creating team rollups.
Claude Code token usage spikes with large contexts, long agent loops, retries, unscoped prompts, or an unnecessarily expensive model. Anthropic estimates that agent teams use about seven times more tokens than standard sessions when teammates run in plan mode, because each teammate keeps its own context window. Track them separately.
To reduce Claude Code costs, you should route routine work to less expensive models, cache repository context that repeats, and limit long-running agent loops. Use the controls in How to Control Claude Code Token Usage Without Killing Adoption to apply each measure consistently.
You should measure both Claude Code tokens and delivery outcomes. Tokens belong in your cost layer, while accepted PRs, cycle time, review time, throughput, rework, and change failure rate show delivery performance. Why Token Usage Alone Is Not Enough explains how to pair them.
Yes. With Axify, you can review Claude Code and GitHub Copilot usage and cost alongside cycle time and deployment frequency, using AI Adoption & Impact, AI Cost, and your Git and Jira integrations. You cannot create this delivery view in Anthropic’s or GitHub’s native consoles alone.
A multi-tool rollout requires you to keep the same delivery outcomes while adding per-tool and combined reporting. Measure adoption, cost, accepted work, cycle time, rework, and DORA trends for each tool and across the rollout so active seats never become your success metric.
Claude Code does not roll token usage up by your engineering team automatically. You need per-team workspaces or scoped keys, cost-center tags, and a mapping between user records and team ownership. See How to Attribute Token Spend Across Teams and Developers for the setup.
You should revisit Claude Code token budgets whenever Anthropic changes model pricing and at least once per quarter otherwise. During each review, compare current rates, team usage, model mix, failed sessions, and approved workflows so your limits still match actual spending and operational needs.