Delivery Performance
9 minutes reading time


Software teams need more than just speed – they need reliable ways to ship code that makes an impact. Understanding your deployment metrics helps you spot what's working and what isn't.
Smart teams track their deployment pipeline health, how often builds pass, and how quickly they recover from issues. These numbers tell you exactly where to improve your development process. They help you ship better code faster while keeping quality high.
Let's explore the metrics that matter for software delivery performance. We'll examine how to measure them and what they tell you about your team's effectiveness.
CI/CD metrics are measurable data points that help you assess the performance and reliability of your continuous integration and deployment pipelines. They measure everything from how often you ship code to how quickly you fix problems.
These numbers matter because they reveal where work gets stuck, which deployments might fail, and how your team can ship more efficiently. Knowing your deployment frequency, cycle time, and recovery speed, you can make smart decisions about improving your process.
Good CI/CD metrics help align development with business goals. They show if you're shipping quality code at the right pace and if users are getting what they need. Each metric – from build success rates to deployment times – helps paint a clear picture of your software delivery health.
Whether leading a small team or managing enterprise deployments, these metrics guide your improvements and keep deployments reliable.
That brings us to the next point:
Following CI/CD metrics gives you insights on how to improve your software delivery process. These metrics help you measure success rates, streamline feedback loops, and reduce failures in production. Tracking them enables you to clearly understand how your deployment processes perform and where improvements are needed.
Doing this is how you ensure your DevOps practices stay efficient and reliable.
Use CI/CD metrics to spot patterns, address bottlenecks, and make data-driven decisions that keep your production environments running smoothly.
When you monitor these metrics and take correct actions based on them, you streamline continuous delivery and – even better – stay aligned with your business goals. The insights you derive from these KPIs help you move from code to production faster, meet user expectations, and enhance your overall efficiency.
Tracking the right CI/CD metrics keeps your pipeline efficient and reliable. Let’s break down the key metrics you need to monitor to improve your software delivery performance and align your processes with your goals.

Build and test metrics help you evaluate how well your code is being prepared for deployment. They give you a clear picture of your pipeline’s reliability and efficiency. Focus on these key metrics:
This metric measures the percentage of builds that pass successfully. A high success rate generally reflects stable code quality and reliability in your development process. However, a high success rate alone doesn’t guarantee robust testing—an ineffective test strategy may allow critical issues to slip through undetected.
For instance, if your tests aren’t covering real-world scenarios, dependencies, or edge cases, even a 100% success rate might give a false sense of security. To get a clearer picture, pair this metric with insights into test effectiveness, flaky test detection, and failure patterns to ensure that passing builds contribute to software stability.
This tracks the average time it takes for your builds to complete. Shorter build times speed up feedback loops and allow your team to address issues faster. However, shorter isn’t always better—extremely fast builds may indicate insufficient testing or missed opportunities for validation. Balance is key: optimize build times without compromising the thoroughness of your testing processes.
A good proxy metric in Axify is deployment frequency ( you can find it in the DORA metrics dashboard). This KPI tracks how quickly code moves through the CI/CD pipeline.

You can also use Lead Time for Changes (you can find it in the VSM tool, not just the DORA dashboard). This gives you a broader view of how long it takes for a commit to reach production because it incorporates build time. Monitor these together to ensure efficient yet thorough software delivery.
This metric highlights how much of your code is covered by automated tests. Higher code coverage ensures fewer defects make it into production and protects software quality. We advise you to focus on the quality and relevance of your tests. Achieving 100% coverage doesn’t necessarily mean your code is defect-free if edge cases and critical paths aren’t adequately tested.
This indicates the percentage of failed tests in your pipeline. Reducing this rate minimizes interruptions and ensures smooth workflows for your DevOps team. After all, a high failure rate often signals issues with flaky tests, insufficient test environments, or unstable code changes. Addressing these underlying causes can improve reliability and prevent frequent interruptions to your workflow.
Deployment metrics focus on the performance and reliability of your deployment processes. They are critical for ensuring your software reaches production efficiently and without unexpected setbacks. These are:
Deployment frequency measures how frequently you release code to production. Frequent deployments indicate agile processes that quickly adapt to changing needs.
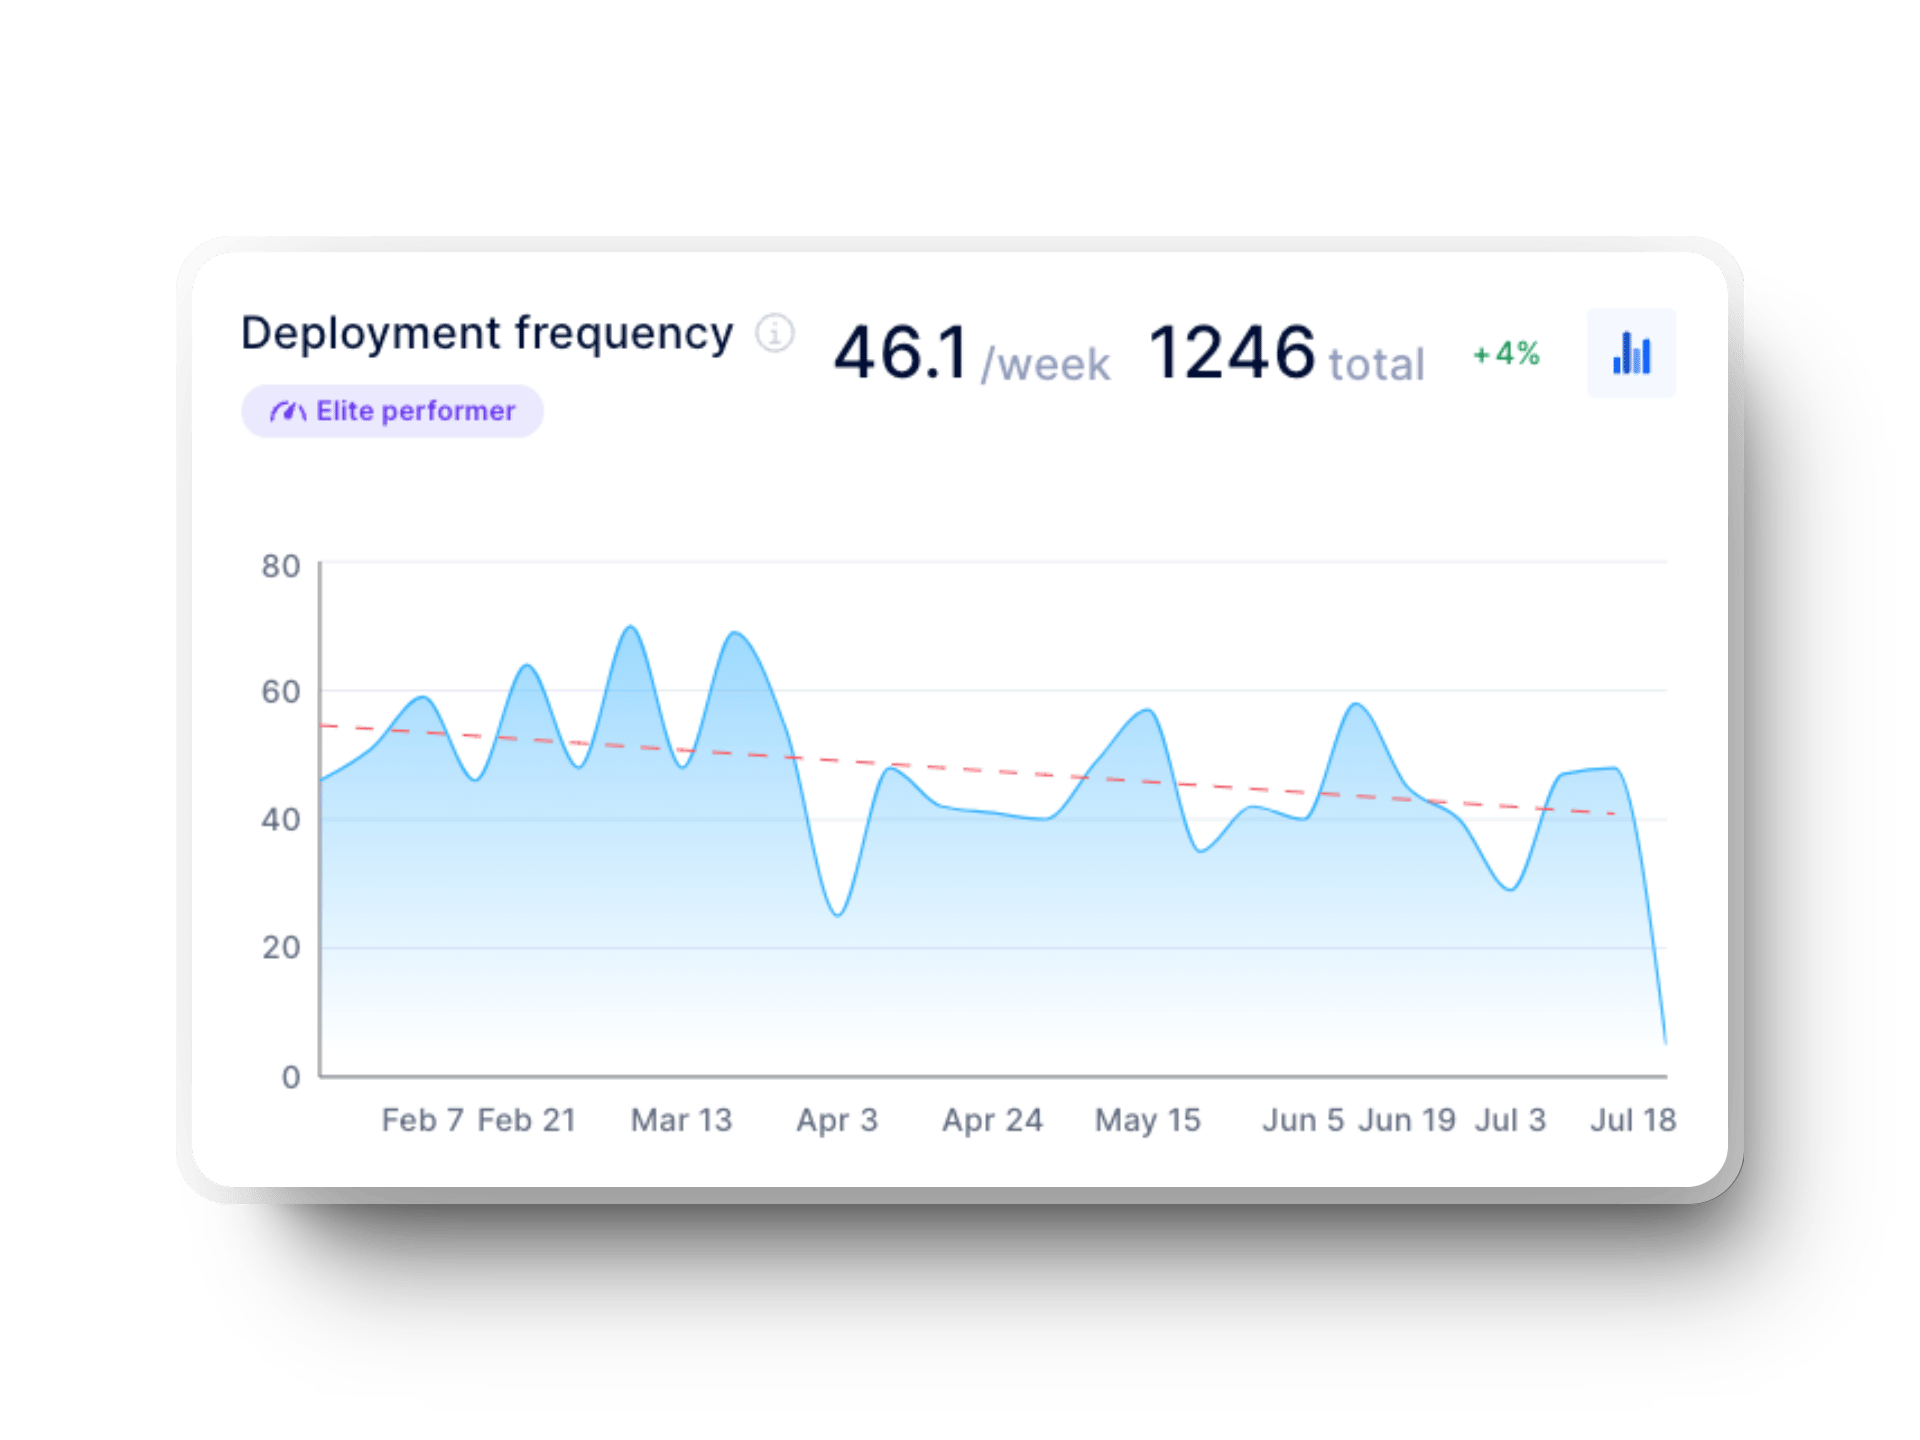
However, frequent deployments without proper testing and validation may lead to unstable releases. You need a good balance between speed and quality to sustain success.
This shows the percentage of deployments that fail. Lower rates mean fewer production disruptions and greater trust in your pipeline.
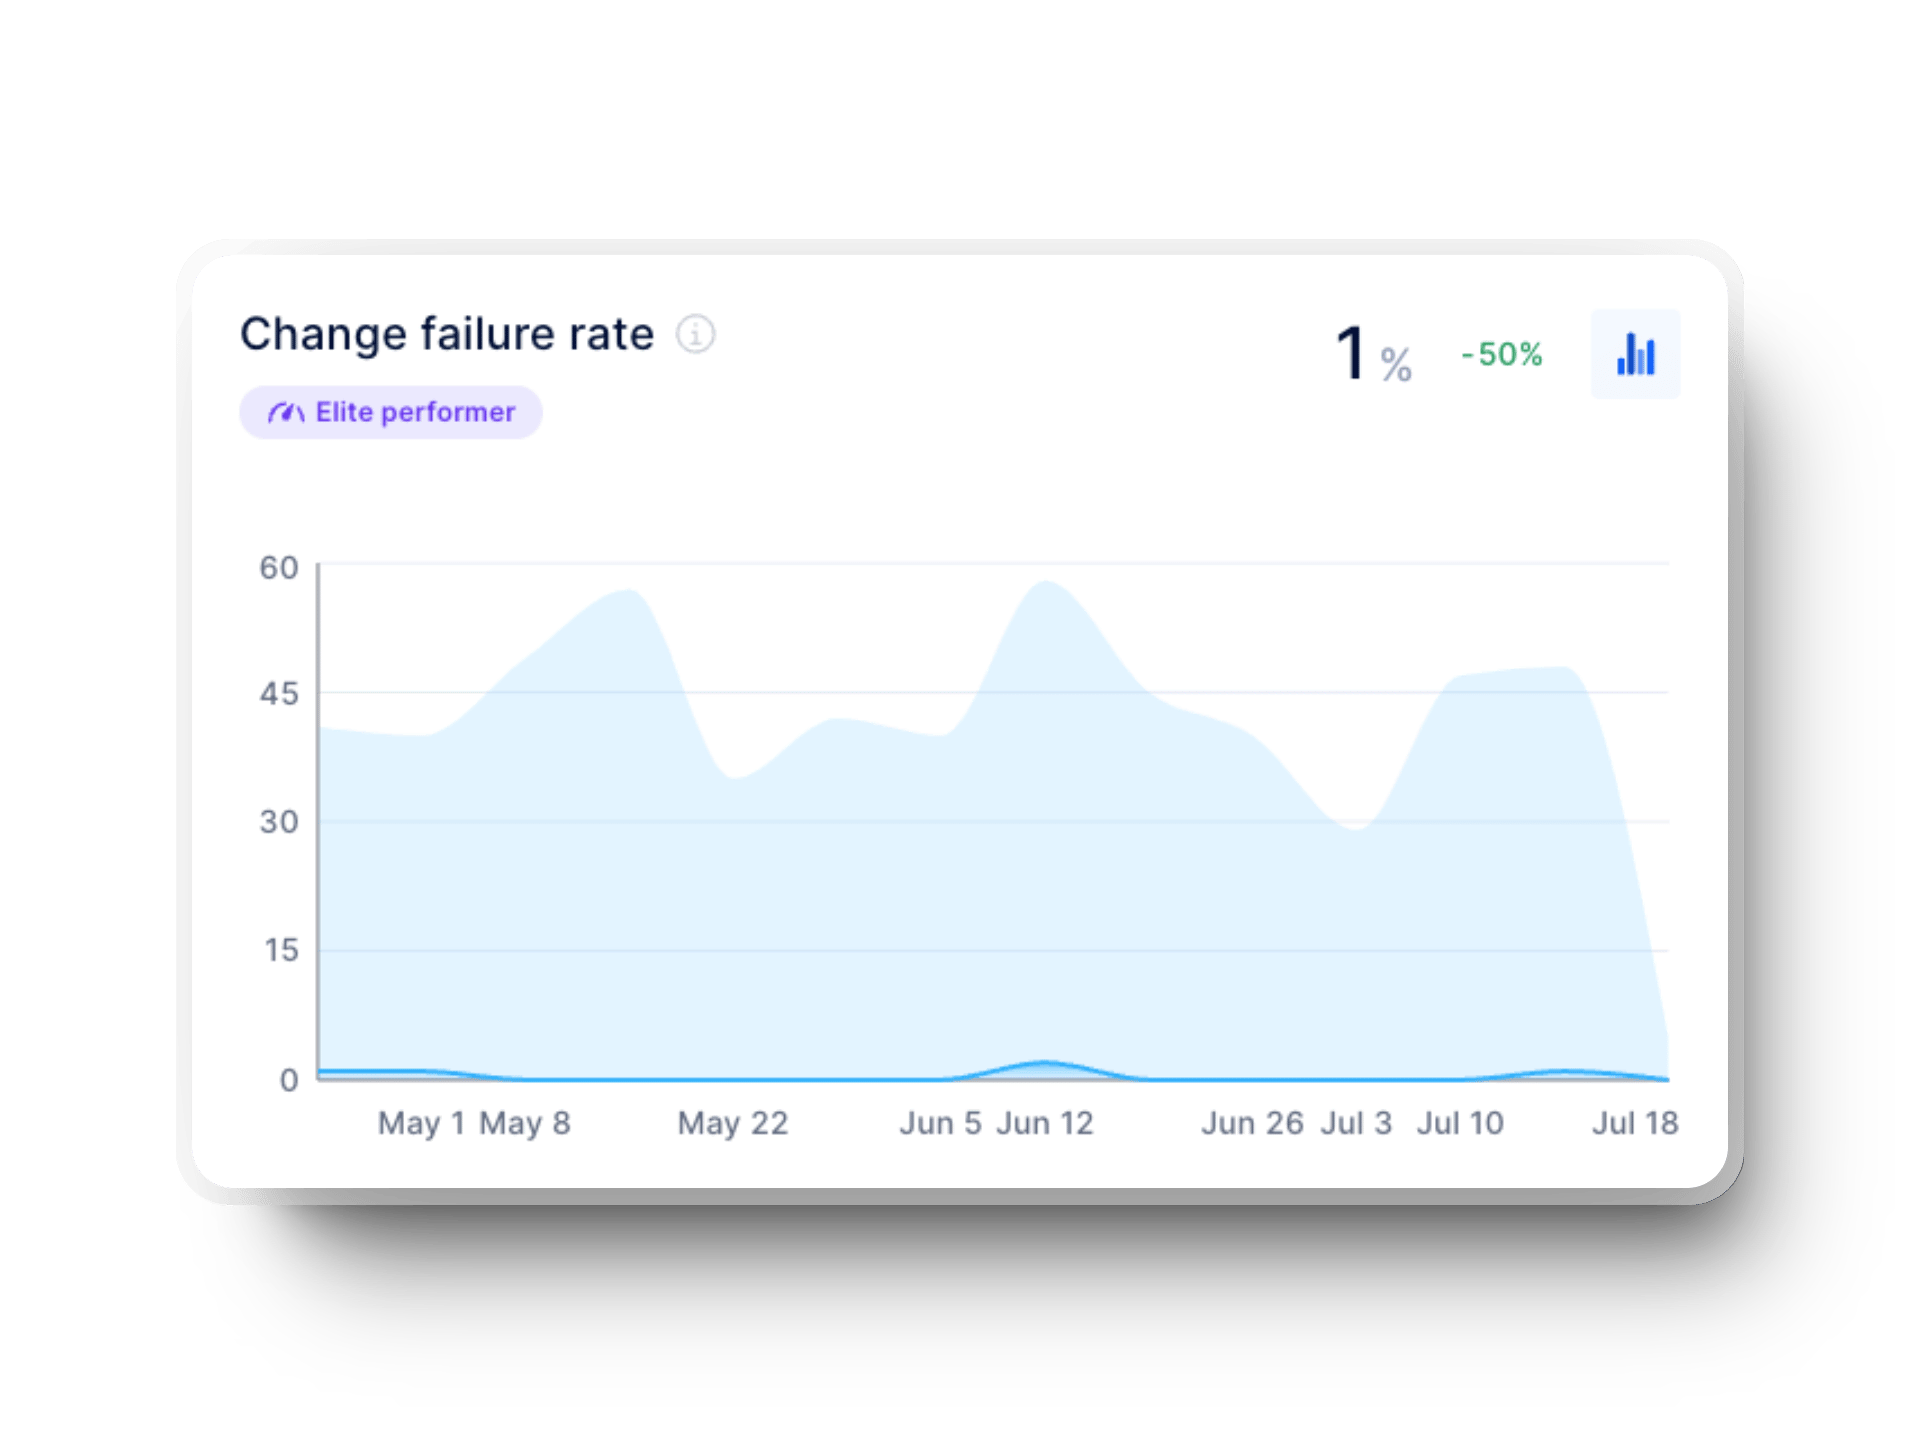
However, if failure rates are too low, it may indicate overly cautious processes where risk aversion stifles innovation. Aim for a balance where risks are managed, not entirely avoided.
This tracks the average time it takes to move from a ready-to-deploy build to a live production environment. Faster times improve your ability to deliver value quickly.

This measures how frequently you need to undo deployments. Minimizing this rate helps you avoid disruptions and maintain production stability.
Of course, faster deployment times shouldn’t come at the cost of skipping critical validation steps. Use automation to streamline processes without compromising quality.
Failed deployment recovery time is the time it takes to recover from a failed deployment. Faster recovery times ensure your team can respond quickly and reduce downtime.
%20in%20axify%20for%20software%20development%20teams.webp?width=1920&height=1440&name=time%20to%20restore%20service%20(dora%20metrics)%20in%20axify%20for%20software%20development%20teams.webp)
We advise you to analyze the root causes of failures to prevent recurrences. Invest in tools and processes that enable rapid response while ensuring long-term system stability.
That means CI/CD pipelines with rollback capabilities, monitoring platforms like Datadog or Splunk for real-time insights, and incident response frameworks such as blameless postmortems.
Efficiency and flow metrics show how effectively your team delivers software and identify areas where delays might be slowing you down. Focusing on these allows you to streamline processes and boost software delivery performance. Keep an eye on these metrics:
Lead time measures the time it takes to go from an idea or requirement to code being deployed. Shorter lead times mean you can deliver features or fixes faster, keeping you aligned with user expectations.
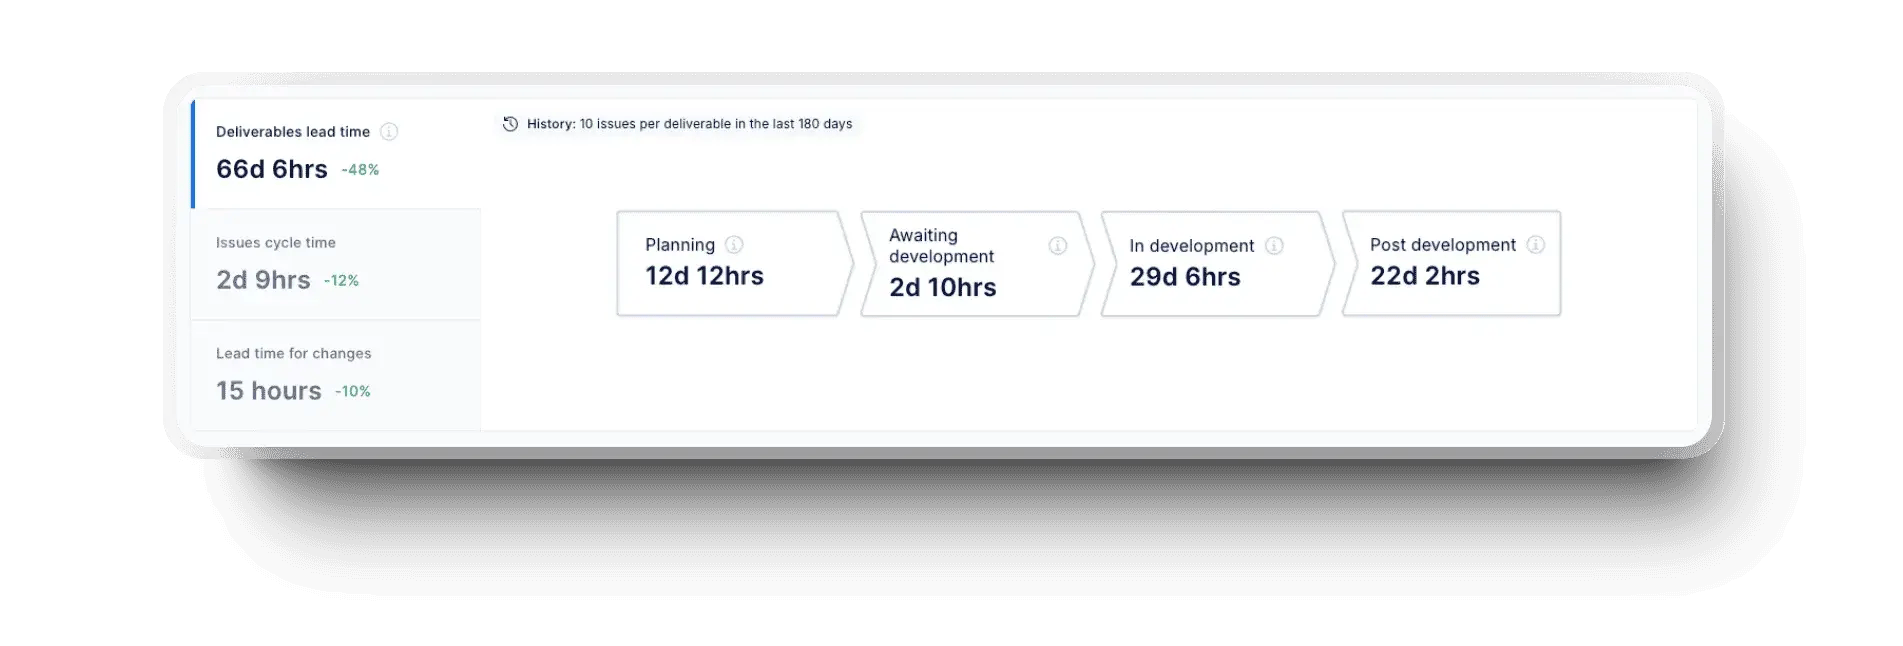
Lead time for changes is a specific subset of lead time that tracks how long it takes for a committed change to reach production. Reducing this time ensures faster iterations and enhances your team’s agility.

Strategies like implementing trunk-based development or using feature flags for faster deployment can make significant improvements here.
Cycle time measures the time it takes to complete a single task, from when work starts to when it’s delivered. It’s a key metric to gauge efficiency and ensure smooth workflows. Unlike lead time, it doesn’t include the backlog period.

Cycle time reduction strategies include using techniques like S.P.I.D.R. and The Walking Skeleton, but you should also optimize your code review process and improve team collaboration.
Of course, track cycle time in context with other metrics. After all, Cycle Time = Work in Progress (WIP) / Throughput.
This metric focuses on how quickly your work delivers measurable value to users. Shortening this time helps you enhance customer satisfaction and stay ahead of your competition.
To achieve that, align cross-functional teams around shared goals and prioritize high-impact features.
Quality metrics ensure your software meets the high standards users expect. These metrics reveal how well your team addresses defects and maintains reliability across releases. They are:
Mean Time to Detect (MTTD) measures how quickly you identify issues in your pipeline or production. The faster you detect problems, the less impact they have on your users and your processes.
This shows how long it takes to resolve bugs once they’re identified. Reducing this time helps you minimize disruptions and improve user experience.
For that, you can swarm on critical issues, implement QA early in the development process, or even add a zero-bug policy.
A zero-bug policy prioritizes fixing bugs immediately after you discover them OR deciding not to fix them and discarding them. Either way, the point is to stop them from accumulating in the backlog. Addressing defects as they arise helps you prevent them from compounding. This is how you reduce technical debt and maintain a higher-quality codebase. As a result, bugs don't delay future development or compromise user satisfaction.
This tracks the number of defects identified during development and production. Monitoring this helps you spot trends and implement strategies to reduce defects in future deployments.
Code coverage measures the percentage of your codebase tested by automated tests.
Observability tools change how you manage your CI/CD pipeline by providing real-time insights into its performance. They help you track system health, identify bottlenecks, and maintain smooth pipeline execution so your software delivery stays on course. Observability tools also enhance your ability to respond to incidents by reducing downtime and improving user satisfaction.
It starts with logging – capturing every important event in your pipeline. When a build fails or a deployment acts up, your logs show precisely why. For instance, logs in a CI/CD pipeline can pinpoint why a build failed or highlight misconfigurations in deployment scripts.
Tracing takes this deeper by following requests through your entire system. When code moves from build to deployment, tracing shows where it slows down or gets stuck. This visibility helps you optimize complex workflows that span multiple systems.
Metrics monitoring completes the picture by tracking key numbers like success rates and recovery times. Tools like Prometheus and Grafana watch for warning signs – like sudden build failures – so you can fix problems before they cascade.
Together, these tools turn pipeline data into clear insights. Instead of guessing what's wrong, you know exactly where to look and what to fix.
Tracking CI/CD metrics effectively starts with a clear plan. Here’s a step-by-step process to help you track the metrics that matter most to your CI/CD pipeline and your software delivery process.
You need to start by defining what you want to achieve. Align your metrics with team goals and organizational priorities. Are you focused on reducing deployment time? Do you want to improve your team’s success rate?
![]()
Pinpointing your objectives helps you focus on the metrics that will drive meaningful improvements. For example, if faster feedback loops are your goal, tracking continuous integration metrics such as build duration and test coverage can show you where to improve.
Once you know your goals, choose metrics that address key aspects of your pipeline. For deployment reliability, metrics such as rollback rate and failed deployment recovery time are essential. If efficiency is your priority, focus on cycle time and time to value.

Always choose metrics that provide actionable insights and align with your objectives. Axify helps you monitor everything from continuous deployment metrics to change failure rates and gives you a comprehensive view.
To gather accurate data, you need the right tools. Platforms like Axify, Jenkins, and GitLab simplify metric tracking by directly integrating your workflow. Axify, for instance, consolidates data from multiple sources and gives you real-time visibility into your pipeline’s performance.

Setting up these tools takes just minutes and works seamlessly with your current processes. Automating your metric collection ensures you can focus on analysis rather than manual tracking.
Before you start making changes, you should establish benchmarks for your metrics. Look at your current deployment frequency, build success rate, and other key indicators. These baselines help you evaluate performance over time.
Then, set realistic targets to aim for. For example, if your average lead time is two weeks, aim to reduce it by 25% over the next quarter. Clear targets provide direction and help your team stay focused.
Integrating observability tools into your tracking process adds another layer of clarity. You can use logging to capture system events, tracing to follow workflows, and monitoring to track key metrics in real time.
Observability tools show you where your pipeline performs well and highlight bottlenecks. For example, if deployment time spikes unexpectedly, observability tools can help you pinpoint the root cause quickly.
Metrics can’t help you if you don’t review them. You should schedule regular check-ins to assess your progress. Are you hitting your targets? Have your metrics revealed new areas for improvement?
Use these reviews to recalibrate your focus and align your pipeline with your goals. Regular reviews also help you identify when metrics become less relevant so you can adjust your tracking efforts accordingly.
CI/CD metrics tell you how your pipeline is performing, but, more importantly, they show you where to act, what to improve, and how to build better processes.
Let’s see how you can use these insights to enhance your software delivery.
Start by diving into the data your metrics provide. Look for patterns or anomalies that reveal how your pipeline works over time.
Are build success rates steady, or do they fluctuate during certain stages? Is your deployment frequency improving, or are there bottlenecks slowing you down?

Trends give you a clear picture of where you excel and where issues might arise. This analysis helps you prioritize changes that can have the most significant impact.
Your metrics are a powerful tool for identifying inefficiencies. You should pinpoint areas in your CI/CD pipeline where work slows or errors occur. For example, a high failure rate during testing might indicate gaps in test coverage or outdated test scripts.
Similarly, long cycle times might reveal inefficient handoffs or too many manual processes. Addressing these bottlenecks helps streamline workflows and improve your pipeline’s efficiency.
You should take action once you’ve identified what’s holding you back. Apply iterative changes to address the issues your metrics highlight. For instance, if your defect escape rate is high, introduce greater testing earlier in the pipeline.
If lead time for changes is a concern, consider automating repetitive tasks or reducing deployment size to make releases more manageable. Small, incremental adjustments help you fine-tune your workflows without overwhelming your team.
Every change you make should be tracked to measure its effectiveness. Try to use your CI/CD metrics to assess how adjustments affect performance.
Did deployment frequency increase after implementing a new tool? Did build times improve after improving your scripts?
Monitoring these impacts ensures you’re making meaningful progress and helps you avoid unintended consequences that could disrupt your pipeline.
Improvement is never a one-time effort. Make it a habit to revisit your metrics, refine your processes, and push for better results. Continuous improvement creates a culture of delivery excellence, where every deployment becomes an opportunity to learn and grow. Focus on building a pipeline that evolves with your team’s needs and the demands of your users.
This advice helps you set achievable, impactful goals that drive noticeable improvements. Tracking and acting on your CI/CD metrics keeps your pipeline healthy and allows you to stay ahead in the fast-paced world of software development.
With Axify, you gain the clarity and insights needed to implement these principles so your software delivery process is always moving forward.
When it comes to tracking your CI/CD metrics effectively, the Axify DORA Metrics Dashboard provides everything you need in one place. With clear visualizations and real-time updates, you can monitor key performance indicators such as deployment frequency, lead time for changes, change failure rates, and failed deployment recovery time.

Our dashboard integrates seamlessly with your existing tools and gives you a comprehensive view of your pipeline’s performance. Whether you’re aiming for faster deployments or improved software quality, Axify allows you to achieve your goals with precision.
Ready to improve your software delivery process? Book a demo with Axify today and see how our platform can transform the way you work. Let’s help you deliver smarter, faster, and with more confidence.
