You know how chaotic it can get when your workflow feels out of control. Tasks pile up, deadlines sneak closer, and bottlenecks slow everything down. But it doesn’t have to be that way. Focusing on the right metrics allows you to bring clarity to your process and helps your team work smarter and not harder.
Kanban metrics help you pinpoint what’s working, what’s not, and where to improve. With these insights, you can create a stable workflow that reduces stress, improves productivity, and delivers results your team and customers will notice.
Whether you’re leading a software development project or managing another complex process, these metrics will help you take control and keep things moving. Let’s show you how to use them and solid alternative metrics to make meaningful progress.
What is Kanban?
Kanban is a visual project management method that streamlines your workflow by tracking tasks as they move through different stages. Using a Kanban board allows you to visualize the flow of tasks, limit work-in-progress (WIP), and focus on improving process efficiency.
Each task is represented as a card, which moves across columns that signify stages such as “To Do,” “In Progress,” and “Done.” This clear structure makes monitoring progress, identifying bottlenecks, and making data-driven decisions that improve productivity levels and team performance easier.
Here's a simple table representation of a Kanban board so you can better understand the concept:

Kanban isn’t something that you can just use for software development projects. You can also use it across different industries, and it is especially useful for Agile project management. With throughput and cycle time metrics, you can gain valuable insights into your entire process and find opportunities for improvement.
Pro tip: Axify seamlessly integrates with all your existing tools and workflows, which makes it a powerful tool for any team size. Whether you’re tackling complex projects or focusing on team performance, Axify fits right in.
What are the Key Principles of the Kanban Method?
The key principles of the Kanban method are starting with your existing workflow, making small incremental changes, respecting current roles, and empowering everyone to take the initiative.
The principles allow you to improve your workflows and process efficiency over time. These principles focus on improving your work management without disrupting your current structure. Following these helps you create a smoother workflow and prioritize value delivery.
You should:
- Start with your existing workflow: You don’t need a major overhaul to begin. Kanban works with your current processes, which makes it easier to identify bottlenecks and opportunities for improvement.
- Opt for small, incremental adjustments: Change doesn’t have to feel overwhelming. You should adjust workflows in manageable steps and improve gradually without the risk of disrupting your production process.
- Respect current roles and processes: Kanban doesn’t demand a complete restructure. It builds on what already works and makes it easier to adapt and adopt within your team.
- Empower everyone to take initiative: From project managers to developers, everyone contributes to process improvement efforts. Kanban encourages leadership and innovation at all levels.
Kanban’s effectiveness is clear. A 2022 State of Kanban Report by Kanban University revealed that 87% of respondents found it better than other approaches. You can also combine Kanban with Scrum (known as Scrumban) to improve the flow of tasks while maintaining Agile project management practices.
What are the 4 Metrics of Kanban?
Kanban metrics are lead time, cycle time, work-in-progress (WIP), and throughput. These metrics help you track your team’s progress, measure efficiency, and uncover opportunities for improvement. They work together to give you a complete picture of your workflow.
Understanding and leveraging these helps you make informed decisions, improve productivity, and deliver better project outcomes. Now, let's look at Kanban's key metrics.
Lead Time
Lead time measures the total time it takes for a task to move from when it is added to your board until it is completed. This metric reflects the entire process, including backlog, waiting periods, active work, and bottlenecks. Think of lead time from your customer’s perspective – it shows how long they wait for their request to be fulfilled.

Since lead time tracks your system's overall duration of tasks, it’s an essential metric for understanding how quickly your team delivers value.
So, what’s a good lead time?
While there isn’t a universal benchmark for lead time, shorter is generally better. However, longer lead times can sometimes indicate that your team handles complex projects requiring thorough review.
That’s why you should monitor lead time to pinpoint bottlenecks and streamline your process flow. For example, if tasks spend too much time in the "Waiting for Review" column, it may signal a need to allocate more resources to reviews.
Pro tip: Always compare apples with apples. Focus on comparing your team's performance within your own team rather than with others. Identifying trends specific to your workflow lets you make targeted improvements and celebrate progress that reflects your unique circumstances.
Cycle Time
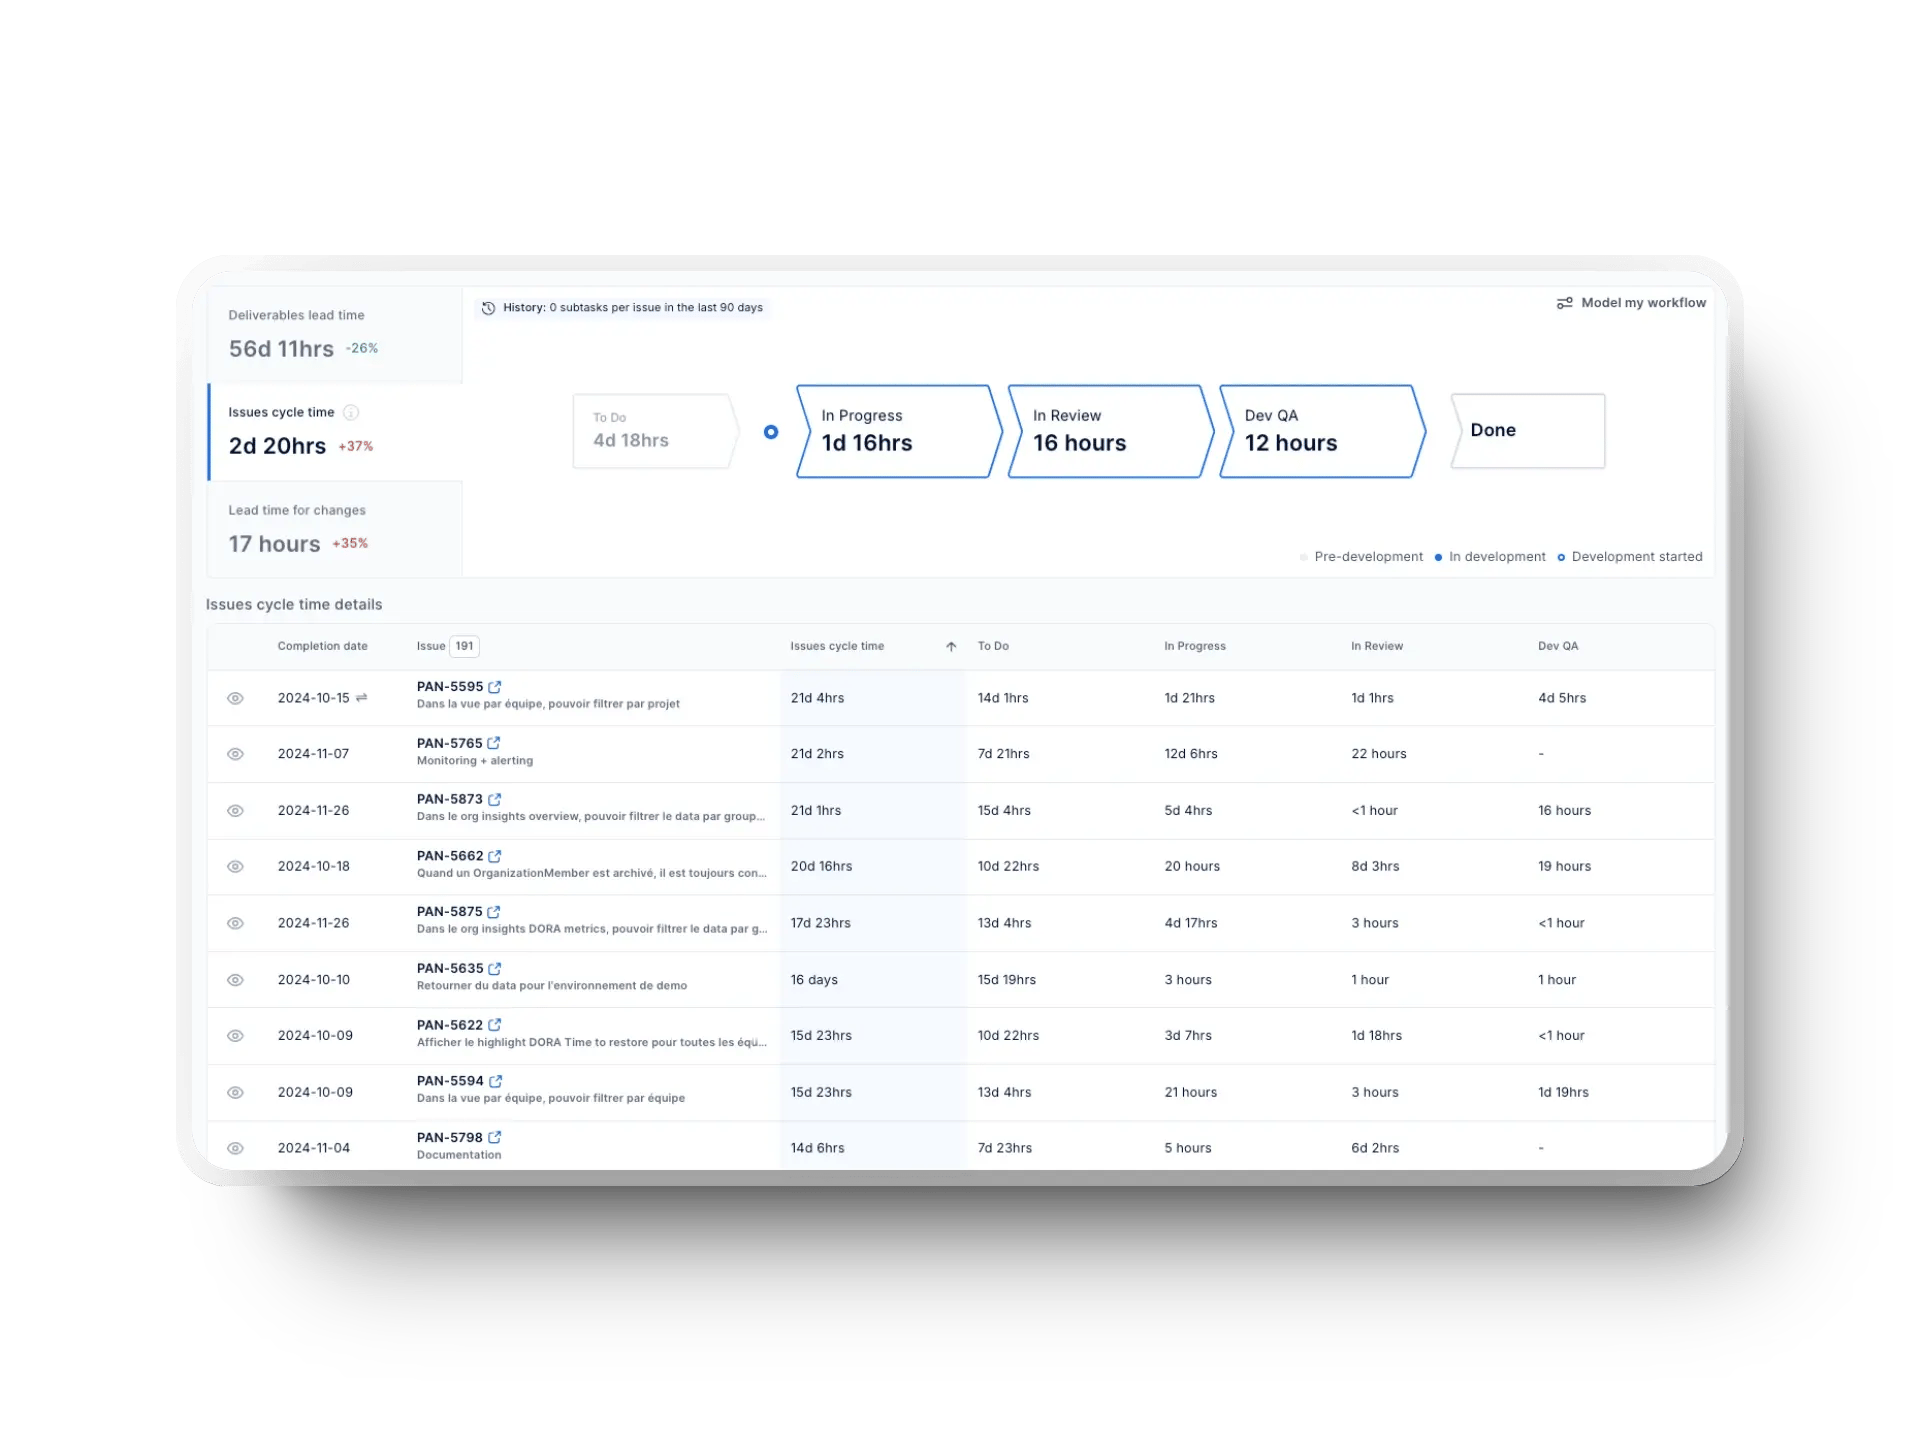
Cycle time focuses on the active phase of a task. It measures how long a task takes from when your team starts working on it to completion. This metric is critical for understanding your team’s productivity and efficiency during the execution phase.
Note: Cycle time highlights the time spent working on a task and excludes the backlog period. So, this KPI is a more focused measure of your team’s internal efficiency.
Lower cycle times typically indicate a more efficient process. However, a slight increase can sometimes be good when you need more quality assurance or complex problem-solving.

Keeping cycle times consistent helps you forecast delivery dates and manage expectations. Tools such as control charts are perfect for visualizing this metric because they show trends and identify outliers.
Work in Progress (WIP)
Work in progress (WIP) – also known as flow load – represents the number of tasks your team is currently working on. This metric helps you understand capacity and avoid overburdening your team.
This metric should align with your team size and capabilities.
We advise you to set clear WIP limits so your team focuses on finishing tasks rather than multitasking. Tackling too many tasks at once reduces efficiency and increases errors.
%20in%20Axify.webp?width=1920&height=1440&name=work%20in%20progress%20(WIP)%20in%20Axify.webp)
High WIP levels can lead to bottlenecks and delays, while low WIP levels might indicate underutilized resources. Balancing WIP helps you maintain a steady flow of tasks so that your team remains productive without feeling overwhelmed.
Throughput
Throughput measures the number of tasks your team completes within a specific time frame. Unlike story points, which are often used in Scrum, Kanban relies on throughput to track progress and productivity in terms of completed work items.
This makes it easier to assess performance and adjust workflows.
Higher throughput generally indicates better productivity. However, the quality of work shouldn’t be sacrificed for quantity. Again, balance is key.

Monitoring throughput also helps you predict future performance, allocate resources effectively, and set realistic expectations for stakeholders. Tools such as throughput histograms clearly show your team’s productivity trends.
Why Follow Kanban Metrics?
Kanban metrics give you a clear lens into your workflow, so they help you streamline operations, reduce bottlenecks, and achieve consistent results over time. Here's a more detailed look at why you should follow Kanban metrics.

Improve Efficiency and Spot Bottlenecks Early
Using metrics such as lead time and cycle time allows you to understand how long tasks take to move through your workflow. These metrics are key for identifying inefficiencies

When tasks linger in one stage, it’s time to investigate the bottleneck. Review the code for errors, optimize handoff processes, or introduce automation to streamline repetitive tasks. Additionally, ensure resource allocation aligns with project priorities to maintain steady progress.
For example, Daman Products reported a 97% reduction in cycle times after adopting Kanban practices. You can achieve similar results by addressing potential bottlenecks early, maintaining a smooth workflow, and delivering value faster.
Improve Forecasting and Planning
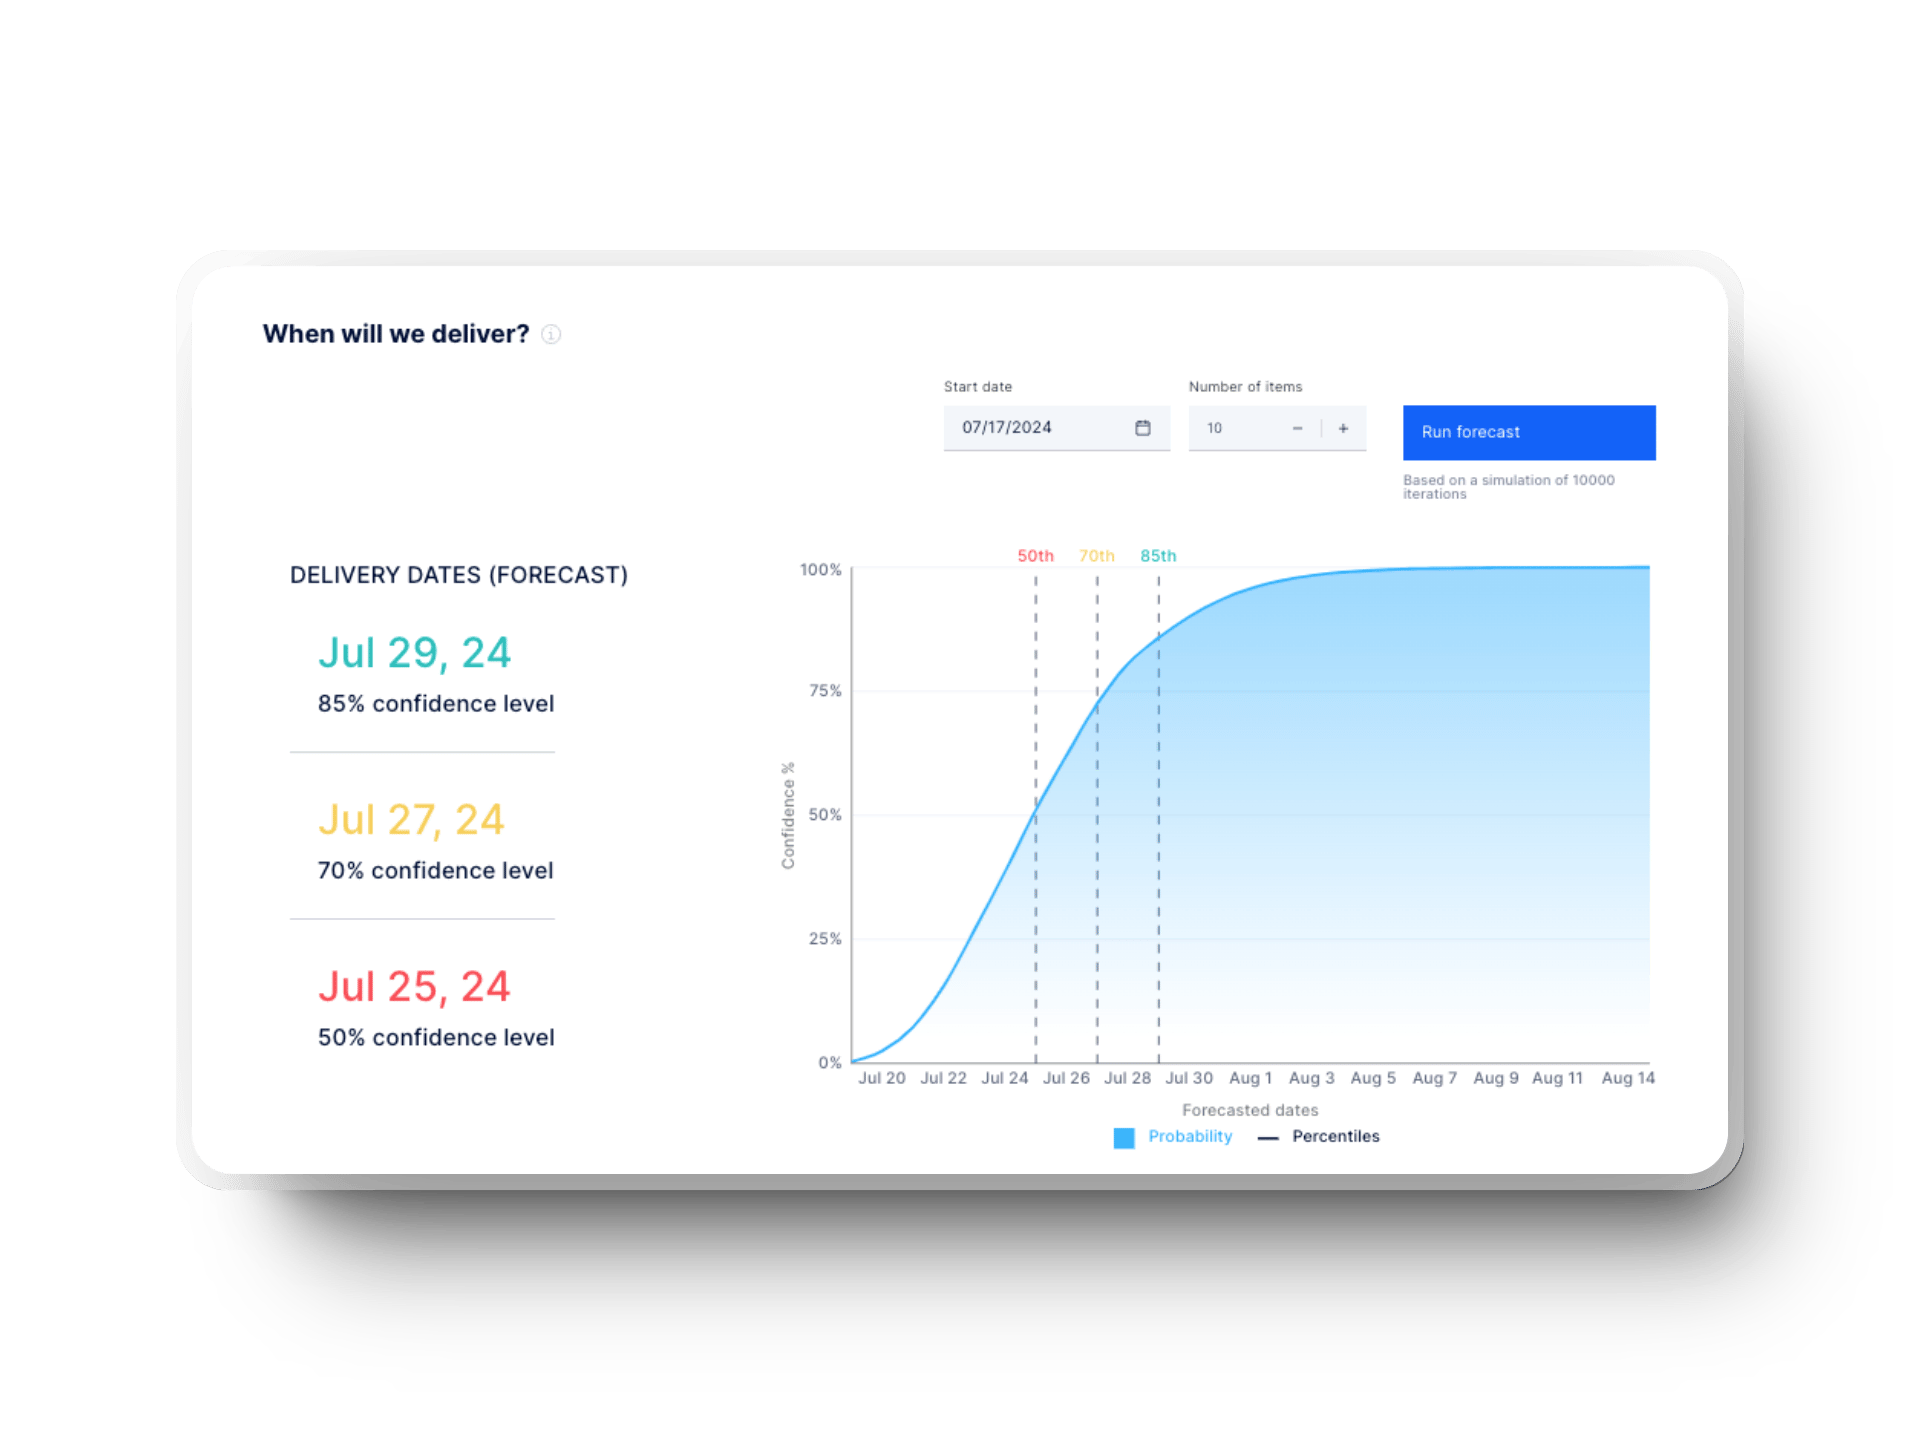
Tracking these metrics allows you to make accurate forecasts for future projects. Understanding the average time it takes to complete tasks helps you confidently set project timelines and meet client expectations. For example, a cycle time distribution chart can help you predict future work delivery times and adjust resource allocation accordingly.
Kanban’s focus on continuous improvement also promotes dynamic forecasting. This helps you adapt to changes and maintain realistic expectations across your team.
Scale Productivity and Resource Allocation
Tracking metrics such as throughput and WIP is how you keep balanced workloads.
Setting WIP limits allows you to ensure your team isn’t overwhelmed so they can focus on delivering high-quality work.
Pro tip: Where can you get started with WIP limits? A reasonable WIP limit is the number of people in your team +/-1.
Monitoring throughput gives you a clear view of your team’s output over a predefined time frame. Identifying patterns gives you solid insights into where adjustments may be needed. When you improve these metrics, you increase workflow efficiency because your team meets goals with fewer delays.

Increase Customer Satisfaction and ROI
A smooth workflow means faster deliveries and fewer defects, which translates to happier customers. After all, addressing process bottlenecks and maintaining flow efficiency allows you to increase quality and confidently meet customer requests. This ultimately leads to better ROI for your business.
Axify tracks these metrics but also integrates with solid tools with built-in reports. Having this data allows you to streamline processes. You can quickly start making data-driven decisions and take your project management to the next level.
How to Streamline Your Workflow with Kanban Metrics
Streamlining your workflow with Kanban metrics is about optimizing how tasks flow through your team. Using these metrics helps you gain actionable insights to eliminate bottlenecks and boost efficiency. You can turn data into smarter decisions for smoother and more productive processes with the right approach.
Understand the Connection: Little’s Law
Little’s Law forms the backbone of Kanban workflow improvement. It states that:
Work in Progress (WIP) = Throughput × Cycle Time
This simple formula highlights how the three flow metrics are interconnected.
You’ll need to lower WIP or increase throughput to reduce cycle time. Conversely, increasing WIP without improving throughput will stretch out cycle time and make your workflow less efficient.
Apply this principle to make actionable adjustments to keep your system stable and predictable.
For example, if you’re struggling with long cycle times, try limiting the number of tasks your team handles simultaneously.
Spot Bottlenecks and Act Fast
Metrics such as cycle time and WIP make it easier to identify bottlenecks. If tasks are piling up in a specific workflow stage, something needs attention. You can use tools to visualize these delays and implement targeted solutions.
For instance, if tasks stagnate in the review stage, you should allocate more resources or streamline the review process. We advise you to implement shift-left testing and QA early in the DevOps process.
Plan Better with Forecasting Tools
Key indicators in Kanban also improve your ability to plan future projects. Tracking average cycle times and team throughput helps you accurately predict task completion. Tools such as throughput histograms or cycle time distribution charts can give you realistic expectations for delivery dates.

This data-driven approach keeps you ahead of potential delays, lets you set achievable goals, and maintains customer satisfaction.
Get Continuous Improvement
Streamlining your workflow isn’t a one-time task but an ongoing process. Consistently analyzing Kanban metrics helps you uncover areas for improvement and improve processes as needed.
For example, reducing WIP limits or addressing inefficiencies highlighted by long lead times can create a ripple effect of better resource allocation and higher throughput.
Leverage Effective Tools for Visualization
Using digital boards and delivery intelligence software like Axify simplifies the entire process. Axify allows you to track flow metrics in real time, access visual tools, and generate built-in reports to refine your workflow.
These actionable insights allow you to create a sustainable and efficient production process. Kanban metrics provide data and a roadmap for better team performance and lasting success.
Any Disadvantages to Follow Kanban Metrics?
While metrics for Kanban are essential for improving the flow of tasks, relying solely on them may leave you with an incomplete view of your overall process. Relying only on flow metrics might overlook critical aspects such as team well-being or delivery quality.
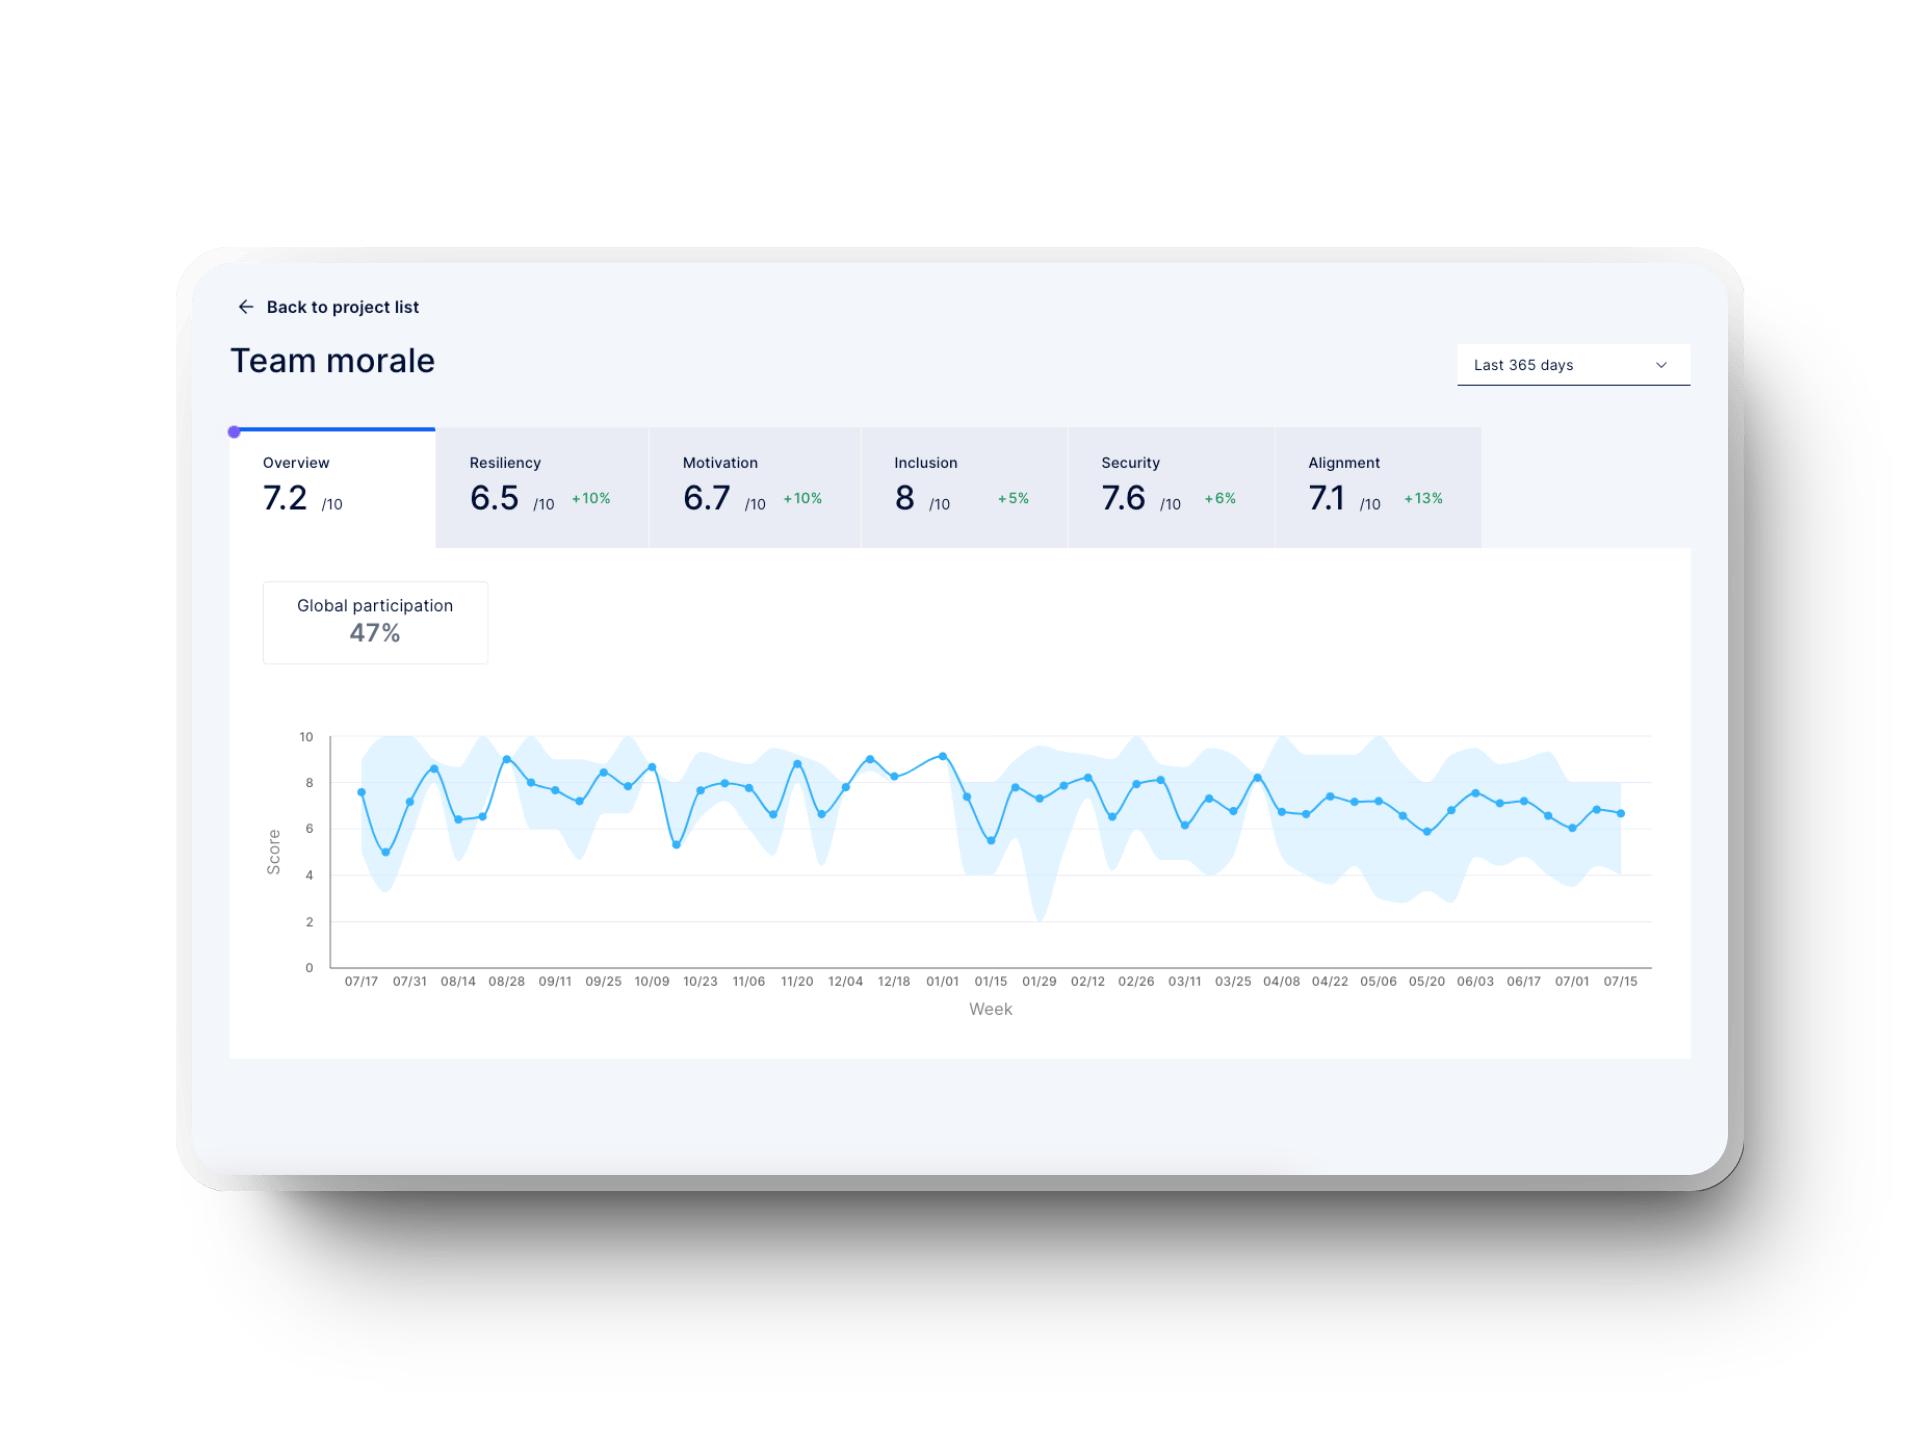
You’ll need tools like Axify’s Team Well-Being Tracker to gauge team morale and engagement.

Besides, Kanban focuses on improving the flow of value but doesn’t guide you on what to plan or deliver. Using complementary tools such as Axify’s DORA metrics, Daily Digest, and Value Stream Mapping ensures you cover gaps and achieve a well-rounded approach to team performance and productivity.

How to Measure Kanban?
Kanban measures process efficiency by focusing on long-term trends and task flow stability. A key tool for visualizing this is the cumulative flow diagram (CFD), which provides a snapshot of how work progresses over time.
Pro tip: While tools such as Atlassian Jira use CFDs, Axify takes a more insightful approach tailored for real team dynamics and makes it easier for you to address specific challenges.
A CFD tracks the number of tasks in various workflow stages over time. It helps you identify whether your team starts more items than it completes – a common pain point when implementing Kanban.
Visualizing your workflow's stability – or instability – gives you clarity on task throughput, bottlenecks, and work-in-progress trends. This tool is essential for spotting process inefficiencies and improving flow efficiency.
How Axify Measures Differently
Axify offers a workflow stability feature, which provides a streamlined way to see if your team maintains a balance between started and completed tasks. While not identical to a CFD, workflow stability serves a similar purpose but with less complexity. It’s perfect if you’re tackling Kanban’s first hurdle: stabilizing the number of items in progress.

Atlassian’s Jira is a popular option for visualizing Kanban metrics because it offers features such as cumulative flow diagrams and customizable dashboards. However, Jira’s strength lies in basic task tracking rather than providing deep insights into broader impacts.
As Axify’s VP of Engineering points out:
Many tools naively simply track bugs from the issue tracker to track incidents, which is not how people generally track them. This is ONE way, but you need to support other impact sources. That’s one way Axify surpasses other products.
– Alexandre Walsh, Axify VP of Engineering
Axify goes beyond Jira by supporting diverse data sources and impact metrics. While Jira focuses on task management, Axify integrates well-being tracking, DORA metrics, flow analysis, and Daily Digest. This ensures you’re tracking tasks and understanding how they affect your team and projects.

Streamline Your Kanban Processes with Axify
Managing your workflows and improving efficiency doesn’t have to be a guessing game. Axify offers insights from Kanban metrics, team well-being tracking, and DORA metrics – all in one streamlined platform. We help you identify bottlenecks, maximize resource allocation, and maintain a smooth flow of tasks that keeps your team productive and your projects on track.
You can also easily integrate Axify – no coding required.

Unlike other basic tools, Axify integrates seamlessly with your existing setup and gives you a clear picture of your entire process. Whether you’re looking to improve collaboration, reduce delays, or drive continuous improvement, Axify allows you to make smarter, data-driven decisions every step of the way.
Ready to see the difference Axify can make? Book a demo with us today and experience how we can transform your Kanban workflows into a more efficient and impactful process. Let’s help you achieve your goals faster.


.png?width=60&name=About%20Us%20-%20Axify%20(2).png)


