Software Development
15 minutes reading time

.webp?width=1200&name=Axify%20blogue%20header%20(14).webp)
In software development, measuring the right KPIs is the key to ultimate success. They help drive efficiency, maintain code quality, and meet business objectives effectively by providing real-time insights into team performance and areas for improvement.
If you are wondering what KPIs you should track and why they really matter, then you’re in the right place.
In this article, we will explore different software development KPIs, their benefits, and common mistakes that you should avoid.
Let’s begin.
Software development KPIs are key metrics that provide valuable insights into team productivity, code quality, and, of course, your software project's success. This helps project managers and engineering leaders make data-driven decisions that align development efforts with strategic objectives to drive long-term success.
Some essential categories include:
Many top tech companies, such as Google, LinkedIn, and Peloton, take multi-dimensional approaches to tracking developer productivity. Google’s Developer Intelligence team, for instance, measures productivity across speed, ease, and quality, recognizing that these aspects interact and reveal trade-offs.
LinkedIn uses a combination of quarterly surveys, real-time feedback, and system-based metrics to gauge developer satisfaction and tool efficiency. Peloton, meanwhile, integrates both qualitative insights from developer satisfaction surveys and quantitative metrics like deployment frequency and time to restore service, emphasizing a holistic approach to measuring engagement, velocity, quality, and stability.
Pro tip: Axify automatically selects the most relevant metrics based on scientific research. Additionally, the organizational view gives you the flexibility to choose specific indicators tailored to your team’s requirements. No need for manual data input—just pick the tool you want to integrate, and Axify will display all the most relevant metrics based on its data. Otherwise, you’d have to export all the raw data from that tool and calculate the metrics manually.
Tracking software development KPIs is crucial for building high-quality software products through the following benefits:
Following these software KPIs increases visibility for all stakeholders, from management to grassroots positions. Basically, you’ll have a common language that everybody understands. Besides, key executives will see precisely how and where software development impacts ROI.
KPIs also support continuous improvement by highlighting areas that need refinement. Coding efficiency metrics can help your team pinpoint where processes slow down. For example, idle time can indicate bottlenecks.
Effective resource allocation ensures that your team is neither overburdened nor underused. Resource allocation capabilities in Axify allow you to distribute tasks across the team evenly. This helps prevent burnout while maintaining optimal pickup times.
For instance, Work in Progress (WIP) is a worthy metric to track.
In addition, Axify’s historical throughput translates capacity insights into FTE (full-time equivalent) impact. That will give you extra clarity on whether you require additional resources to meet project deadlines and objectives.
KPIs are essential components in a slew of frameworks, like Agile, Scrum, Kanban, and other DevOps frameworks. Use them to set measurable goals that promote continuous improvement.
Also, you can build a structured reporting system that tracks progress across development phases. This keeps the project organized and brings transparency to how each team effort contributes to project goals.

Choosing the right KPIs starts understanding what you want to monitor. Teams don’t need every metric, but they do need the ones that match their goals and day-to-day reality. So, a simple framework keeps this process grounded and avoids bloated dashboards that drain attention.
The first step is understanding what the team is trying to improve. Faster cycle time, better code quality, smoother releases, fewer blockers, or better team well-being all point to different KPI sets.
This matters because employees who work with clear goals feel more energized and more willing to improve. In fact, Mooncamp research found they are 14.2 times more likely to feel inspired at work and 8.1 times more likely to seek ways to improve their performance.
Besides, clear intent makes every KPI easier to interpret.
Once the goal is clear, select the metric category that best reflects it.
For delivery health, teams often start with the four DORA metrics, which provide a high-level view of software delivery performance. For team experience, 1–2 SPACE metrics can offer meaningful insight without over-measuring. To understand workflow patterns and system bottlenecks, metrics such as flow efficiency, throughput, and cycle time provide more granular visibility into how work progresses through the system.
Once you've chosen your KPIs, validate them by asking a simple question: does this metric help us make better decisions, plan more effectively, or reduce risk in delivery? This filter prevents measuring too many things and ensures you're using the right software engineering metrics. Many teams begin with the DORA framework complemented by a small selection of SPACE indicators, adding more only when the situation calls for deeper insight.
Here are the three types of KPIs your software development team should track (ours does, too): SPACE, flow, and DORA. Let's break them down.

S.P.A.C.E. is a framework designed to measure various aspects of software development team performance, with a focus on creating a balanced view that goes beyond simple output metrics. Some of them supported by Axify include:
This metric captures how fulfilled, happy, and healthy team members feel within their roles. Axify’s Team Morale tracker provides different metrics that follow developers’ well-being. With its help, you can easily identify areas to improve team well-being and engagement. A satisfied and healthy team is more likely to perform well, collaborate effectively, and stay committed to long-term success.

In fact, a 2022 survey showed that 31% of developers felt extremely satisfied with their jobs. That number jumps to 38% if you’ve got an advanced degree but drops to 25% without one. So yes, how you support and grow your team plays a big part in how they feel.
These are the best ways to keep your team happy and engaged:
Code review velocity calculates how quickly code reviews are completed, which is crucial for maintaining development velocity and reducing bottlenecks. Faster code review velocity means fewer delays, which allows you to implement changes and improvements more efficiently.
It also reflects a well-coordinated workflow where feedback is timely to keep projects on track.
Code review velocity formula:
If you shorten the gap between accepting and merging code, you could actually speed up your entire review process by 29% to 63%. That’s what one study found after looking at over half a million code reviews. So, if you want to move faster, start by tightening that gap.
These are the steps you can take to speed up code reviews:

It monitors the percentage of code that passes review without requiring significant revisions. Basically, it highlights the overall quality and readiness of the submitted code. A high acceptance rate suggests that your developers are writing reliable, high-quality code, something that is important to accelerate the development process.
This rate also reflects effective collaboration and alignment on coding standards.
Code review acceptance rate formula:
Side note: Clickup suggests that DevOps teams tend to average a 25% code churn rate — meaning about a quarter of newly written code is quickly modified or rewritten. While this isn’t directly tied to review acceptance, persistently high churn can point to unclear requirements or misaligned planning, which often show up later as review friction or repeated rework.
Here’s how you can improve the quality of your code submissions:
Customer satisfaction is another SPACE key performance indicator that evaluates how well the final product meets user expectations. It allows your teams to align their development efforts with customer needs to ensure that product updates and features are directed toward enhancing user experience.
Customer satisfaction formula:
Here’s why it really matters: 73% of people won’t think twice about switching to a competitor if they’ve had a few bad experiences. So, if your product doesn’t meet their expectations, they’re likely already looking elsewhere. That’s a big chunk of your user base you don’t want to lose.
These are simple ways to build a better user experience:
Reliability is crucial for tracking the stability and dependability of the software to minimize failure rates and ensure consistent functionality. It directly impacts customer satisfaction, as stable software reduces the likelihood of downtime or critical errors that could disrupt user experience.
Here’s how you can keep your software stable and dependable:
Deployment frequency shows how often code is pushed to production, which reflects the team’s agility and responsiveness. Frequent deployments indicate that the team is able to deliver updates, improvements, and bug fixes at a steady pace.

Deployment frequency formula
You calculate this metric by dividing the total number of deployments by the number of days in that period. So, if your team deployed 10 times in a 31-day month, your deployment frequency would be about 0.31 per day.
That’s not so good – Elite performers should deploy on-demand or multiple times per day.
These are the steps to boost how frequently you deploy:
PR merge time measures the time taken to merge pull requests that reflect the speed and efficiency of team collaboration. A shorter merge time indicates that team members are effectively collaborating, which leads to faster implementation of new features or fixes.
PR merge times formula
Here's how PR merge times are calculated:
These are the ways to speed up pull request merges:

The time taken to review code is code review timing, which shows you the overall flow of the development process. Quick, thorough code reviews are essential for identifying issues early and maintaining the quality of the codebase.
Code review timing formula
Here's how to calculate code review timing:
If your slowest reviews drag on too long, it can start to wear your team down. That’s exactly what engineers at Meta reported. When the slowest 25% of reviews took longer, satisfaction with the whole review process dropped. So, having reasonable review times isn’t just about speed. It’s about keeping your team motivated and your process smooth.
These are the habits that improve review turnaround:
This software development metric reflects how team members perceive their productivity, which can influence their morale and motivation. It allows project managers to evaluate team well-being, adjust workloads if needed, and ensure a sustainable work pace that supports long-term success.
Here’s a number that might hit home: 58% of developers said they lose over five hours every week to unproductive tasks. That’s a lot of time you could be using to actually move projects forward. Keeping an eye on how your team feels about their productivity helps you spot these time sinks before they become bigger problems.
Here’s how to help your team feel more productive:
Velocity or flow through the system offers insights into how work items move through the development process. High velocity or smooth flow through the system indicates an efficient development pipeline, which ensures that work progresses with minimal delays.
Velocity formula
When paired with flow efficiency:
Velocity itself can also be estimated by:
An internal survey at ASOS Technology found that across more than 60 teams, the average flow efficiency was just 5%-15%. That means 85% of the time, work items were sitting idle, not being actively worked on. If you’re seeing something similar, it’s a sign to look closer at where things slow down and what you can fix to keep work moving.
These are the ways to keep your work moving smoothly:

It measures the extent to which team members can work without being disrupted. Studies show that fewer interruptions contribute to higher productivity and deeper concentration, which is crucial for complex software development tasks.
One company found that 93.6% of all productivity loss came from distractions and not from people missing work due to illness, which only made up 6.4%. So, if you want your team to stay focused and actually get things done, keeping those interruptions in check should be high on your list.
These are the best ways to reduce distractions:
Handoffs refer to the number of times a task is passed between team members or departments before completion. Each handoff introduces potential delays and communication gaps, which can slow down the workflow and increase the risk of misunderstandings or errors.
And here’s the real cost: up to 50% of the information can get lost every time work changes hands. So, if you’re bouncing tasks around too much, you’re not just wasting time. You’re losing context, clarity, and probably redoing work that shouldn’t need redoing.
Here’s how to reduce the back-and-forth:
.webp?width=1600&height=1200&name=Value%20stream%20mapping%20(VSM).webp)
DORA metrics are developed through DevOps research. They play a critical role in measuring engineering efficiency and enhancing the software development process. These include:
We've already explained what deployment frequency is earlier in this guide, but this metric also falls into the DORA metrics category.
Deployment frequency formula
Here's how deployment frequency is calculated:
To give you some context, here’s how the DevOps Research and Assessment (DORA) group breaks it down:
These benchmarks help you see where you stand and what pace you might want to aim for.
Lead time for changes is the time taken for a change to appear in the production environment. This metric indicates your team’s efficiency in getting changes from the first commit to production. A shorter lead time for changes shows streamlined workflows and prompt issue resolution.
Lead time for changes formula
Here's the formula for lead time for changes:
This KPI is typically analyzed alongside throughput to identify bottlenecks or unnecessary hand-offs that delay delivery so you can plan sprints more accurately. Teams that manage their lead time for changes well can deploy a change to production in under a day. That’s a direct boost to how fast you can deliver software without rushing or cutting corners.
Here’s how you can cut down the time from first commit to production:
 3. Change Failure Rate
Change failure rate measures the percentage of deployments that result in failures in production, which provides insights into the quality of the software development lifecycle. This KPI is a key indicator of code stability and deployment reliability. It can help you deduce the effectiveness of code reviews, testing, and quality control.
Change failure rate formula
Reducing the change failure rate means fewer failures post-deployment, which directly reduces technical debt and, therefore, enhances customer satisfaction. Here's how you can calculate your change failure rate:
If you’re aiming to match high-performing teams, try to keep your failure rate below 15%. That means fewer than 15 out of every 100 deployments should cause issues in production. It’s a strong signal that your process is solid and your code is reliable.
These are the actions that can help you lower failure rates:

This metric, formerly known as MTTR and time to restore service, calculates the time required to restore service after a failure. As a critical measure of quality, it indicates how quickly your team can address and resolve deployment issues to ensure a high level of reliability.
It works hand in hand with change failure rate to provide a clear view of response efficiency in production environments. A faster recovery time reduces the impact of failures and boosts customer experience along with system stability.
Failed deployment recovery time formula
Here’s how performance stacks up based on industry benchmarks:
Here’s how to recover faster when something breaks:

Flow metrics offer actionable insights into the efficiency and predictability of the software development life cycle. Some of them are:

Cycle time measures the period it takes to complete individual tasks in the development process, from initiation to completion. This metric measures task efficiency so you can identify and address bottlenecks that may slow down project completion.

Cycle time formula
Axify’s cycle time metric includes idle time, meaning the period when tasks are inactive, like waiting for code review or QA. Having this precise view of total task duration is crucial to optimize active work time.
Here's how to calculate your cycle time:
Elite teams can complete a user story in fewer than 3 days. Knowing that helps you pinpoint where to tighten things up.
These are the ways to shorten how long tasks take from start to finish:
Want to see these metrics live? Here’s how Axify’s dashboard looks for cycle time based on real data from your repositories and project tools.
Throughput reflects the total number of items completed over a given time frame. Higher throughput often indicates improved team productivity and efficient workflow. Axify translates the impact of increased throughput into FTE (full-time employee) equivalents, which helps evaluate team capacity for future tasks.
Throughput formula
The formula for throughput is:
Furthermore, Axify also offers historical throughput, which is quite helpful in predicting sprint outcomes and project completion without extensive estimation. The best part is that you can calculate this metric at any level you want, such as:
Here’s how to complete more work in the same amount of time:
Work-in-progress (WIP) metrics track the amount of active work within the team by offering a clear view of workload distribution across various software tasks. It’s important to maintain an optimal WIP limit (usually one less than the number of team members) to ensure that tasks are well-distributed and manageable.
WIP formula
For software teams, monitoring this metric helps maintain consistent workflow, reduces task-switching, and keeps development efforts on track for faster delivery. Here's how to calculate your WIP:
Research from DORA shows that setting clear WIP limits can really improve your team’s delivery performance, especially when you pair it with visible boards and regular feedback loops. It keeps everyone in sync and helps you catch slowdowns before they pile up.
These are the steps you need to follow to control and optimize WIP:
.webp?width=1600&height=1200&name=Work%20in%20progress%20(WIP).webp)
In Axify, this metric highlights the balance between productive work and idle time across the entire development process. In the original Flow Framework, flow efficiency also specifically compares active work to wait time rather than total cycle time.
Flow efficiency formula
Here's the formula to calculate flow efficiency:
Axify’s method gives you a comprehensive view of the overall process, but you can always look into other Flow Framework alternatives. Here are the ways you can raise your flow efficiency score:
 5. Issue Type Time Investment
Axify effectively tracks time investment by issue type, which helps you understand where your team’s efforts are concentrated. This metric, similar to flow distribution, allows you to rebalance workloads by prioritizing tasks that contribute directly to project success.
Monitoring issue type time investment also helps reduce bottlenecks and ensures alignment with broader business goals because you can focus your team on activities that drive meaningful progress.

Did you know that only about 40% of software projects hit all three targets: timeline, budget, and goals? That gap usually comes from poor estimates and unclear time use across issue types. If you're not tracking where your time really goes, you’re probably missing the mark more often than you think.
Here’s how to make better use of your team’s time:
If you want a clear view of how well your team handles incidents, mean time metrics are where to look. These time-based indicators track how fast you respond, fix, and recover from issues.
Here are the ones that matter most:
MTTD tells you how long it takes on average to spot a problem after it occurs. It helps you measure how well your monitoring tools and alerts are working. If this number is high, it means issues are going unnoticed for too long.
MTTD formula
Here’s the formula:
To improve this metric, you can:
2. MTTF: Mean Time to Failure
MTTF shows how long your system runs smoothly before the unavoidable next failure – on average. It’s typically used to measure reliability in systems, infrastructure, or long-running software.
Here’s the formula:
To improve this metric, you should:
3. MTBF: Mean Time Between Failures
MTBF gives you a snapshot of how frequently failures happen. It helps you identify recurring issues and plan long-term improvements. The higher the number, the healthier your system is.
To calculate it, you can use this formula:
Here’s how you can improve this metric:
MTTDx is for your security playbook. It measures how fast you detect a security breach or vulnerability. The quicker you catch them, the less damage you’ll have to clean up. For example, if a product runs 4,000 hours and fails 8 times, your MTTDx is 500 hours.
Here’s how it's calculated:
Here’s how you can improve this metric:
After a fix is deployed, MTTV measures how long it takes to confirm that the fix actually worked. It's about closing the loop, not just applying a patch and hoping for the best.
Here’s how you can improve this metric:
MTTC tracks how quickly you can isolate a problem to keep it from spreading. It’s especially important for high-risk environments where delay means more damage.
Here’s the formula:
To improve this metric, you should:
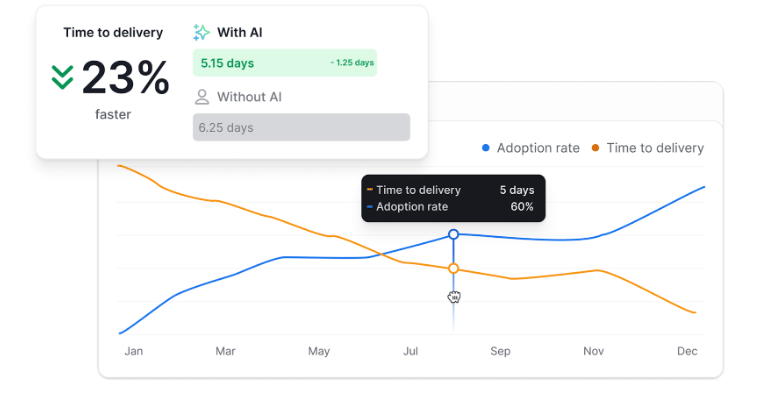
AI adoption is rising across engineering teams, but measuring its real impact can still feel difficult. Luckily, you can use Axify’s AI Performance Comparison view to see side-by-side results from “With AI” and “Without AI” periods.
Here are the metrics that matter most.
Roughly 78% of global companies now use AI in at least one part of their business, but to what extent?
The AI adoption rate metric shows how frequently your teams use AI-assisted steps across coding, reviews, documentation, analysis, and planning. A rising adoption rate usually pairs with shorter review times, smaller pull requests, or fewer idle items in teams with already solid processes.
Follow this metric to:
Over time, this metric will become a baseline for understanding how AI fits into the team’s habits.
This metric shows how your team’s time to delivery changes once AI enters the workflow. It compares two periods — before AI assistance and after your rollout — giving you a clear baseline to determine whether AI is actually helping your team ship work faster.
We use this comparison to spot early gains (or slowdowns), validate whether your rollout is working as planned, and understand the real impact AI has on your day-to-day delivery speed.
Beyond the before–after analysis, this metric also lets you track how your time to delivery evolves in real time as AI adoption increases. By continuously measuring the same KPI, you get a clear view of how your team’s efficiency improves — or where additional support might be needed — as AI becomes more integrated into your workflow.
3. AI Impact on Delivery & Flow Metrics (Ongoing Effects)
As AI adoption increases, Axify highlights how your industry-standard KPIs change and progress over time. This includes delivery time, cycle time stages, review activity, WIP behavior, and DORA metrics.
This helps you understand whether increased AI usage strengthens throughput, reduces bottlenecks, or shifts where delays appear in the workflow.
Track all this to see how AI influences day-to-day flow and whether rising adoption translates into more consistent, predictable delivery.
Certain metrics can be misleading and ineffective, which can hinder your project’s progress. Some of them are:
Story points are often used as an estimation tool in Agile development to measure the complexity or effort required for tasks. However, relying on them can lead to inaccuracies and waste of time as the cycle time between 3 points and 6 points is often the same in reality.
Contrarily, throughput, which counts the actual number of tasks completed, offers a more consistent and measurable approach. This data enables you to predict future work more accurately by improving cycle time predictability.
Counting lines of code (LOC) as a measure of productivity is outdated and misleading. More code doesn't necessarily mean better software quality. In fact, simpler code generally results in fewer bugs, greater code stability, and faster development cycles. Plus, it reduces cyclomatic complexity.
But overly depending on this metric can create a counterproductive focus on quantity over quality, which leads to complex code that's harder to maintain and optimize. Instead, you should prioritize KPIs like code coverage percentage to gain more insight into code quality and maintainability.
While pull requests can be a useful indicator of collaboration, counting them alone doesn’t provide actionable insights into team productivity or software quality. Not all pull requests are equal in complexity or importance, and using them as a key metric can overlook the distinction of each task.
Instead, monitoring software metrics like pull request approval time and deployment frequency can provide a clearer view of development efficiency. In addition, you should also focus on the frequency of code changes to understand whether your team is moving toward more stable code and a streamlined delivery process.
Pro tip: The goal of software development metrics should be to drive meaningful outcomes, not merely track output. Thus, it’s best to monitor metrics like customer satisfaction, code stability, and defect detection ratio to know the impact of development efforts on business success and product quality.
This metric looks at how straightforward and easy to follow your code is. While it seems useful because clean code is quicker to work with and easier to update, it’s tricky to measure.
If you're building something complex, clean and simple code might not be realistic every step of the way. You’ll want to be careful not to over-prioritize simplicity at the expense of necessary function.
This metric tells you how frequently your code changes in ways that introduce risk. Stable code avoids the kind of rewrites that slow you down and mess with your progress. You can track this by looking at how typically your team rewrites code, what changes introduce problems, and how often your code causes bugs or downtime.
Many teams skip this metric because it’s hard to measure cleanly. If that’s your case, you can track code churn instead. It’s not perfect, but it still gives you useful data on how often the codebase is being touched. That insight can help you understand how stable your software development efforts really are.
Sprint burndown shows how much work gets completed during each sprint. Unlike velocity, which looks at averages over time, burndown sticks to a single sprint. That can help you make quick adjustments when things don’t go as planned.
But by itself, it doesn’t tell the whole story. You’ll get more value by tracking how much scope was added mid-sprint and what percentage was completed. That gives you a better look at your team’s workload and how your actual progress compares to the plan.
Release burndown tracks overall progress across multiple sprints to help you spot if you're ahead or falling behind. You can also use this to give stakeholders a general update on where things stand.
Still, just like sprint burndown, you get more meaningful insights by focusing on scope changes and what actually got delivered. That view gives you a better context for making decisions and managing expectations.
When you’re choosing KPIs, keep it simple and focus on what really helps your team grow. There are four main areas you want to keep an eye on:
Axify helps you get that clarity by connecting to the tools you already use and turning your delivery data into focused, meaningful KPIs that surface bottlenecks and guide better decisions. Here’s how to do it:
Improving performance starts with understanding how fast and how reliably you deliver. Axify helps you do just that because it tracks all four DORA metrics: deployment frequency, lead time for changes, change failure rate, and time to restore service.
Here, you see real patterns and can also compare your results with industry standards. That way, you know where you stand and what to fix next.
VSM helps teams understand where work gets stuck. Cycle times across coding, review, QA, and deployment are shown in a clear timeline. This makes it simple to pinpoint delays such as long pickup times, idle issues, or slow handoffs.
With this visibility, teams can focus on the phase that needs the most attention. Better flow also improves planning accuracy, since it reduces the hidden delays that break sprint forecasts.
Your KPIs depend on smooth delivery. Axify’s Daily Digest points out at-risk items each morning, such as aging tasks, inactive work, or items with low collaboration.
With this, you walk into meetings already knowing what needs attention. This helps your team stay focused and move work across the board faster.
No matter the pace at which your team is currently delivering, Axify transforms your historical performance into reliable delivery forecasts. By using your team's past data, Axify provides clear confidence ranges for future delivery dates. This allows you to spot potential delays early and adjust your plans before small issues become larger problems.
You can't track software development KPIs properly if you’re skipping quality assurance. It needs to be baked into your process from the start. Whether you’re catching security issues or flagging bugs before release, QA helps you build better software.
With a solid testing process, you catch problems early before they ever reach your users. That means less time spent fixing things later and fewer bugs slipping through. It also cuts down on how frequently you have to rework code.
If you want faster delivery and cleaner results, then tightening up your QA process is one of the smartest moves you can make.
The following mistakes in tracking software development KPIs can reduce the overall effectiveness of your efforts:
A common error that many team leaders make is equating development productivity with only the completion of development tasks, such as generating more pull requests or lines of code. While these metrics might indicate activity, they don't reflect the efficacy of the work. Instead, allocate some time to process optimization as well so you can increase customer satisfaction and, therefore, your ROI.
If you emphasize the performance metrics of individual members, it can create competition rather than collaboration within your development team. Since effective software development requires team alignment and optimized systems, this step is a big no.
And there’s clear evidence of the risk. One company reported a 23% rise in individual productivity scores but a 67% surge in project failure rates when every minute of developer work was tracked. This shows that strong numbers at the individual level don’t mean much if the broader system becomes unstable or disconnected.
To avoid this, your focus should be on tracking collaborative KPIs like flow efficiency, deployment frequency, and team velocity to get actionable insights for continuous improvement at the system level.
Metrics that focus only on internal processes overlook the customer experience. Therefore, you must consider incorporating customer satisfaction or feedback KPIs alongside them so your team can see the impact of their work from the user’s perspective. This helps align development efforts with customer needs and achieve long-term business success.
The goal is to keep dashboards simple, actionable, and fully automated. Many teams use dashboards that need constant manual updates, filters, and custom cards. But Axify removes that work by connecting directly to your repositories and project tools.
Once the integrations are active, the dashboards start filling themselves in minutes. Here’s how we set it up internally at Axify.
Everything begins with one unified dashboard. Instead of juggling cycle time cards, lead-time charts, cumulative flow, and sprint burn charts like in many traditional setups, Axify pulls all those signals from your SDLC tools automatically. This gives every stakeholder the same view without extra configuration.
After setup, the team dashboard becomes the daily reference point. It brings together DORA metrics, flow time, review duration, WIP, and well-being signals in one place.
For deeper investigation, the Value Stream view shows the exact phase where delays happen. Meanwhile, the Daily Digest shows items that need attention during stand-ups.
Axify gives every stakeholder the visibility they need, no matter their role. You can view performance at the organizational level, drill down by line of business, compare specific projects, or zoom in on individual team dashboards.
This layered visibility lets leaders see broad delivery patterns while giving teams the detailed insights they need to understand what’s happening in their day-to-day workflow. Whether you’re overseeing multiple portfolios or managing a single team, Axify provides a clear, consistent view of where things stand—and where attention is needed
Effective tracking of software development KPIs is essential for understanding every aspect of the software development process and achieving business goals. They support data-driven decisions that enhance team productivity, streamline the software development lifecycle, and maintain code simplicity and stability.
However, accurately measuring all these KPIs can get overwhelming due to the complexity of managing and updating multiple available metrics. That's where Axify comes in with an intuitive platform that consolidates essential metrics into a single dashboard.
Ready to simplify your KPIs tracking process? Sign up with Axify today and get a 14-day free trial to see how we can elevate your development process!

You should track KPIs that help you measure how fast, stable, and predictable your team is. For example, metrics like deployment frequency, lead time for changes, code stability, and cycle time give you a clear view of your progress.
Don’t forget to include collaboration and predictability metrics. These help you plan better and keep everyone moving in the same direction.
A KPI in the IT space is a key performance indicator that helps you track how well your team or system is doing. It’s a goal you’re working toward. Whether it’s faster delivery, fewer bugs, or better uptime, KPIs give you something real to measure against so you can show impact and adjust as needed.
You can use Axify to track performance in a smarter, more complete way. Instead of focusing on just output, look at code review speed, deployment quality, and how frequently your team hits sprint goals. Mix those with developer satisfaction and workflow balance to get the full picture.
In DevOps, your go-to KPIs should be the DORA metrics. That means lead time for changes, deployment frequency, change failure rate, and failed deployment recovery time. These give you a solid grasp of how reliable and efficient your engineering setup is. If you want to make the case for scaling your team or fixing your pipeline, this is where to start.
For QA, it helps to track both process and product metrics. You’ll want to keep tabs on things like test coverage, bugs found in production, defect detection rate, and how long it takes to fix issues.
Also, look at metrics like cycle time and the number of bugs found per tester hour. These will help you stay focused on quality and catch problems before your users do.