Software Development
18 minutes reading time


To succeed in software development, you shouldn't just focus on completing tasks. You should see how well your team works together, how efficiently they deliver results, and how consistently they meet their sprint goals.
Tracking the right Scrum metrics helps you understand your team's progress, identify opportunities for improvement, and align your efforts with larger business objectives.
We’ve seen how with the right metrics, you can transform daily stand-ups, sprint planning, and retrospective meetings into insights that improve team productivity and project outcomes. Whether you're analyzing sprint velocity or cycle time, each data point gives you the power to improve your processes and achieve better results.
At Axify, we're here to help you turn these insights into consistent performance.
Let's get started with the Scrum metrics that every Agile team needs to know.
Scrum metrics are data points that measure your team's performance, track sprint progress, and evaluate the overall health of your projects. These metrics give you a clear picture of how your development process is performing, from understanding team velocity to analyzing cycle time.

Focusing on Scrum-specific metrics allows you to identify bottlenecks, improve team effectiveness, and ensure your efforts align with all the correct Agile principles (like continuous improvement).
Your Scrum team also relies on these insights to plan future sprints, monitor sprint backlog completion, and evaluate team satisfaction and productivity. Based on what we’ve observed, you need these metrics to make informed decisions and keep product quality aligned with your business goals.
Pro tip: Axify simplifies Scrum metrics tracking by displaying all essential key performance indicators chosen according to scientific studies. That's because we want to keep your team aligned and focused on consistently delivering results.

Scrum metrics focus on performance within structured, time-boxed sprints. Kanban metrics, on the other hand, prioritize maintaining a steady workflow.
Let's explain these two in more depth.
Scrum metrics help you track sprint planning, delivery goals, and predictability. They give you insights into stability and progress. Metrics such as team velocity and ceremonies like sprint retrospectives and sprint reviews let your development team improve their approach. That's how they ensure each sprint contributes to continuous improvement efforts.
Kanban metrics focus on throughput, consistent cycle times, and work in progress (WIP) limits. They help you visualize how work moves through your process. These Agile metrics allow you to improve your team's performance by showing bottlenecks and inefficiencies that you can then fix.
If you want to learn more about the difference between these two, check out our guide on Scrum vs. Kanban metrics.

Pro tip: Axify is framework-agnostic, which means you can track all your key metrics regardless of whether your team uses Scrum, Kanban, or the hybrid approach called Scrumban. Thus, you have one powerful tool for valuable insights.
Scrum metrics are important for your team's success. As we already explained, they clearly show how well your team is performing, help you improve processes, and deliver better results. Here's how they make a difference:
Teams that fully adopt Scrum see solid results.
Studies show that Full Scrum has helped teams achieve 250% better quality than teams that don't use it. It's no wonder that 78% of teams use Scrum with other Agile frameworks to achieve consistent performance.
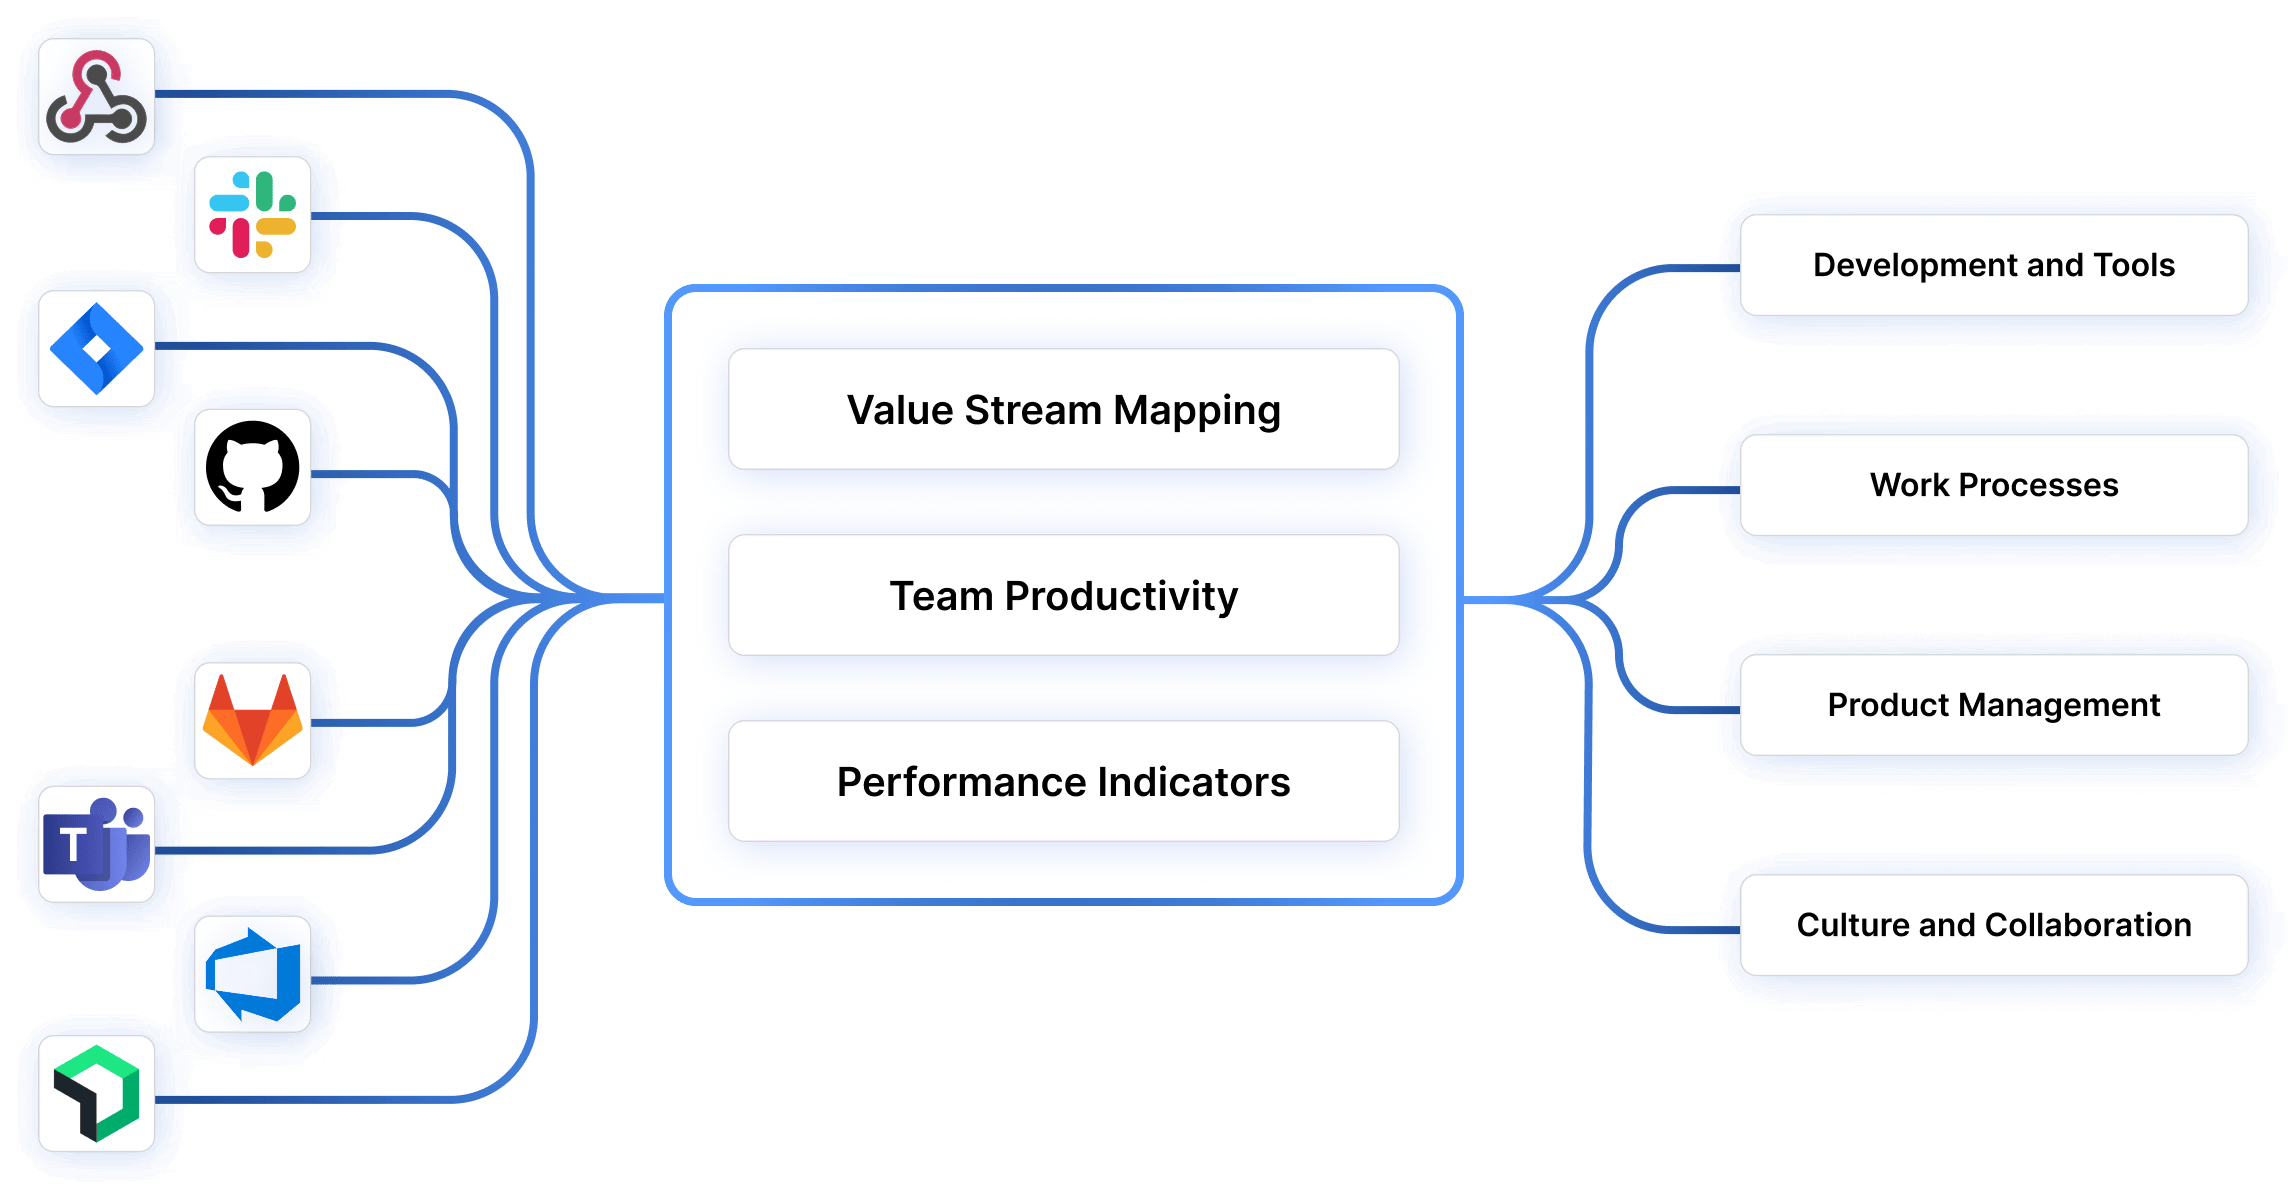
Value stream management builds a clear line between Scrum metrics and executive outcomes. Axify’s value stream mapping tool (VSM) pulls data from the tools your teams already use, like project management and development tracking systems, then turns it into a visual map of the development cycle from planning through post-development.
That visibility helps leadership see how work flows, where delays form, and how decisions affect business value over time. Instead of sprint-level snapshots, executives get trend-based signals tied to risk, predictability, and software quality. This view supports Agile leadership by grounding conversations in evidence.
With shared visibility across teams, Scrum metrics become a way to guide investment, reduce delivery risk, and improve confidence in roadmap commitments.
Our clients see real, measurable results from value stream management because it makes work visible across teams.
For example, after introducing value stream mapping for visibility, two teams at the Development Bank of Canada doubled their delivery throughput and achieved approximately $700,000 in recurring productivity gains per year, along with a 24% increase in available capacity and a 10X return on investment. One of the core practices behind these improvements was using VSM to understand how work actually flows and where it gets stuck.
As one BDC manager explains:
"The Value Stream Mapping (VSM) we did has immense value. The team sees what happens, the impact of their actions, and areas for improvement."%20(1).png?width=56&name=bdc%20logo%20-%20autheur%20blog%20axify%20(150%20x%20150%20px)%20(1).png)
Josée Gagnon
Manager
Tracking the right Scrum metrics helps you better understand your team's performance and make smarter decisions. Here, we'll show you the key metrics to focus on. You'll also see how to leverage these KPIs to scale your team performance.

Flow metrics help show how work actually moves through your sprint. These signals give clarity on speed, stability, and hidden delays across the workflow.
Below are the core flow metrics Scrum teams rely on to guide daily decisions and longer-term improvements.
1. Velocity
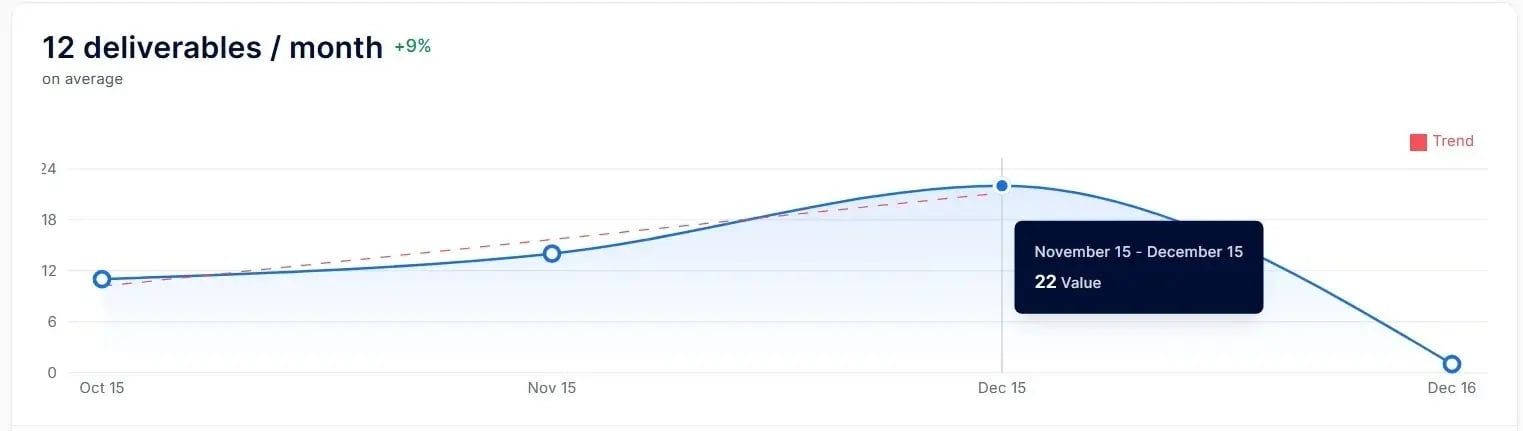
Velocity reflects how much work the team completes during a sprint based on past delivery patterns. We advise you to use it as a planning signal rather than a performance score. A Scrum master can review trends in a velocity chart to spot volatility and adjust sprint scope before commitments slip.
For example, in one tech company, structured velocity tracking with rolling averages increased sprint completion from 40% to 85% and raised delivery prediction accuracy to 90%. This shows how consistent velocity analysis improves forecast confidence.
Axify helps you track velocity by turning completed deliverables into a clear, trend-based view that reflects real delivery patterns. This is how that velocity view looks in practice:
2. Sprint Burndown
Sprint burndown tracks how much planned work remains throughout the sprint. This view helps detect scope creep, stalled work, or uneven progress before sprint goals slip.
We recommend reviewing the sprint burndown chart during daily check-ins to support faster course correction when delivery drifts off plan.
3. Sprint Burn-up
Sprint burn-up shows completed work against the total scope, including changes added during the sprint. This metric helps you separate progress issues from scope growth. A product owner can use burn-up trends to make clearer tradeoff decisions when priorities shift mid-sprint.
4. Cycle Time
This metric measures the total time it takes to complete a task from start to finish. However, it doesn't include the backlog period.
We help our clients shorten cycle time correctly so they can complete tasks more quickly while maintaining good product quality. The point is to improve responsiveness to changes and ensure faster progress in each sprint.
You can use Axify to identify delays and adjust your workflows for better future performance. Here's how that looks in our platform:

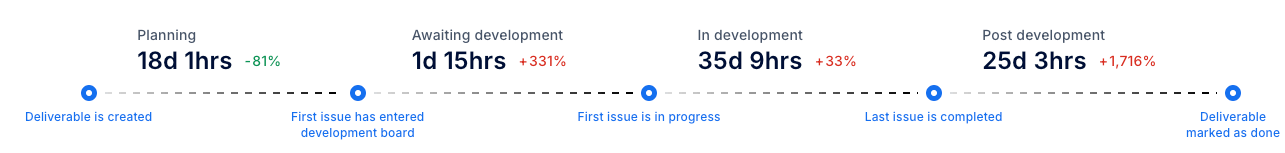
5. Lead Time
Lead time measures how long work takes from the moment it enters the backlog until completion. This metric reflects how responsive delivery feels from a stakeholder perspective.
A related Kanban and Lean case report from ActionableAgile found that the 85th percentile lead time was 16 days. This means most work items are finished within that window in the studied environment. Tracking this trend supports better expectation setting in Agile project management.
6. Throughput
This metric measures the number of tasks your team completes within a specific time frame. In our experience, it gives you much better insights into team efficiency and consistency compared to story points.
Monitoring throughput trends in Axify helps you identify bottlenecks, understand team capacity, and make data-driven decisions to optimize workflows.
For example, you might adjust task prioritization or implement changes to improve collaboration and productivity. You can also add more automation and shift left on your QA processes to improve project plans and delivery speed.

7. Work in Progress (WIP)
Work in progress measures how many tasks your team handles at the same time, which directly affects focus and flow. When WIP climbs too high, attention gets split, and real progress slows down.
A widely cited 2010 study that hasn’t yet been replicated shows that only about 2.5% of people can multitask effectively, so most teams pay a cost when too many items stay open. That overload usually shows up as lower output, more mistakes, and longer cycle times.
We made sure Axify tracks WIP well, giving you maximums, averages, and minimums. That way, you can adjust work correctly so your development teams stay productive without overwhelming their capacity. Here's how it looks:
%20in%20Axify.webp?width=1920&height=1440&name=work%20in%20progress%20(WIP)%20in%20Axify.webp)
8. Cumulative Flow Diagram (CFD)
A cumulative flow diagram shows how work items move through workflow states over time. This view makes queues, bottlenecks, and imbalances visible at a glance. Reviewing cumulative flow diagrams regularly helps leadership understand whether flow stays stable or degrades as demand increases.
Quality and reliability metrics show whether delivery speed comes at the cost of stability. These signals help teams spot risks before they turn into incidents or customer-facing issues. Here are the core metrics Scrum teams use to understand failure patterns, recovery speed, and long-term code health.
9. Change Failure Rate
Change failure rate represents the percentage of deployments resulting in failures that need fixes. Axify lets you visualize failure trends and work on reducing defects in upcoming sprints. High-performing teams usually aim for CFR rates between 5-20%.

10. Failed Deployment Recovery Time
Failed deployment recovery time (formerly Mean Time to Recovery) measures how long it takes to resolve issues after a failure.
And unfortunately, around 80% of MTTR time is spent diagnosing the root cause of failure, typically identifying and fixing bugs.
If you want even more data, know that on average, software projects experience 15-50 bugs per 1,000 lines of code.
That’s why we recommend monitoring bug counts and addressing critical issues early. We encourage shifting left on QA and reducing approval bottlenecks as much as possible to reduce recovery time and ensure project stability.
Axify’s data can help your team allocate resources effectively and, ultimately, maintain low defect density. The end goal is to deliver a higher-quality product and maintain consistent progress.

11. Time Investment on Bugs
How many bugs you have is not the only bug-related indicator that matters. How much time you spend on fixing them also matters. Some studies show that developers spend 75% of their work hours debugging, and that's about 1,500 hours annually.
To fix that, you should track how debugging impacts team productivity.
We always encourage our clients to track how much time they spend on bugs and KTLO compared to innovation. The goal is to ultimately improve your team's balance between bug fixes and delivering user stories.

12. Escaped Defects
Escaped defects measure how many issues reach production despite testing and review. This metric reflects gaps in test coverage, review practices, or release readiness. Tracking escaped defects is a good starting point to tighten feedback loops and adjust testing depth before issues reach customers.
13. Defect Density
Defect density measures the number of defects relative to system size, usually per lines of code (which we don’t recommend at Axify) or functional scope. However, if you use this metric correctly, we agree it supports comparisons across releases and components without relying on raw bug counts.
In fact, existing defect management strategies in leading software industries report up to 96% defect-free delivery. This may not always be doable, but at the very least, it sets a compelling benchmark for quality-focused teams.
14. Technical Debt Index
The technical debt index estimates how much effort is required to fix accumulated shortcuts in the codebase. This metric connects today’s delivery decisions with future maintenance costs.
Developers spend about 23% of their working time dealing with technical debt. This explains why tracking this index (and fixing the issues it signals) helps teams protect long-term delivery capacity and stability.
Predictability and planning metrics show whether delivery commitments hold over time. These variables help teams move from reactive planning to steady execution and longer-term release confidence.
15. Story Completion Ratio
Story completion ratio compares the work committed at the sprint start with the work actually finished. This metric shows whether planning assumptions match real delivery capacity.
We encourage tracking this ratio to adjust your estimation practices and reduce overcommitment without slowing delivery.
16. Sprint Goal Success
Sprint goal success measures how frequently the sprint objective is fully achieved by the end of the iteration.
One thing we like about this metric is that it focuses your attention on outcomes rather than task volume. Consistent sprint goal success signals stable prioritization and alignment between planning and execution.
Conversely, not reaching your sprint goals consistently shows potential issues like overcommitment, unclear sprint objectives, scope changes during the sprint, or systemic blockers.
17. Release Frequency
Release frequency tracks how frequently completed work reaches users. This metric reflects delivery confidence and operational readiness across sprints.
Monitoring release frequency helps you understand whether planning supports steady value delivery or creates batching and delay.
Outcome and value delivery metrics show whether shipped work actually matters to users and the business. These signals move the conversation from output volume to real impact at the customer level.
Here are the metrics that help teams connect delivery decisions with customer response and long-term value creation.
18. Customer Satisfaction
Customer satisfaction measured through Net Promoter Score reflects how users feel about the product after each release cycle. This metric captures whether delivered features solve real problems or create friction. Tracking NPS trends is a good way to validate priorities and adjust focus before dissatisfaction turns into churn.
19. Feature Adoption Rate
Feature adoption rate measures how many users actively use newly released features. This metric shows whether development effort translates into actual usage. Low adoption signals misaligned priorities or unclear value; if you see this, we advise you to refine backlog choices and release scope.
20. Innovation Rate
Innovation rate tracks how much delivery capacity goes into new capabilities versus maintenance or fixes. This metric shows whether teams invest in future growth or stay locked in reactive work. Monitoring innovation rate helps balance near-term stability with long-term product direction.
Team well-being and engagement metrics show whether delivery pace is sustainable over time. These signals help teams reduce burnout risk while keeping collaboration healthy.
Here are the metrics that connect day-to-day work conditions with long-term delivery stability and retention.
21. Team Happiness
A positive team culture can lead to up to 400% revenue growth. That's why you need an indicator like team happiness, which measures how satisfied and motivated your team feels while working.
To improve team happiness, you first need to be able to measure it, and Axify's team wellbeing tracker is a solid tool. Monitoring important metrics related to this will help you spot and correct issues early on.
You'll be able to create psychological safety, positive team dynamics, and better collaboration across cross-functional teams.

22. Workload Distribution
Workload distribution shows how tasks and responsibilities are spread across the team. This metric notes imbalances that usually lead to stress, delays, or hidden dependency risks.
Tracking workload distribution over a sufficient period of time is a good way to reduce overload on key contributors. That way, you can support healthier engagement without slowing progress and achieve smooth delivery.
Executive-focused metrics translate delivery activity into signals about risk, return, and growth. These indicators support decisions that shape funding, staffing, and portfolio direction.
From our experience, these are the most important metrics that connect Scrum execution with outcomes leaders care about at the business level.
23. Time to Market
Time to market measures how long it takes to move an idea from commitment to customer availability. This metric reflects delivery speed, decision friction, and coordination across teams. We advise you to track time to market consistently to understand whether process changes reduce delay or introduce new bottlenecks.
24. Revenue per Employee
Revenue per employee shows how effectively delivery capacity converts into financial output. We like this metric because it links engineering effort with business results without focusing on individual performance.
We encourage monitoring this trend to assess whether scaling teams improves returns or adds operational drag.
25. Cost of Product Domains
The cost of product domains measures how much investment goes into building, running, and maintaining specific product areas. This metric supports clearer tradeoffs between innovation, maintenance, and operational spend.
Tracking domain-level costs helps leadership guide investment decisions with a sharper view of value creation and risk.
If you read so far, you know that Scrum metrics track your team's performance and guide your continuous improvement efforts. To help you even more, we've created a Scrum metrics template outlining the key indicators, their definitions, and how to use them effectively. We also created a downloadable Excel table. You can use it to track key Scrum metrics across different tasks.
|
# |
Metric |
What it measures |
What to watch for |
|
1 |
Velocity |
Work completed per sprint |
Large swings = unstable planning |
|
2 |
Sprint Burndown |
Remaining work in sprint |
Flat lines = blocked or stalled work |
|
3 |
Sprint Burn-up |
Progress vs total scope |
Scope growth vs delivery issues |
|
4 |
Cycle Time |
Time to complete a task |
Long cycles = review/testing delays |
|
5 |
Lead Time |
Time from backlog to done |
Long lead time = low responsiveness |
|
6 |
Throughput |
Tasks completed per period |
Drops = bottlenecks, spikes = change |
|
7 |
Work in Progress (WIP) |
Tasks handled at once |
Too high = overload, context switching |
|
8 |
Cumulative Flow Diagram (CFD) |
Flow stability across states |
Widening bands = queues, imbalance |
|
9 |
Change Failure Rate |
% of failed deployments |
High rate = quality or release issues |
|
10 |
Failed Deployment Recovery Time (MTTR) |
Time to restore service |
High MTTR = slow diagnosis/rollback |
|
11 |
Time Investment on Bugs |
Effort spent fixing bugs |
Too high = low innovation capacity |
|
12 |
Escaped Defects |
Bugs reaching production |
Rising count = testing gaps |
|
13 |
Defect Density |
Defects per scope size |
High density = systemic quality issues |
|
14 |
Technical Debt Index |
Effort to fix shortcuts |
Growth = future delivery risk |
|
15 |
Story Completion Ratio |
Planned vs completed stories |
Low ratio = overcommitment |
|
16 |
Sprint Goal Success |
Sprint objective achieved |
Misses = scope drift or blockers |
|
17 |
Release Frequency |
How often work is released |
Low frequency = batching, risk |
|
18 |
Customer Satisfaction (NPS) |
User sentiment post-release |
Declines = misaligned priorities |
|
19 |
Feature Adoption Rate |
Usage of new features |
Low adoption = weak value signal |
|
20 |
Innovation Rate |
Capacity for new work |
Low rate = too much KTLO |
|
21 |
Team Happiness |
Team morale & engagement |
Drops = burnout risk |
|
22 |
Workload Distribution |
Task spread across team |
Imbalances = stress, dependencies |
|
23 |
Time to Market |
Idea to customer delivery |
Long time = coordination friction |
|
24 |
Revenue per Employee |
Output per headcount |
Declines = scaling inefficiency |
|
25 |
Cost of Product Domains |
Spend per product area |
Rising cost = poor ROI or drag |
Teams can use this table as a lightweight metrics tracker. Fill in current values weekly or per sprint, mark trends with arrows, and add short notes when something changes. In time, patterns become more important than individual numbers.
Scrum metrics show you issues and patterns. You can use these insights to solve difficulties and improve your team's efficiency and focus.
Here's the problem:
Tracking the correct data helps you improve planning, reduce bottlenecks, and ensure consistent progress, but only if you know how to use it.
Here's how to use specific metrics to scale your team's performance and deliver better results.
We’ve found that looking at past sprint velocity helps you set realistic expectations for how much work your team can handle. You can use this data to set achievable goals for your next sprint.
For example, if your team completes an average of 10 backlog items per sprint, assigning them more than this risks overcommitting and lowering morale.
You can also use Axify's software delivery forecasting tool to estimate the number of items your team can deliver over a specific period and their deadlines. These trends keep your planning realistic and aligned with your team's capacity so everyone works sustainably without compromising quality.

Your planned-to-done ratio shows how much of your planned work was completed in recent sprints. If this ratio regularly falls below 80%, it's a sign that your team's capacity may be overestimated.

Hence, we advise you to adjust your future sprint plans to align more closely with what your team can realistically accomplish. This will create a balance between ambition and feasibility, boost team morale, and improve the success rate of your sprints.
If tasks take too long to complete, you should break down large user stories into smaller, manageable tasks. This will make progress more visible and reduce each task's time spent in development.
You can track how quickly these smaller tasks move through the sprint. This improves efficiency and helps you spot potential bottlenecks early to ensure smoother workflows and better outcomes for your team.
Tracking the age of in-progress tasks helps uncover bottlenecks that could slow your team down. If a task remains untouched for several days or weeks, it signals that something might prevent progress. So, make sure to bring these stalled tasks up in your daily stand-ups to identify and resolve the issue quickly.
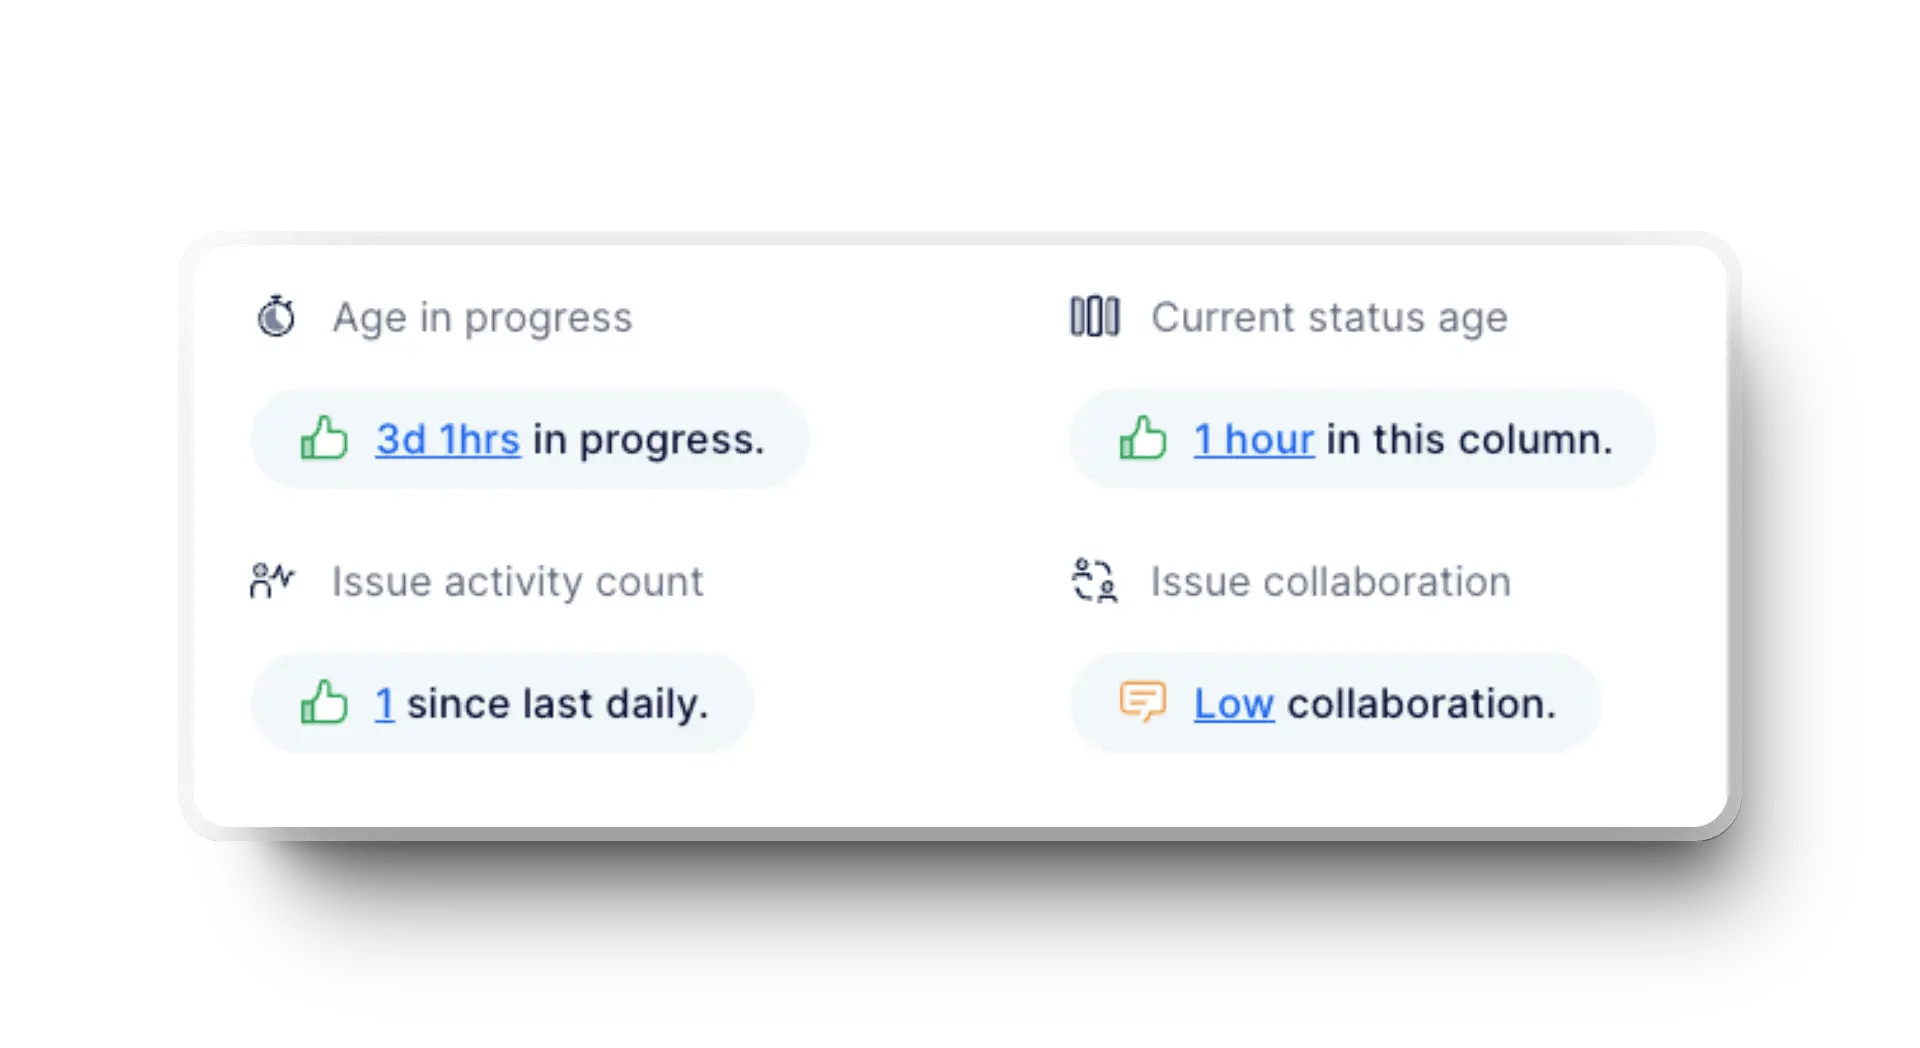
For example, if a user story has been idle for three days, ask your team what's holding it back. Addressing these delays promptly improves workflows and keeps your sprint on track.
Remember: The point is not just to keep your momentum strong but to prevent errors that can snowball in the future, both in terms of resources you waste for solving them and customer satisfaction.
Defect density reveals how many bugs or issues exist relative to completed work. A high defect density means your sprint output could be suffering in quality. So, you should prioritize resolving technical debt and bugs in your next sprint to keep standards high.
For instance, dedicate 20% of your sprint to fixing critical defects that might otherwise derail your team's progress. This focused approach reduces potential risks and improves the overall reliability of your product. It ensures that your sprints consistently deliver value without compromising quality.
DORA metrics give you a clear picture of your team's performance over time, and combining these insights with retrospectives can uncover valuable lessons. You can use trends from these metrics to identify pain points, such as a sudden drop in deployment frequency or oversized deployments causing delays.
Here's how you can track these metrics in Axify:
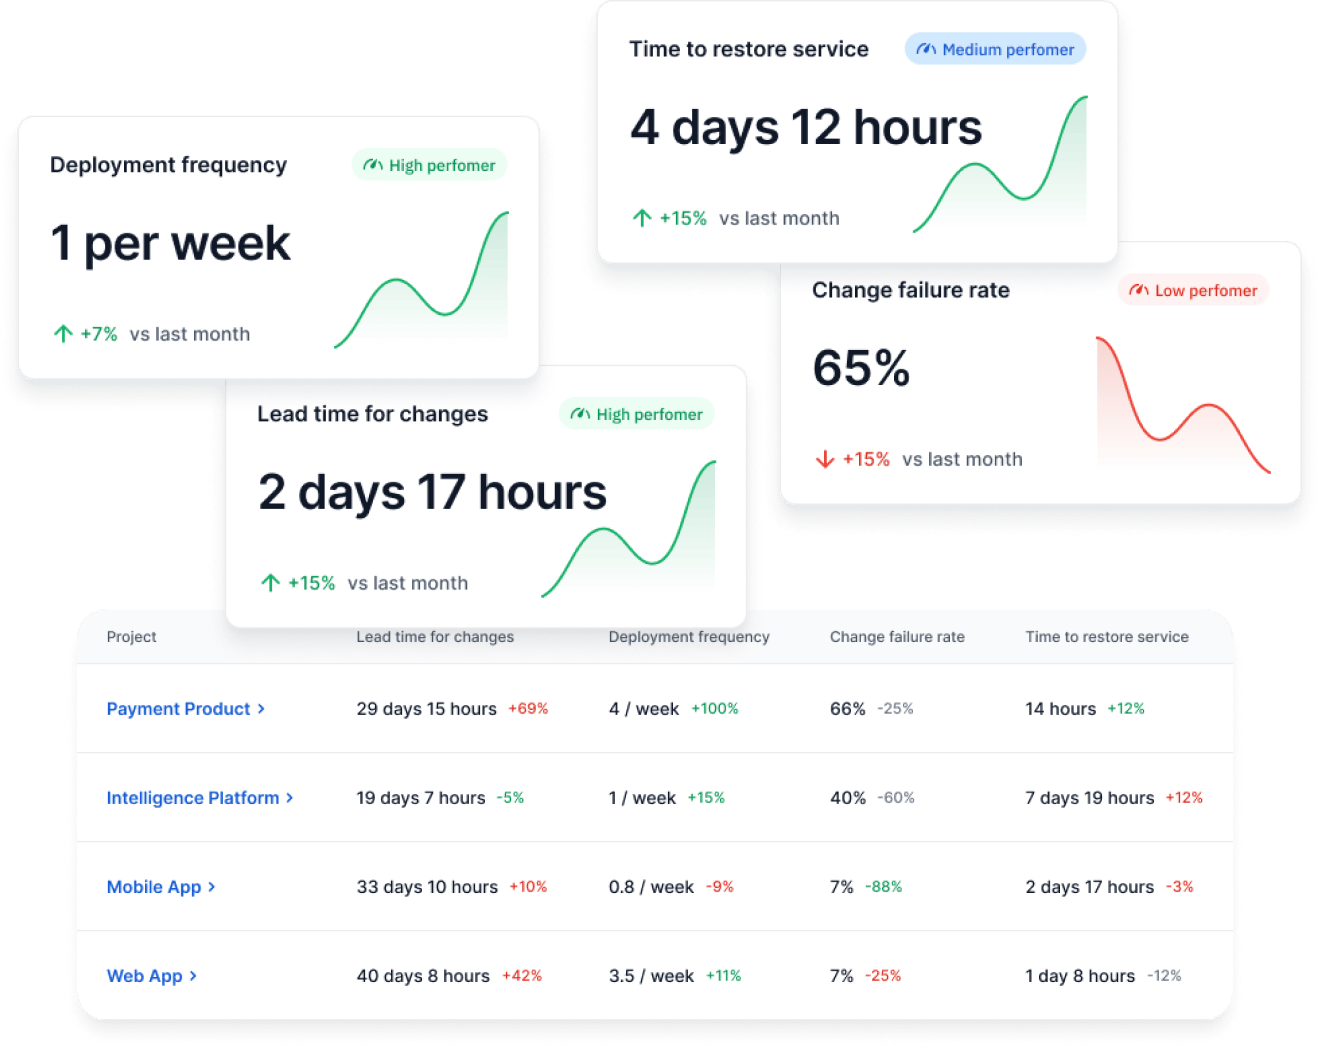
We advise you to pinpoint these issues so you can create actionable plans to improve future workflows. This combination of retrospectives and DORA insights keeps your team aligned and continuously moving toward better outcomes.
Tracking Scrum metrics is essential for keeping your team aligned and improving over time. However, how you approach metrics can make or break their effectiveness. The best practices below can help ensure your metrics drive real value without creating unnecessary friction or confusion.
Scrum metrics are most valuable when you look at trends over time rather than isolated numbers. A single data point might not tell you the whole story. For example, a one-time dip in velocity could result from unexpected external factors rather than a systemic issue.
Trends, however, show consistent patterns and give you deeper insights into your team's performance. Focusing on these patterns helps you make informed decisions that lead to meaningful improvements in your processes and project outcomes.
Metrics are designed to show opportunities, so don't focus on pointing fingers. When you use metrics to assign blame, you create a culture of fear that stifles collaboration and innovation. Instead, we advise you to use them to identify areas where your team can grow and support them in making changes.
Fernando Almeida and Pedro Carneiro outline the issue in their study, Perceived Importance of Metrics for Agile Scrum Environments.
“If two teams have similar skillset, shouldn’t their velocities be similar?”, “Team A’s Velocity is 2 times that of Team B’s—shouldn’t Team A work on the remaining Product Backlog Items for faster delivery?” The answer to this question lies in the differences in the starting point between both teams and the estimates made for each user story. Thus, speed comparisons between the two teams can be a metric with negative effects and make the teams uncomfortable.
The solution is to let metrics be the foundation for positive change rather than conflict.
Metrics are most effective when everyone on your team understands and supports their purpose. You should involve your team in discussions about which metrics to track and how to use them. When your team feels ownership over the process, they're more likely to stay engaged and work toward improvement.
Research shows that companies with highly engaged employees achieve 23% higher profitability than their competitors. That's the power of collaboration and commitment.
That's why we advise you to encourage open conversations during retrospectives or planning sessions. Discuss alternatives if the team feels specific metrics don't accurately reflect their work. This will boost engagement and ensure the metrics you track align with your team's reality.
Choosing the right tools to track Scrum metrics is key to keeping your team aligned and improving performance. The right tool will simplify the process and provide actionable insights to guide your decisions.
Let's see three standout options for engineering teams.
Axify takes your Scrum tracking to the next level by offering in-depth, real-time insights into essential metrics like DORA, cycle time, and work in progress. It's built to give you a clear picture of your team's performance across all stages of the development process. With Axify, you can align your teams seamlessly and stay ahead of potential issues.
What makes Axify unique is its framework-agnostic approach. Whether you follow Scrum, Kanban, or a mix, Axify pulls data from your tools and provides meaningful, actionable reports.
You'll love how it helps you notice bottlenecks, reduce change failure rates, and support continuous improvement. All this leads to better outcomes and happier teams.
If you're already using Jira for project management, you've got access to some excellent built-in tools for tracking Scrum metrics. Jira's burndown charts help you visualize the remaining work in a sprint and keep your team on track to meet sprint goals. Sprint tracking features let you monitor progress and adjust plans when necessary.
Jira's integrations with other tools and its flexibility make it a popular choice for Agile teams. You can easily customize workflows and track everything from backlog items to sprint retrospectives. While the platform requires some setup to leverage its full potential, it's a solid choice for teams wanting detailed sprint progress data.
If you need a straightforward, visual approach to tracking progress, Trello is a fantastic option. Trello's kanban-style boards are perfect for organizing tasks, tracking WIP, and keeping the entire team in sync.
The drag-and-drop functionality makes it easy to update task statuses, and you can add custom labels, due dates, and checklists for additional clarity. But while Trello may lack advanced metrics tracking, it's ideal for teams that value simplicity and collaboration. It's beneficial for smaller teams or those new to agile methodologies.
Scrum metrics give you visibility into delivery speed, quality, predictability, and team health across every sprint. When you look at these signals together, patterns around risk, bottlenecks, and missed commitments become easier to spot.
The real value comes from tracking the right metrics consistently and understanding what their trends mean for planning and execution.
Axify can help you with both issues. Our dashboards are intuitive and comprehensive, and we also offer hands-on team support and mentoring to help you make the right changes.
Ready to see how Axify can transform your team's performance and simplify your workflow with real-time insights? Book a demo today and take the first step toward smarter, more efficient development!
