AI
17 minutes reading time

AI spend management in engineering means tracking what you pay for AI coding tools, assigning costs to teams, and checking whether the work delivered justifies the bill.
As developers add tools and run AI agents, those bills can grow. So, you need to know who uses each tool, what gets shipped, and how much review and rework that work needs.
In this guide, you’ll get a five-step operating model, a monthly report template for your VP or CFO, and the data sources you need to run both.
Let’s get started!
Key takeaways
AI spend management gives engineering teams a repeatable way to track AI products, check usage, and decide what to fund.
| Control | Question It Answers | Data Needed | Owner | Cadence |
|---|---|---|---|---|
| Inventory | What are we paying for? | License fees, token charges, overages | Engineering operations | Monthly |
| Allocation | Who owns each cost? | SSO groups, seats, API keys | Engineering operations | Monthly |
| Utilization | Which seats get used? | Licensed versus active users | Team leads | Monthly |
| Quality-Adjusted Outcomes | Does spending improve delivery? | Costs, completed work, cycle time, change failure rate | Engineering managers | Monthly |
| Guardrails | When should we intervene? | Budgets, forecasts, caps, alert thresholds | Engineering and finance | Weekly; quarterly reset |
Axify’s cost forecast projects your AI spend up to a year ahead, with a low and high range around each value. Compare that projection with your team’s budget to spot an overrun early, then check which tools or teams drive the cost before you raise the budget or cut usage.
AI spend management for engineering teams is the process of tracking, allocating, and evaluating AI tool costs against delivery and quality metrics, such as completed work, cycle time, and change failure rate.
Your inventory covers paid seats, usage tiers and overages, token charges, and agent runs. Then, you assign those costs to the teams using the tools and check whether the work they deliver justifies the spending.
A few related terms need separating so you know what this process covers:
You used to rely on your seat count to predict your next month’s bill. But that’s harder as many AI tools are moving to usage-based plans.
Even GitHub Copilot introduced usage-based AI Credits on June 1, 2026. Once your included credits run out, further usage adds more charges if you enable an additional spending budget.
Agentic sessions make that consumption harder to predict.
A familiar bug fix can involve repeated file reads, test runs, and retries. Each call to a large language model consumes tokens, so working through several failed attempts can increase the charge for completing that same fix.
Renewals change your baseline as well.
In June 2026, TechCrunch reported that a Priceline employee’s Cursor renewal quote came back 4-5 times higher, and that Uber had used up its entire 2026 AI coding budget by April. The report doesn’t say whether seat counts or usage allowances changed between contracts, but it shows how far a renewal can move your baseline.
These patterns explain why AI coding costs rise even when headcount stays the same.
So before you approve more usage, check how fast each team is consuming its allowance and whether the extra AI calls end in merged, working code.
The engineering leader should own AI spending decisions within finance-approved limits. In most companies, cost management already sits with technology leadership: 78% of FinOps teams report to the CTO or CIO, according to the State of FinOps 2026 report. So, give your AI program a named owner, then make approval responsibilities explicit.
Use this RACI split as a starting point. R does the work, A owns final approval, C provides input, and I receives updates.
| Decision | Engineering Leader | Finance | Engineering Managers | Procurement |
|---|---|---|---|---|
| Approve budget | R | A | C | I |
| Approve tools | A | C | R | C |
| Review usage and delivery | A | C | R | I |
| Reclaim unused seats | A | I | R | C |
| Negotiate and renew contracts | A | C | C | R |
AI cost management starts with knowing what each team pays for. Then check whether that spending helps developers finish work.
Build your AI coding spend inventory from bills and usage exports. Keep these AI coding costs separate.
Assign each charge to a team. Team-level allocation lets you ask the right manager about unexpected usage.
These are the allocation decisions to settle.
Use showback to report team costs without internal billing. Use chargeback to debit team budgets after finance reconciles invoices.
Pro tip: Axify shows gross cost, meaning usage priced at each provider’s list prices, by tool, model, team, and contributor. Your invoice reflects your contract, so reconcile vendor bills before charging teams.
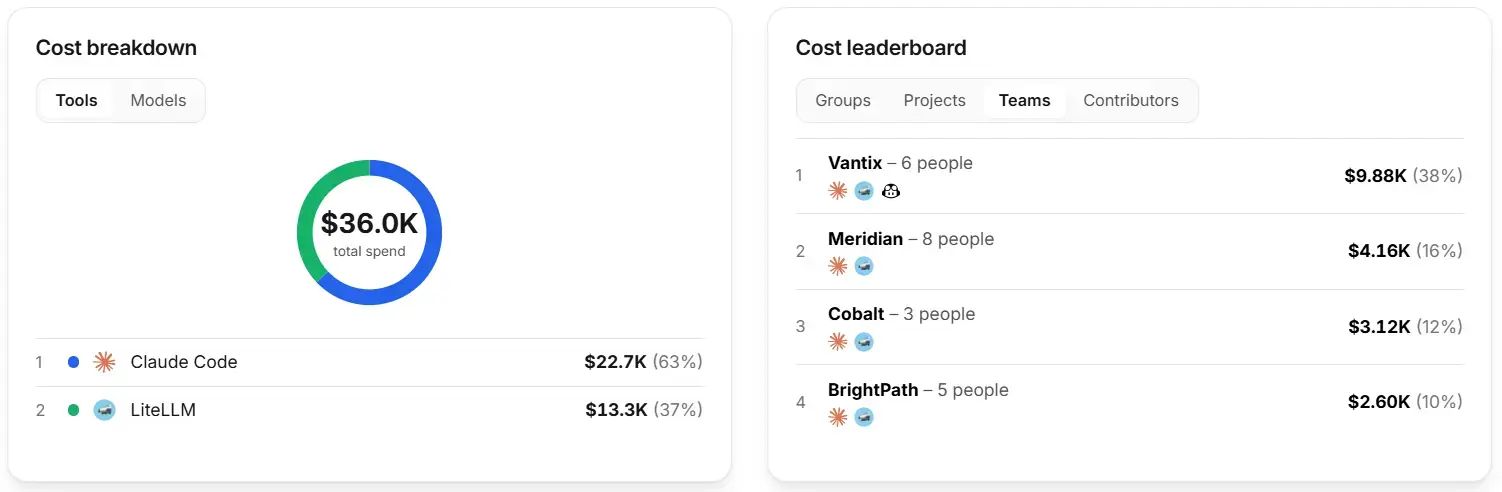
Match vendor identities to SSO groups and named API-key owners. Update cost allocation when developers change teams; assign service accounts to accountable teams.
Distribute shared gateway and cloud computing costs using measured consumption where possible. Document any headcount-based split and assign remaining overhead to the platform team. Keep production machine learning workloads in a separate cost pool.
Axify shows licensed users, active users, and the adoption rate between them. If you track utilization outside Axify, calculate it per tool as active licensed users ÷ paid seats × 100 over a defined period.
Here are four checks before changing access.
Review idle seats with their owners before cancelling access.
| Seat State | Signal | Action |
|---|---|---|
| Active | Recent usage | Check delivery impact |
| Idle | Previously used; now inactive | Check leave and workload |
| Never activated | No recorded usage | Check onboarding and telemetry |
DORA’s State of AI-assisted Software Development 2025 report defines AI adoption through three dimensions: reflexive use, reliance, and trust. Axify’s AI adoption score rates each contributor out of 100 against a reference cohort, using the same three pillars.
Axify also tracks AI acceptance rate: how often developers accept AI-generated suggestions. It separates passive exposure from real adoption, so read it next to completed work and review time.
Remember: A paid seat doesn’t establish regular use. DORA’s 2025 report found 39% of AI users only “sometimes” turned to AI for tasks, so check active days before renewing.
Try this review schedule for paid access, including Claude Code Enterprise. After 30 inactive days, investigate. After 60, agree on support or reassignment. And after 90, reclaim unless an exception is documented.
Check the share of tokens your heaviest users consume, then inspect their tasks and correction effort before restricting access.
Connect AI coding spend to completed work. Keep spend and delivery counts within the same team and reporting period. Prorate annual seats into that period.
Here are four ways to test whether the spending pays off.
AI tools can raise output: across three randomized trials with 4,867 developers, researchers found 26.08% more completed tasks with AI assistance. Before you divide costs by output, check whether your team sees a similar lift.
In Axify’s Explore view, you can put AI cost next to PR throughput by team.
Then calculate two ratios for the same team and reporting period:
Per merged PR = S ÷ P
Per completed item = S ÷ W
Cheap output isn’t cheap if someone has to fix it.
In Stack Overflow’s 2025 survey, 45% of developers who answered its question on AI frustrations said debugging AI-generated code takes more time.
So add the cost of that fixing to the formula.
C is the labor cost of review and fixes: hours spent actively reviewing, reworking, and fixing production issues, multiplied by each person’s loaded hourly rate (salary plus benefits and overhead, per hour).
Count each hour once, and use hands-on time only. Review time in your delivery data includes waiting, so it overstates the hours.
Adjusted cost per completed item = (S + C) ÷ W
For an illustrative month, assume $4,000 in AI spend and $2,000 in review and correction labor.
| Output | Count | Cost Each |
|---|---|---|
| Merged PRs | 200 | $20 |
| Completed items | 80 | $50 |
| Completed items, quality-adjusted | 80 | $75 |
Two rates show whether that fixing is growing:
If either rate rises while cost per item falls, the savings are going into fixes. Track both when you measure AI ROI.
Pick two equal periods, one before and one after a team adopted AI, with similar work in both. Then compare PR cycle time stage by stage: coding, pickup (waiting for first review), and review. If coding gets shorter but pickup gets longer, AI has moved the bottleneck to review.
Axify puts AI adoption next to delivery data for the same teams: cycle time, review time, change failure rate, failed deployments, and the share of bugs among completed issues. That lets you check whether a shift in adoption lines up with a shift in delivery.

Cheap seats can sit unused, while cheap tokens can fund repeated failures. So, we encourage you to avoid tokenmaxxing, which treats token consumption as productivity evidence.
Plan quarterly AI coding spend from recent usage. Leave room in the budget for teams you plan to onboard.
Build the quarterly budget for each AI coding tool in four steps, then add the tool budgets together:
For example, a $60 baseline × 25 developers × 3 months gives $4,500. Add 40 planned agent runs at $30 each ($1,200) and a 20% buffer ($1,140), and the quarter’s budget is $6,840.
Burn rate is how much a team has spent per day so far this month. Multiply it by the number of days in the month to project month-end spend, so you know early whether the team will stay within its allowance.
Two signals are worth a review:
Set both as alerts in the tools that bill you, so team leads hear about them without checking a dashboard. GitHub Copilot, for example, emails admins as users approach their budgets, and an LLM gateway can enforce a budget per team key.
Burn rate only covers the current month. For the quarter ahead, check the team’s line in Axify’s forecast: if the high end of the range crosses the allowance, review that team’s usage before you approve more seats or agent runs.
Have engineering leaders approve premium models and long-running agents, with a task owner, spending ceiling, and stopping condition.
Before approving a premium model, check whether a cheaper one does the job: Databricks reported that routing each request to the cheapest capable model cut average coding-task cost by more than 30%, with quality close to its most expensive model.
Our guide to Claude Code token usage shows how to set both in Claude Code.
Your VP or CFO needs one monthly record of spending, usage, and completed work. These six blocks give them the evidence to approve, renew, or cut AI tool spending.
Show actual spend next to the budget, with the forecast for the next 30 days on a separate line. Label where each number comes from: your invoice, or Axify’s gross cost at provider list prices, which can differ from what you’re billed.
Your license utilization block compares licensed versus active users by tool and team. Each inactive seat needs someone responsible for reviewing access.
Show both ratios from Step 4 for the previous and current month: cost per merged PR and cost per completed item. Keep the same teams and period definitions every month, so the trend is comparable. If you add review and rework costs, show that calculation on its own line.
Axify’s delivery data helps you see whether shorter cycle time coincides with more deployment failures. Staffing changes and differences in task complexity belong in your commentary.
Each request needs spending, utilization, and completed-work evidence. Renewal requests should include cancellation deadlines and switching costs so you can judge vendor lock-in.
For AI-enabled capabilities such as automated code review, expansion requests should include pilot results.
Weekly checks catch usage spikes. Your monthly review approves changes, while the quarterly reset updates allowances. Axify’s scheduled reports include an AI-written summary to support that review.
Your generative artificial intelligence tools leave usage and billing records in different places. These sources connect each charge with a team and the work it supports.
Vendor APIs supply licensed users, activity, token counts, and allowances where available. Billing exports provide invoice charges and adjustments. Your inventory should keep usage telemetry, provider-rate cost estimates, and billed amounts in separate fields.
An LLM gateway routes requests between tools and model providers. Team-specific keys let it attribute usage and enforce configured budgets. If you route model calls through an internal LiteLLM proxy, Axify picks up that usage too. That includes calls from tools Axify doesn’t connect to directly, such as Codex, when they go through the proxy.
SSO groups connect developer identities to teams for allocation. Your mapping should join vendor user IDs, API-key owners, and team membership, with dated changes so transfers don’t rewrite past costs.
Git supplies merged PRs and review timestamps. Jira supplies completed items and bug records. And CI/CD deployment records, linked to incidents or rollbacks, support change failure calculations. Matching team IDs and reporting periods lets you compare spending with delivery.
One small squad with a few subscriptions can start with monthly spreadsheet exports. Multiple teams sharing API access benefit from a gateway. Larger organizations can use a platform to automate usage, identity, and delivery reporting, alongside separate invoice reconciliation.
Cost controls can interrupt useful work or hide wasted spending. From what we've seen, here are seven mistakes to avoid:
Axify brings cost, adoption, and delivery data together to support the five steps above. Here’s how Axify supports each step:
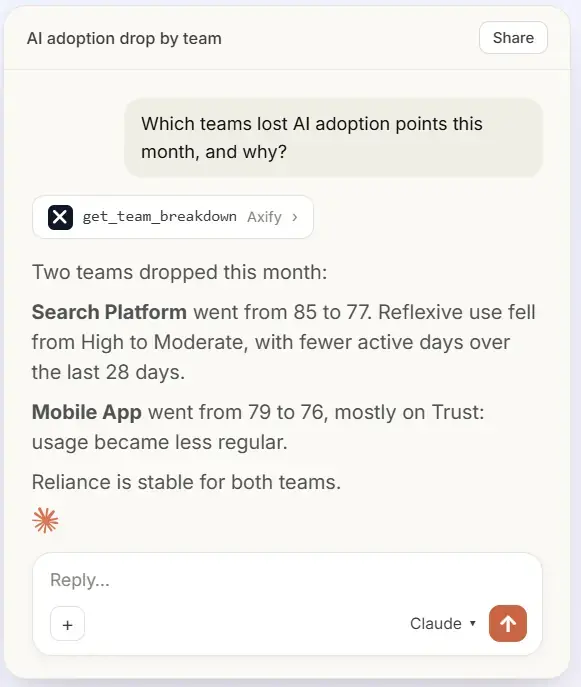
To find out why a pattern changed, ask Axify Intelligence, for example: “Why did the Payments team’s AI spend go up this month?”
It answers from your own cost and delivery data, recommends where to act, and lets you implement the change directly from the platform.
You can ask the same questions from Claude, ChatGPT, or Cursor through the read-only MCP server. Scheduled reports also include an AI-written summary for your monthly review.
AI spend stays manageable when every dollar has an owner, a usage check, and a delivery result next to it. Start with the inventory, then let the monthly report carry the decisions.
Want to see what your AI coding tools cost and what they deliver? Start your 14-day free trial of Axify.

Your allowance should cover paid seats, expected metered usage, and agentic work such as automated testing or longer coding sessions. A baseline drawn from recent bills gives you somewhere to start, with a buffer for heavier usage and planned pilots.
Published benchmarks rarely match your mix of tools and team size, so start from your own number: divide planned AI tool spending by your total engineering budget for the same period and multiply by 100. Include salaries, infrastructure, and other engineering costs in the total, then track how the share changes each quarter.
Your evidence starts with AI spending per merged pull request or completed work item. Compare the same team across matching periods before and after adoption, with similar tasks. Include review and rework costs, then check cycle time and change failure rate.
Start with showback when teams need visibility into their spending and can act on it. Your cost allocation needs reliable ownership records before chargeback makes sense. Internal charging fits teams that control their own budgets and can approve or reduce usage.
Engineering leaders should own the spending plan and tool approvals, while finance gives final budget approval and reconciles invoices. Engineering managers handle usage reviews and seat decisions. Procurement manages contracts and renewals, with engineering leaders accountable for whether tools remain needed.
Usage-based pricing makes spending depend on consumption, so adding agent runs or choosing more expensive models can raise costs without adding seats. Your forecasts need recent usage data, separate allowances for variable work, and weekly checks alongside monthly budget reviews.
AI spend management for engineering teams covers tracking, allocation, utilization, delivery results, budgeting, and reporting. AI cost optimization focuses on improving cost efficiency. For example, switching routine tasks to a cheaper model can reduce spending while preserving the quality of completed work.