AI
13 minutes reading time

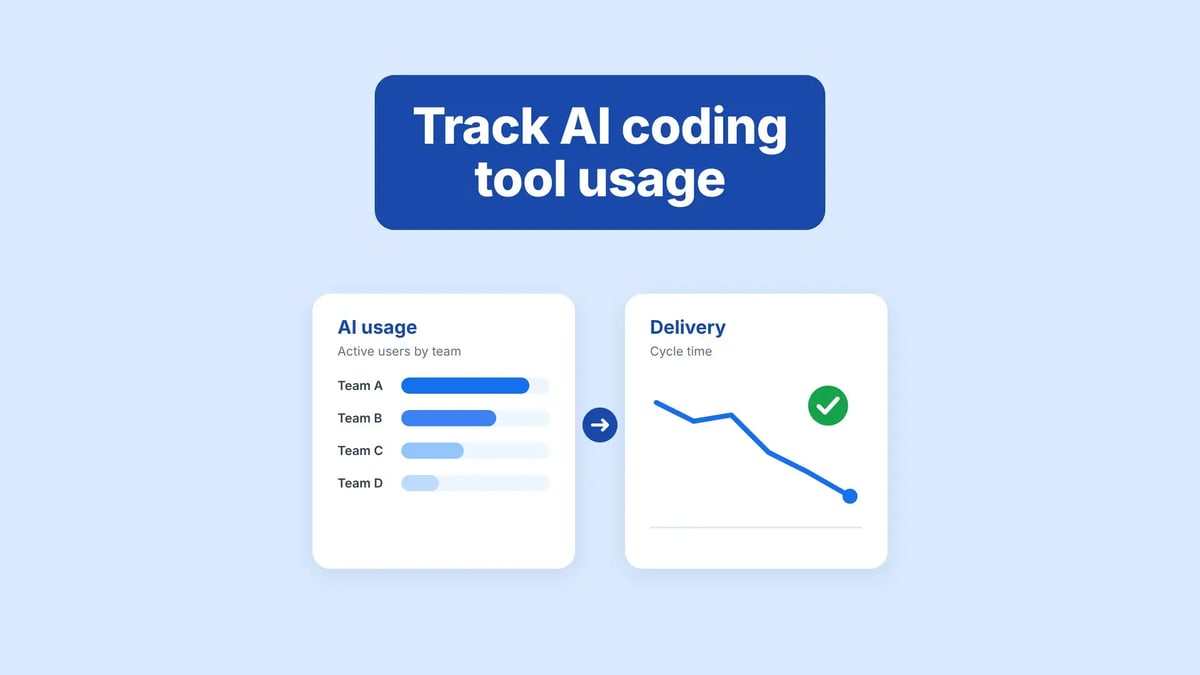
To track AI coding tool usage across dev team workflows, you can use:
Your choice depends on what you need to check. Maybe you want to find idle seats or see how often developers use Claude Code. Or you need to check whether AI-assisted work reduces review time.
AI coding tools analytics can answer those questions, but each platform collects different data. In this practical guide, we'll explain what each tool tracks, how it collects that information, and where its reporting stops.
Key takeaways
Start with your vendor’s dashboard to check active users and usage across features. Choose LinearB to compare pull requests with detected AI involvement, Swarmia to track licenses and unused seats, or Faros AI to investigate token spending.
For AI adoption and cost across teams, Axify reads usage from Copilot, Cursor, Claude Code and LiteLLM, so you can check whether teams that use AI more ship faster, measured by cycle time and four DORA metrics.
We compared each vendor’s published documentation on usage, cost and delivery tracking against the criteria below. The core test: a tracking tool should show what developers actually use, beyond the seats you pay for.
Here are the criteria we used:
Disclosure: Axify publishes this list and appears in it. We applied the same criteria to every platform and included documented limitations alongside its capabilities.
We compared documented features and pricing so you can narrow your shortlist. Coverage depends on the integration and plan.
| Tool | Type | Best For | AI Tools Covered | Delivery Metrics | Pricing Model |
|---|---|---|---|---|---|
| Axify | Engineering intelligence | Comparing AI adoption, cost and DORA metrics across several AI tools | GitHub Copilot, Cursor, Claude Code, LiteLLM. Codex and OpenAI models covered through an internal LiteLLM proxy. | Four DORA metrics, flow metrics, AI adoption and impact metrics | Pro $29/active contributor/month, billed annually; Enterprise custom. |
| Jellyfish | Engineering intelligence | Engineering investment and executive reporting | Copilot, Cursor, Claude Code, Windsurf, Gemini Code Assist, others | Throughput, cycle time, PR-level output | Custom quote. |
| LinearB | Workflow analytics | PR workflow signals and AI involvement | Copilot, Cursor, Claude Code; other tools through Git signals | PR throughput, cycle time, review time | From $29/user/month, billed annually; Essentials supports GitHub Cloud only. |
| DX | Engineering intelligence and surveys | Survey feedback on AI tools, plus recorded usage | Copilot, Cursor, Claude Code, Codex, Gemini CLI, others; coverage varies by collection method | PR throughput, lifecycle comparisons | Contact sales. |
| Swarmia | Engineering intelligence | Finding unused AI seats and tracking team PR metrics | Copilot, Cursor, Claude Code, Codex | DORA, cycle time, review time, batch size; plan-dependent | $5/developer/month for adoption and cost, $23 with delivery metrics, billed annually. Free for companies with up to nine developers. |
| Faros AI | Engineering intelligence | Token spending attributed to engineering work | Claude Code, Codex, Cursor, GitHub Copilot | Delivery context from engineering integrations | Not published; contact sales. |
| Span | Engineering intelligence | Measuring how much merged code AI wrote, and tracing agent sessions to PRs | Claude Code, Cursor, Codex CLI, others | Merged PRs linked to agent sessions | Not published; contact sales. |
| Pensero | Engineering intelligence | Small teams wanting free access and benchmarks | Copilot, Cursor, Claude Code, Codex, Devin, others | Delivered output, defects, rework | Free up to five users/one repository; Growth $50/seat/month, billed annually; custom Enterprise. |
| Native Vendor Dashboards | Native analytics | Teams using one vendor’s coding tools | Separate Copilot, Cursor, Claude Code and Codex dashboards | Varies; some include PR and code-contribution metrics | Included with eligible vendor plans; access varies. |
Prices and features verified on each vendor’s website in November 2026.
Our team reviewed each tool’s documentation to check what it measures and how it collects data. Your choice depends on whether you need coding tool adoption reports, spending details or delivery metrics.
Here are the options and where each one fits.
Best for Multi-Tool Organizations Needing Usage, Adoption, and DORA in One View
Axify reads usage from your AI coding tools and delivery data from Jira, GitHub, GitLab, Azure DevOps and Bitbucket. Per team, you see how many developers use AI, what it costs, and whether your delivery flow, throughput, and stability changed. All integrations are read-only.
Key Features:
AI Coding Tools Covered: Integrations cover GitHub Copilot, Cursor, Claude Code (API or subscription telemetry via OpenTelemetry), and LiteLLM.
Delivery Metrics Connected: Four DORA metrics, PR and issue cycle time breakdowns, and other flow metrics. Explore puts AI usage, tokens or cost next to PR and issue throughput, by team or contributor, so you can see whether wider AI use comes with faster, steadier delivery.
Pricing: Axify pricing is $29 per active contributor monthly for Pro, billed annually. Enterprise pricing is custom.
Limitations: Codex/OpenAI coverage requires an internal LiteLLM proxy.
Best for Tying AI Adoption to Engineering Investment and Executive Reporting
Source: Jellyfish
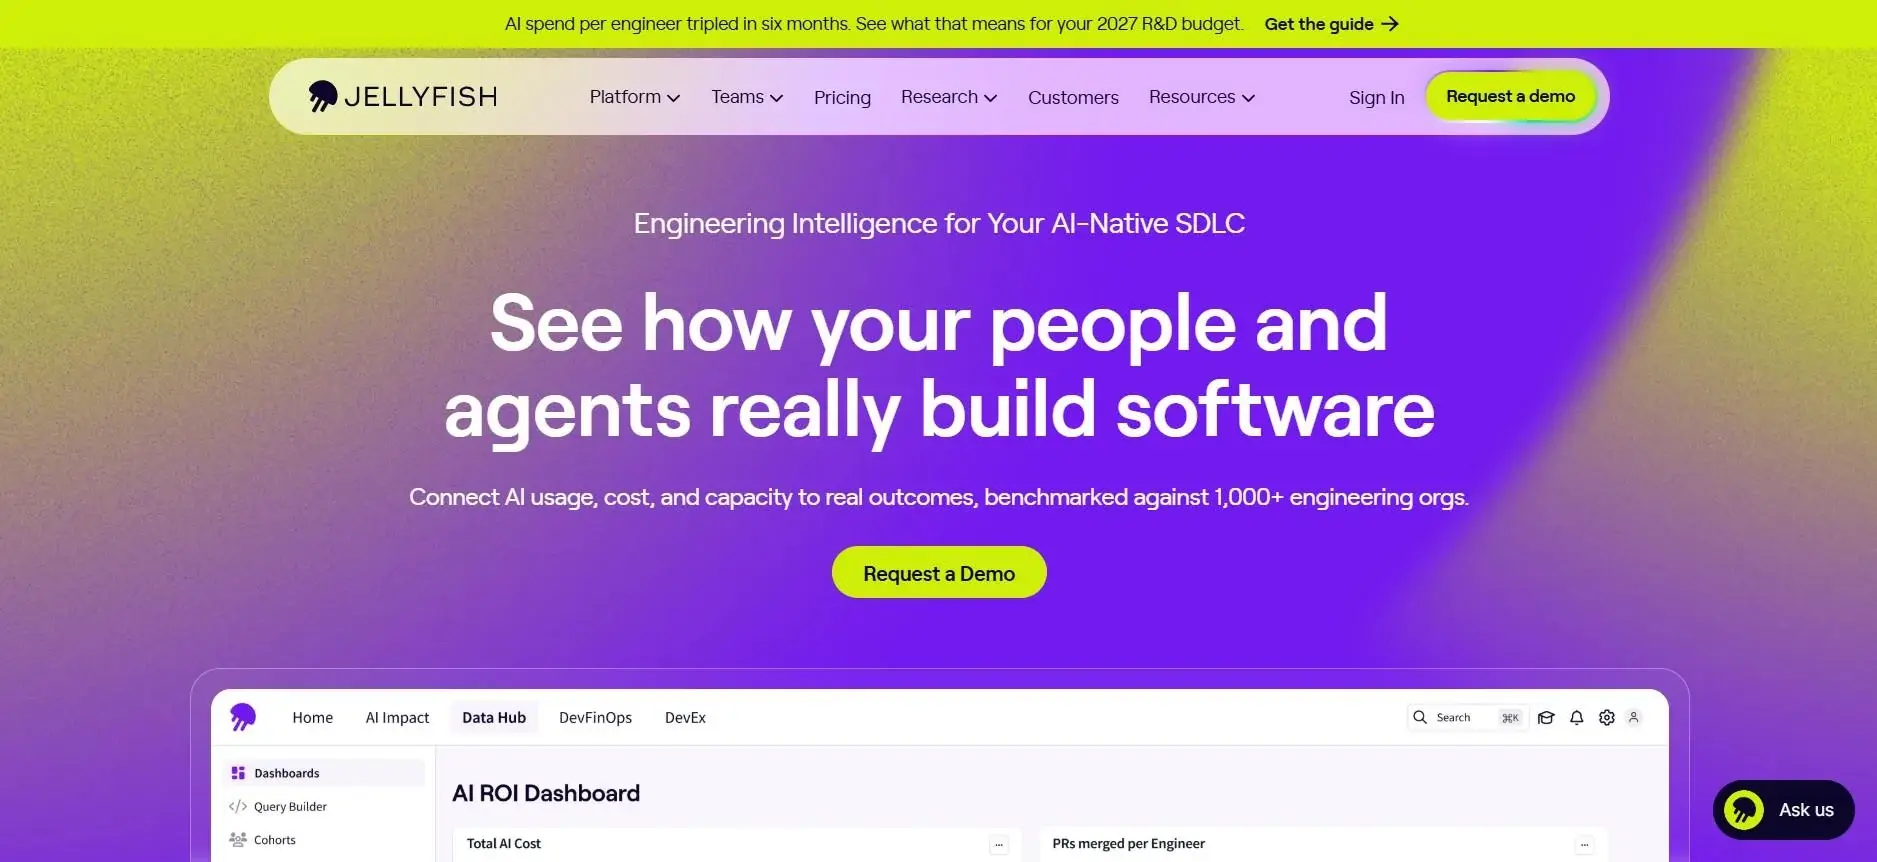
Jellyfish pulls usage and spend from AI providers and matches it with commits, pull requests and tickets from Git and your planning tool. Its AI Impact product tracks coding assistants, review tools and autonomous agents, and engineering investment allocation is part of the main platform.
Key Features:
AI Coding Tools Covered: Supported tools include GitHub Copilot, Cursor, Claude Code, Windsurf, Gemini Code Assist, CodeRabbit and Devin.
Delivery Metrics Connected: Throughput and cycle time, with spending compared against output down to individual PRs.
Pricing: Custom quote.
Limitations: Available usage fields depend on the provider integration, so reporting coverage differs between tools.
Best for PR Workflow Signals on AI-Assisted Work
Source: LinearB
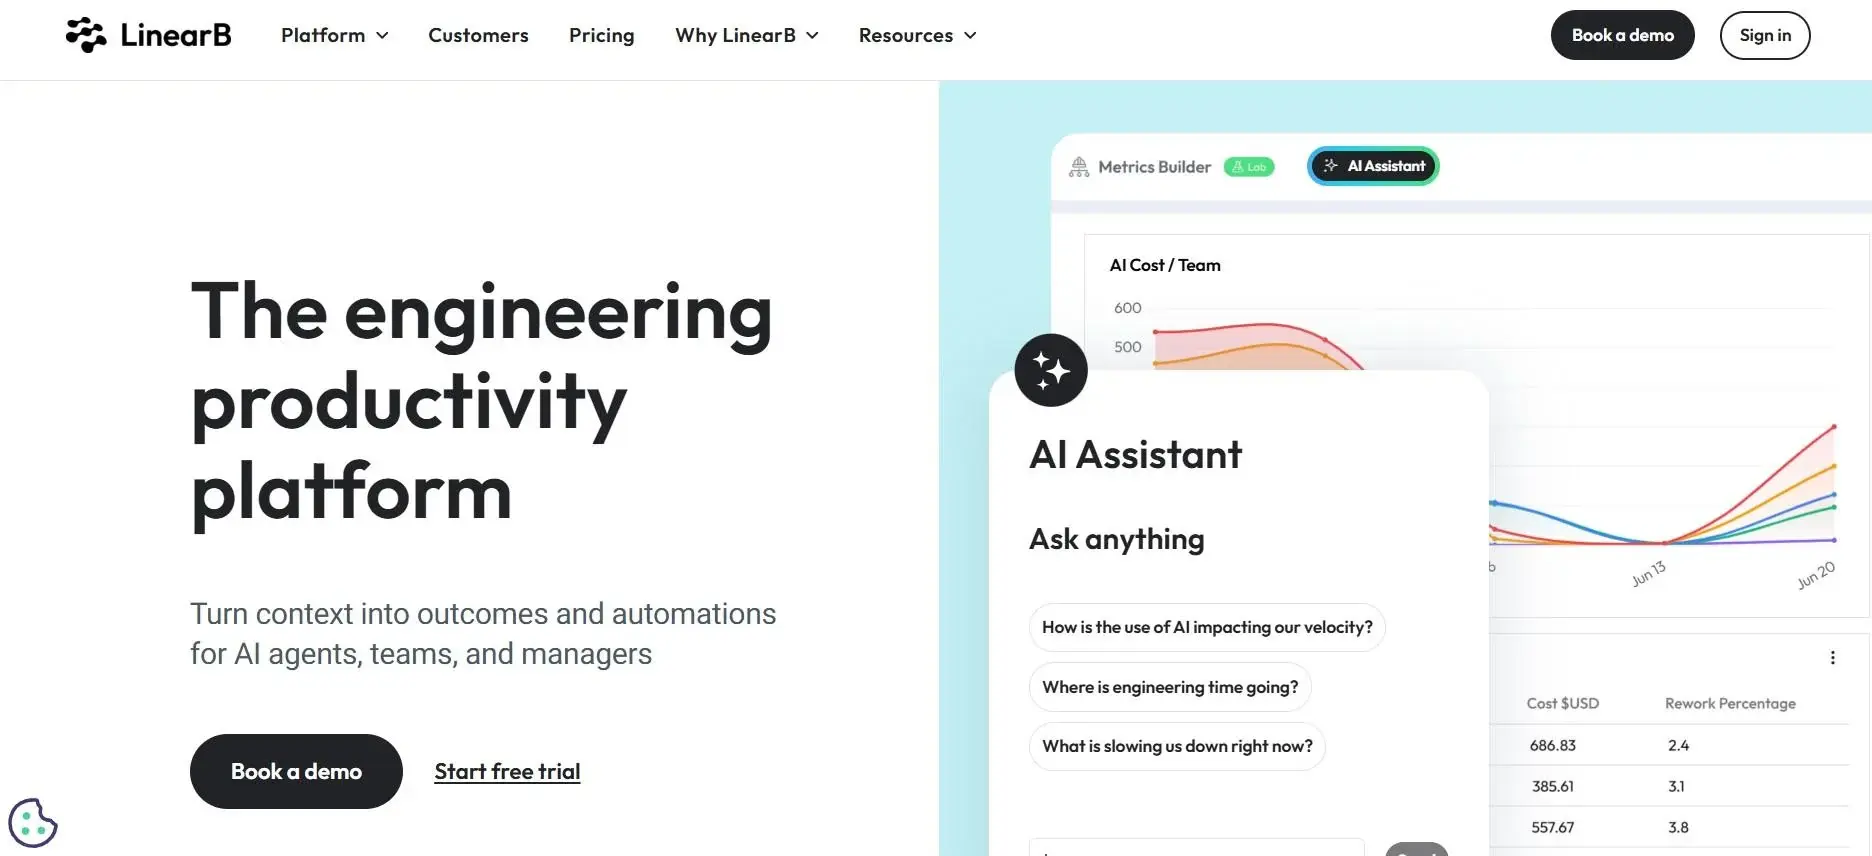
LinearB’s AI Analytics reads provider telemetry and Git data, such as commit co-authors, agent-created branches and review comments. It labels pull requests in connected repositories as coding assistance, coding agents or AI code review.
Key Features:
AI Coding Tools Covered: Copilot, Cursor and Claude Code report activity directly, while other tools are detected through recognizable Git activity, such as AI co-authors in commits.
Delivery Metrics Connected: PR throughput, cycle time and review time, for pull requests with and without detected AI involvement.
Pricing: LinearB pricing starts at $29 per user per month for Essentials, billed annually (verified November 2026).
Limitations: AI Analytics is in beta, Essentials supports GitHub Cloud only and is built for teams of 50 or more developers, and a flagged PR may contain human-written code.
Best for Survey-Based Adoption and Developer Experience
Source: DX
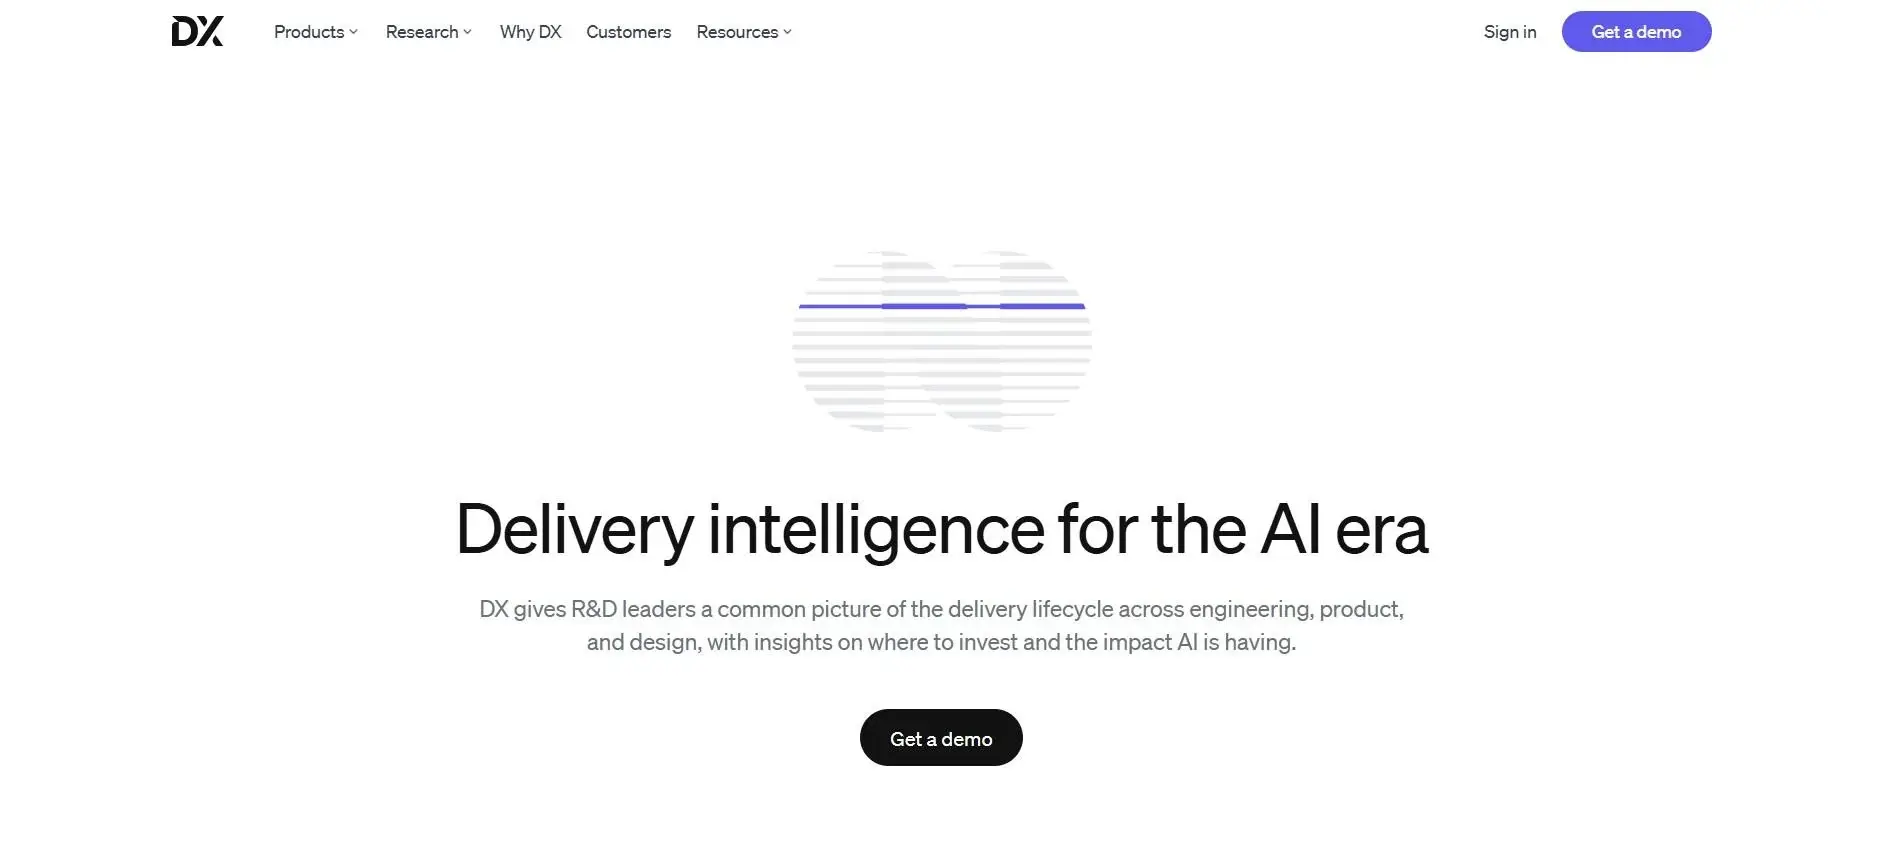
DX runs developer surveys and collects AI usage data, then reports both through its AI Measurement Framework, which measures the utilization, impact and ROI of AI-assisted engineering. Provider connectors pull organization-level data through APIs, while AI Code Insights uses a local daemon to attribute code to the agent that wrote it, at commit time.
Key Features:
AI Coding Tools Covered: Code attribution supports Codex, Claude Code, Cursor, GitHub Copilot, Gemini CLI and other agents; connector coverage varies by tool.
Delivery Metrics Connected: PR throughput and lifecycle time for each usage group, through source-control integrations.
Pricing: Custom quote.
Limitations: Code attribution depends on the daemon running on each developer’s machine, so coverage follows how widely it is deployed. Cloud-hosted and background agents aren’t captured.
Best for License Utilization Alongside Team Workflow Metrics
Source: Swarmia
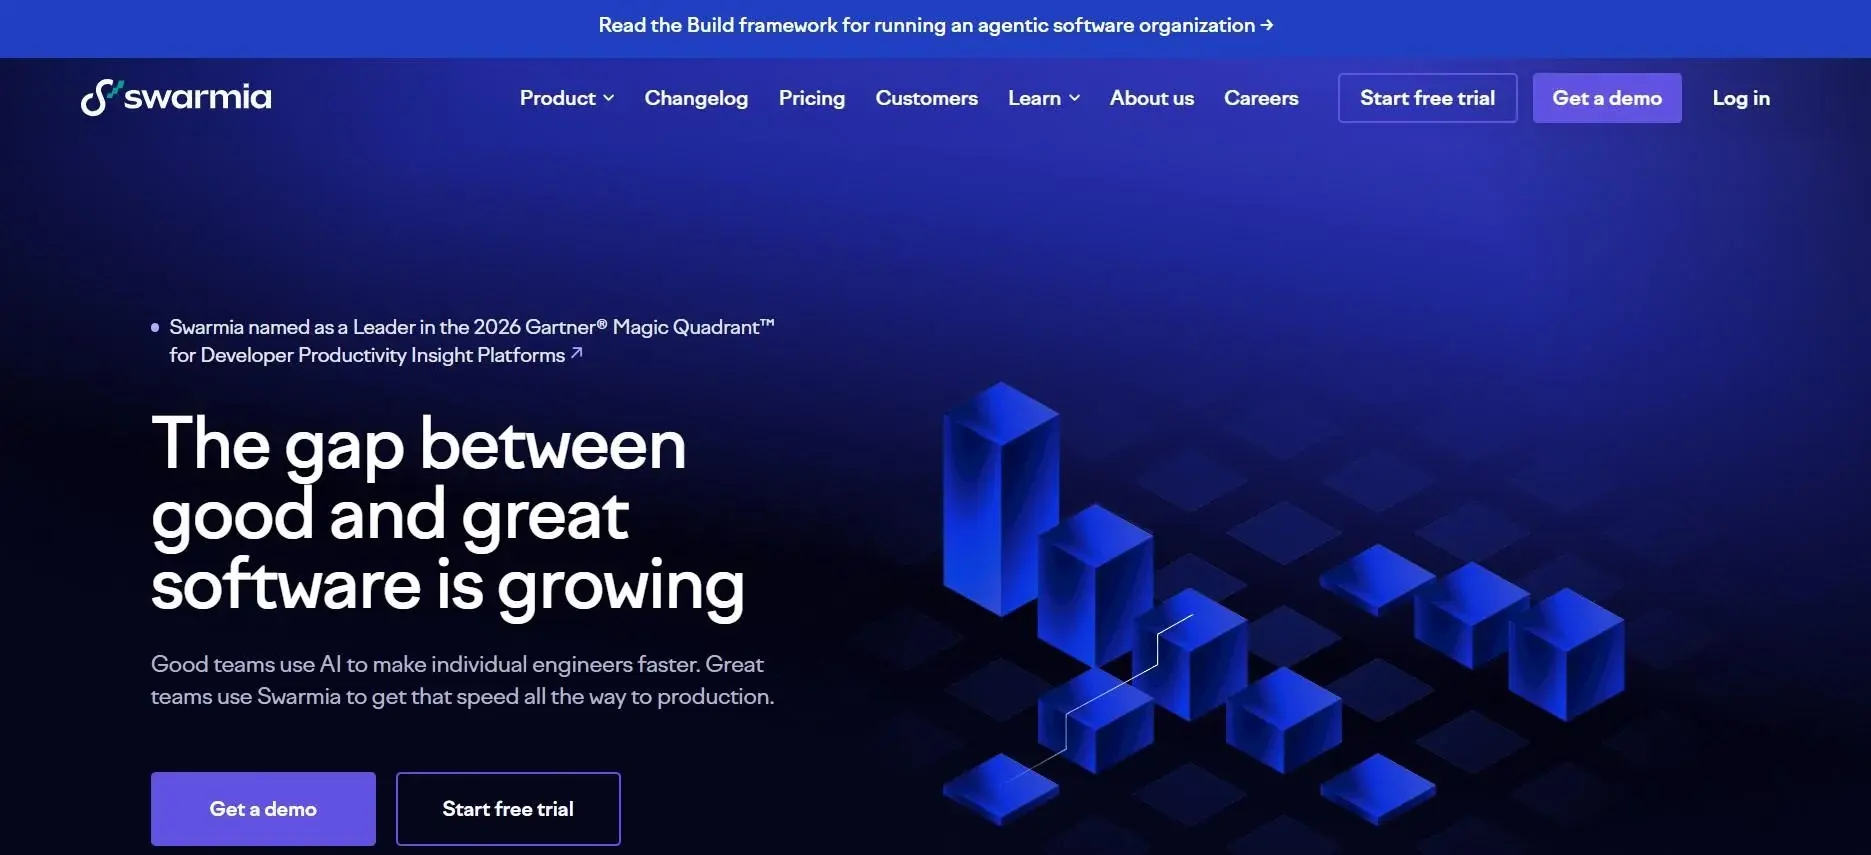
Swarmia is an engineering intelligence platform that breaks AI usage and cost down by person and tool. It reports each team’s AI tool activity in the same views as pull request and issue data from source control and project tools.
Key Features:
AI Coding Tools Covered: Integrations include GitHub Copilot, Cursor, Claude Code, and Codex.
Delivery Metrics Connected: Cycle time, review time, batch size and DORA metrics, in the Productivity & AI Impact plan.
Pricing: AI Adoption & Cost is $5 per developer per month and Productivity & AI Impact is $23, billed annually (verified November 2026). Swarmia is free for companies with up to nine developers.
Limitations: The $5 paid plan excludes the delivery reporting described above.
Best for Large Organizations Focused on Token Spend Attribution
Source: Faros AI
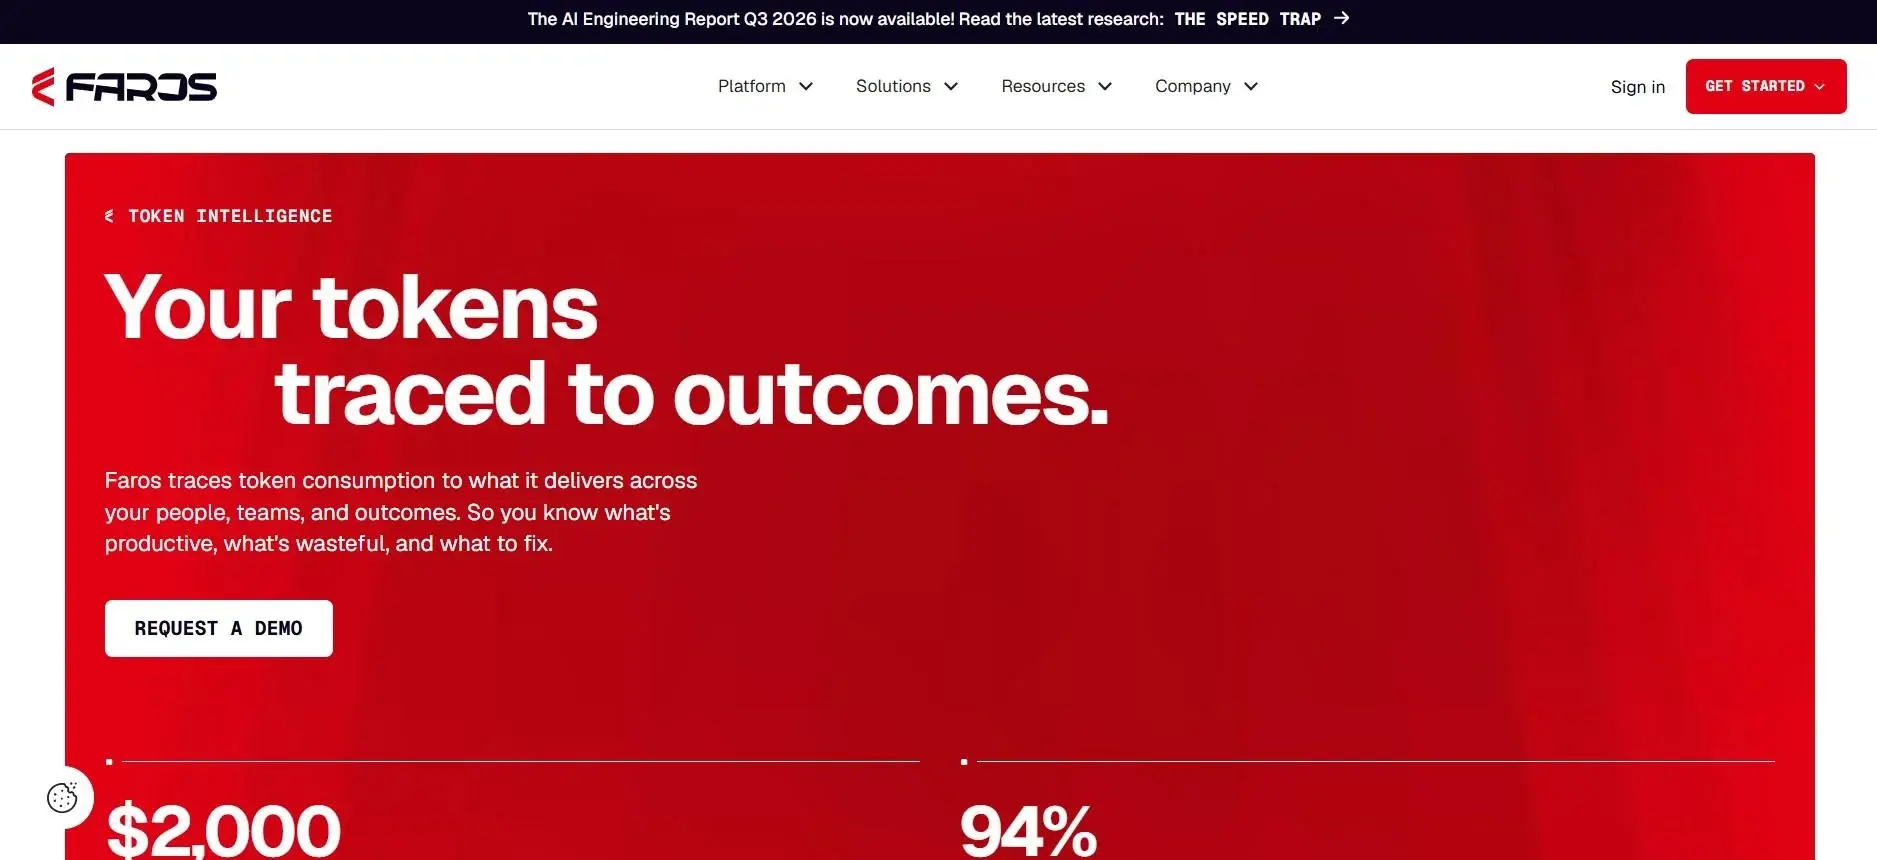
Faros AI’s Token Intelligence reads token usage from your AI coding tools’ built-in telemetry, so nothing is installed on developer machines. It reports spend in dollars by team, tool and model for AI cost optimization, because Claude Code token usage costs depend on token types and model rates, and token totals alone do not describe spending.
Key Features:
AI Coding Tools Covered: Supported tools include Claude Code, OpenAI Codex, Cursor and GitHub Copilot.
Delivery Metrics Connected: Delivery context from Faros’s engineering integrations, such as Git and issue trackers.
Pricing: Not published; Faros offers a self-service environment that is free to explore.
Limitations: Efficiency classifications are Faros’s assessments, and the available attribution detail depends on the connected data source.
Best for Measuring AI Code Share and Tracing Agent Sessions to PRs
Source: Span
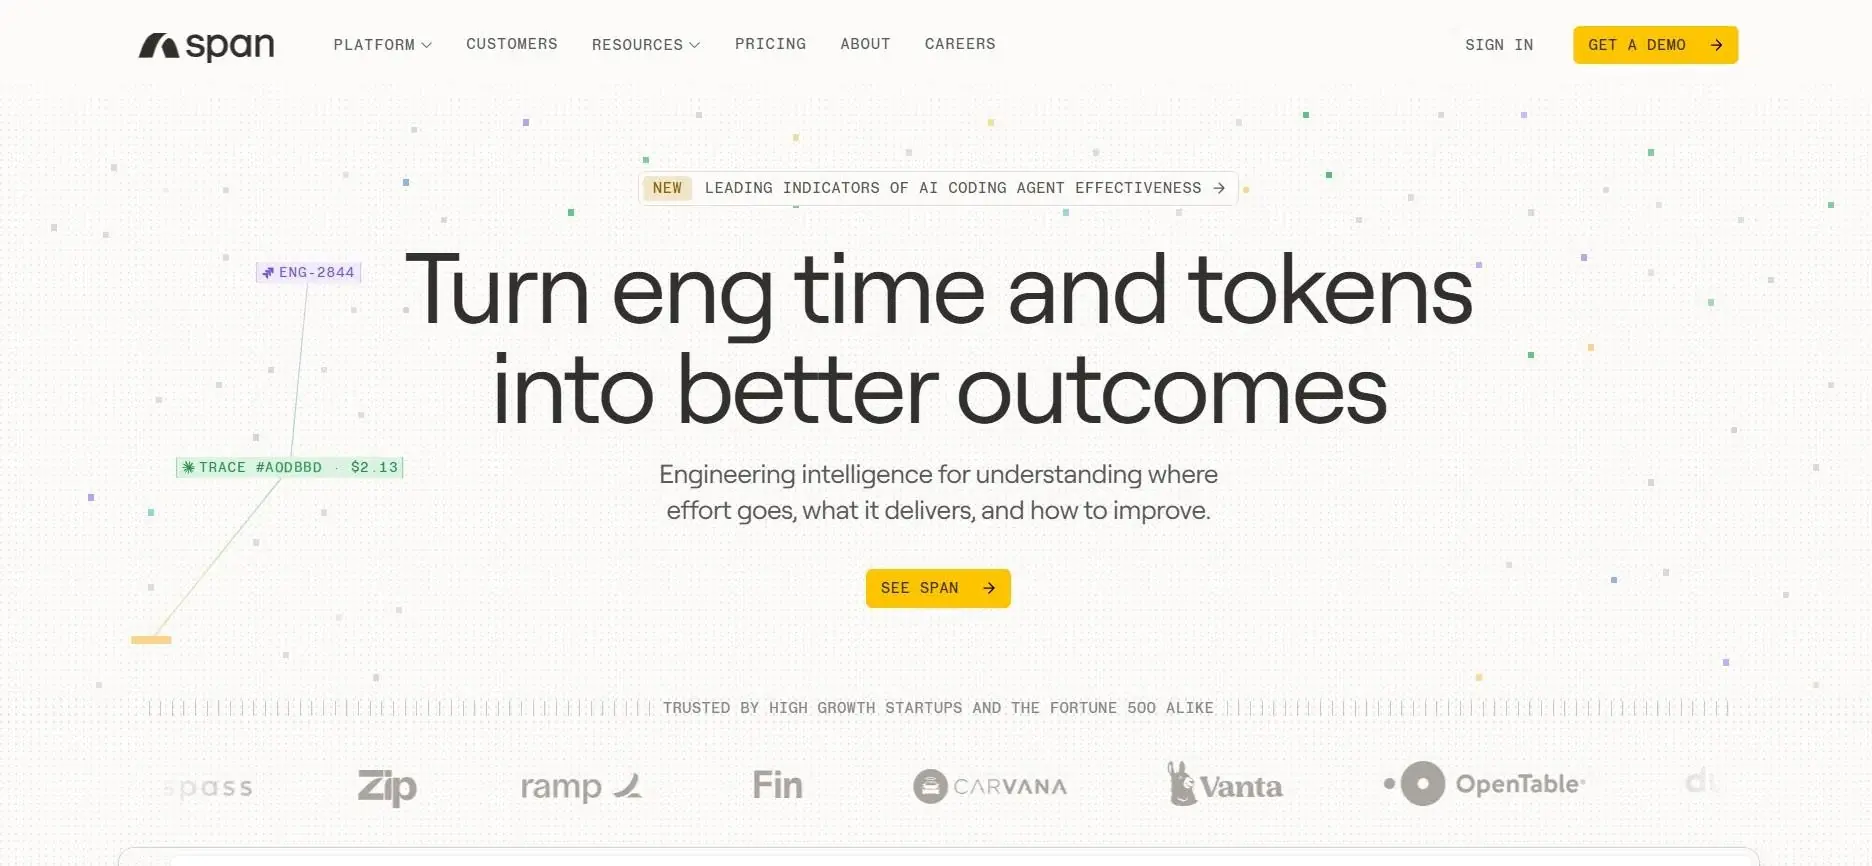
Span collects data from AI tool telemetry, such as Codex CLI through OpenTelemetry, and from a recorder installed on developer machines through MDM. Its AI code detector estimates how much of a code sample AI wrote, independent of any one vendor’s telemetry.
Key Features:
AI Coding Tools Covered: Documented sources include Claude Code, Cursor and Codex CLI, with coverage varying by collection method.
Delivery Metrics Connected: Merged pull requests linked to the agent sessions that produced them.
Pricing: Not published; contact sales.
Limitations: The machine recorder is available on macOS today, with Windows and Linux listed as coming soon.
Best for Small Teams Wanting a Free Tier and AI Adoption Benchmarks
Source: Pensero
Pensero pulls data from AI coding tools, repositories and project trackers. It labels each piece of work as human, AI-assisted or agent work, then scores completed work by size and difficulty using its delivery-point measure.
Key Features:
AI Coding Tools Covered: Supported tools include GitHub Copilot, Cursor, Claude Code, Devin, Gemini Code Assist, OpenAI Codex and LiteLLM.
Delivery Metrics Connected: Completed output, defects and rework, through repository and project integrations.
Pricing: Starter is free for up to five users and one repository. Growth is $50 per seat per month, billed annually (verified November 2026).
Limitations: Starter is limited to one repository and one year of history, and available telemetry varies by integration.
Best for Single-Tool Teams
Each dashboard covers its vendor’s ecosystem, and several now include PR metrics. For delivery metrics beyond PRs, export usage data and match it with deployment and incident records for the same teams.
Here are the four native options:
Compare usage and delivery metrics for the same team and the same reporting period. Keep your AI performance metrics defined the same way over time, so a change in how you measure doesn’t look like a delivery improvement.
These four comparisons cover cycle time, rework and two DORA metrics:
We recommend keeping task complexity and staffing changes in view, because these comparisons alone cannot prove AI caused the difference.
Also, compare token consumption with merged pull requests, successful deployments and rework for the same period. Avoid tokenmaxxing by checking what the extra consumption helped your team finish.
If your team uses one AI coding tool, start with its native dashboard for adoption and usage reporting.
Once you need to compare several AI tools and assess AI coding ROI across teams, consider Axify, which shows AI adoption and cost for each team together with that team’s cycle time and DORA metrics.
For regular VP updates, prioritize scheduled reports with an AI-written summary to reduce preparation time. Look for alerts on metric changes, so you hear about a drop in adoption or a rise in cycle time between reports. Our guide to AI spend management includes a monthly report template you can fill with these figures.
For developer experience, consider DX when you need survey feedback in addition to recorded usage. If rising token bills are your main concern, Faros AI breaks spending down by team, model and type of work.
And with a tight budget, Pensero’s free tier covers up to five users and one repository. Swarmia is also free for companies with up to nine developers.
But before expanding a Claude Code Enterprise pilot, we recommend agreeing on who manages access policies and who needs usage reports. Then confirm your tracking tool can provide those reports.
To track AI coding tool usage across dev team workflows, measure adoption, cost and delivery for the same teams. Then you can check whether wider AI use comes with faster reviews, more frequent deployments and fewer failed changes.
Axify shows those metrics for each team, so you can see which teams deliver faster with AI and what to change in your next AI rollout.
To see how this could work for your engineering organization, book a demo with Axify today.

No, Copilot’s reporting doesn’t show standalone Cursor or Claude Code usage. It covers activity within GitHub’s Copilot ecosystem. For a combined view, bring the separate reports together or use a platform that integrates with all three.
Axify’s AI adoption & impact view puts AI adoption next to cycle time, throughput and DORA metrics for the same teams, and Explore compares AI cost or usage with delivery metrics. Swarmia includes both DORA and AI metrics in its Productivity & AI Impact plan.
Compare licensed users with active users over the same reporting period to see who uses their seats. For accurate license utilization, match identities across billing and usage records, then check last activity and missing telemetry before reclaiming apparently idle licenses.
Yes, some tools provide individual visibility, and Axify includes a contributor-level view. Interpret that data at team level because developers handle different tasks and workloads. Use individual activity to investigate access or onboarding gaps, with input from the developer.
Initial data may appear within a day, depending on the integration. For example, Claude Code’s GitHub contribution data typically appears within 24 hours after enabling. For impact analysis, you can compare multiple delivery cycles with the same team’s pre-adoption baseline.