Delivery Performance
15 minutes reading time

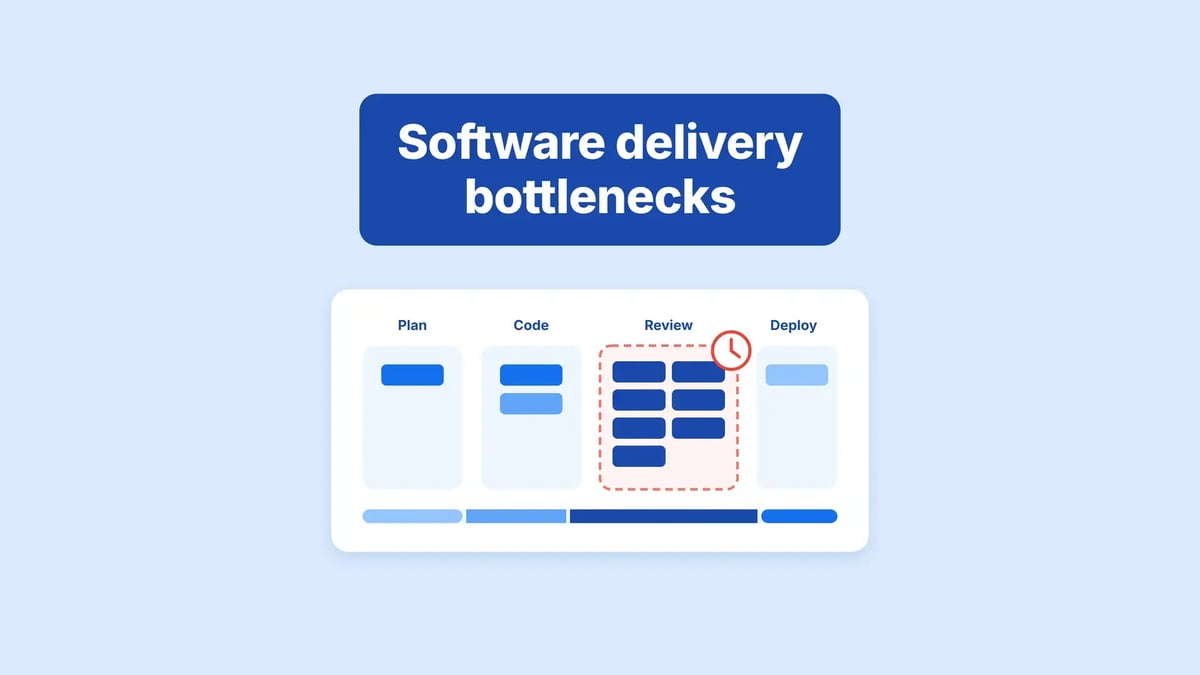
To find and eliminate software delivery bottlenecks, break cycle time into stages, identify where work waits longest, and fix that constraint first.
Your team might finish coding quickly, but those changes still need review, testing, and release approval. And if unclear requirements keep sending work back for changes, faster code merges won't prevent expensive rework.
So the question to answer is which stage holds your tickets and pull requests the longest on their way to production, and what would shorten that wait.
In this guide, you'll learn which signals point to each bottleneck. Then you'll see how to choose a fix and check whether it leads to faster releases.
Let's get started!
Key takeaways
Software delivery bottlenecks are stages in your delivery process, such as code review, testing, or release approval, where tickets and pull requests arrive faster than the team can finish them. They wait in a queue, so releases slow down.
Warning: The stage with the lowest capacity sets your throughput, which is the amount of work your team can finish in a given period. This constraint limits your delivery even when everyone else has time to spare.
For example, your developers might finish 10 changes a week while reviewers can approve only five. Faster coding then creates a bigger review queue. Even quicker continuous integration checks won't increase releases while review remains the limiting stage.
In our experience, software development bottlenecks also appear in other stages, such as testing, release approvals, or handoffs between teams. Local slowness may delay one task, while a systemic bottleneck repeatedly holds up delivery across the team.
That's why finding SDLC bottlenecks starts with checking where queues keep growing. Fix that stage first, and finished code will reach production sooner.
Software development bottlenecks show up in issue status histories and pull request timestamps. Those records show how long each ticket and PR waited at every stage and handoff. To find them, follow the five steps below.
Start with ticket status histories, linked pull requests, and production deployment records. Follow items through planning, development, review, testing, and release, including approvals or dependency waits outside your board.
When those records sit in separate tools, handoffs can be hard to follow. Axify's Value Stream Mapping brings data from Jira, GitHub, GitLab, Azure DevOps, and Bitbucket into one view from ticket to production.
Our guide to value stream analysis explains how to examine that flow.
Once you have that map, use cycle time to see where elapsed time accumulates. Gather first commit, PR opening, first review, merge, and production deployment timestamps, then label the intervals coding, pickup, review, and deploy.
Keep the measurement boundaries clear. Axify's PR cycle time ends at merge, so including deploy extends your analysis to lead time for changes. Compare the stages and check unfinished work for changes that have been waiting unusually long.

A long stage can include both work and waiting, so you need the time spent in each board column. Axify provides these column times alongside value stream mapping, and they add up to issue cycle time.
Your team then decides which columns represent active work and which represent waiting. Divide active time by total cycle time and multiply by 100. Two active days out of 10 total days gives you 20%.
You calculate flow efficiency yourself from those column times, so the result depends on how your workflow is configured and which columns you count as active.
Next, compare item counts and arrival and departure timestamps. Look for a growing queue where older items keep waiting.
Then ask the owners what's blocking progress. Testing might be waiting for an available environment, while reviews might lack an assigned reviewer. Each cause needs a different fix.
Check weekly stage durations and completion counts against staffing changes, holidays, and release schedules. Use four to six weeks of existing history to see whether the same stage repeatedly delays similar work.
A single large change can distort the average, so check whether smaller changes are getting stuck at the same point.
Once you've confirmed the pattern, choose one fix and track those metrics afterward.
Each type of bottleneck shows up in a different metric (or combination of metrics), so the variable that changes tells you where to look first.
Here are six patterns and their first fixes:
| Bottleneck Type | Signal That Exposes It | First Fix |
|---|---|---|
| PR pickup and review wait | PRs wait longer for their first review. | Assign a reviewer and a backup. |
| Too much work in progress | Unfinished items accumulate and age. | Set WIP limits and finish existing work. |
| Handoffs and cross-team dependencies | Cross-team blocked time and low flow efficiency. | Name an owner for each dependency. |
| Waiting before development starts | Ready tickets remain unstarted. | Resolve missing requirements and approvals. |
| Deployment and release delays | Merged changes keep waiting for production. | Address the slowest release gate. |
| Rework and failed changes | Rising change failure rate, failed deployments, time to restore, and share of bugs among completed issues. | Investigate recurring failures and add targeted tests. |
Each pattern from the table gets a closer look in this section: what the delay looks like day to day, which metrics confirm it, and how to fix it.
Your developer opens a pull request and moves on to another ticket. If the change sits untouched for days, they may have to reread the code when feedback finally arrives. That delay stretches feedback cycles, even if the code itself took only a few hours to write.
Axify's pull request cycle time breakdown shows pickup time, from PR opening to first review, and review time, from that first review to merge. Check PR size alongside both. A small change can sit because nobody owns its review, while a change across several components may need several reviewers.
To see how much of the total delay review accounts for, zoom out to the issue level. The cycle time breakdown by stage shows the share of time work spends in review compared with planning, development, QA, and deployment.
To ease a PR review bottleneck, assign a reviewer when the PR opens, with a backup for absences. Agree on when a first response should arrive during working hours, and make room for reviews in the team's schedule. Split large changes into smaller pieces that reviewers can understand and validate independently.
If AI tools help your team produce more changes, check whether their review capacity grows with that volume. Otherwise, the extra code can pile up before anyone validates it.
Authors should explain generated changes, include relevant tests, and check the output before requesting review. Then watch pickup and review times as AI adoption changes from team to team.
You can judge software productivity by what the team can verify and deliver, alongside what it can generate.
Pro tip: Before you blame AI for a longer review queue, check how your teams actually use it.
Axify's AI adoption and impact score rates each team on three pillars: reflexive use (how often AI is part of the daily routine, measured as active days over the last 28 days), reliance (how heavily people lean on AI when they use it) and trust (how steady the usage habit is over time). It also separates active users from licensed users, so you can see which seats are actually in use.
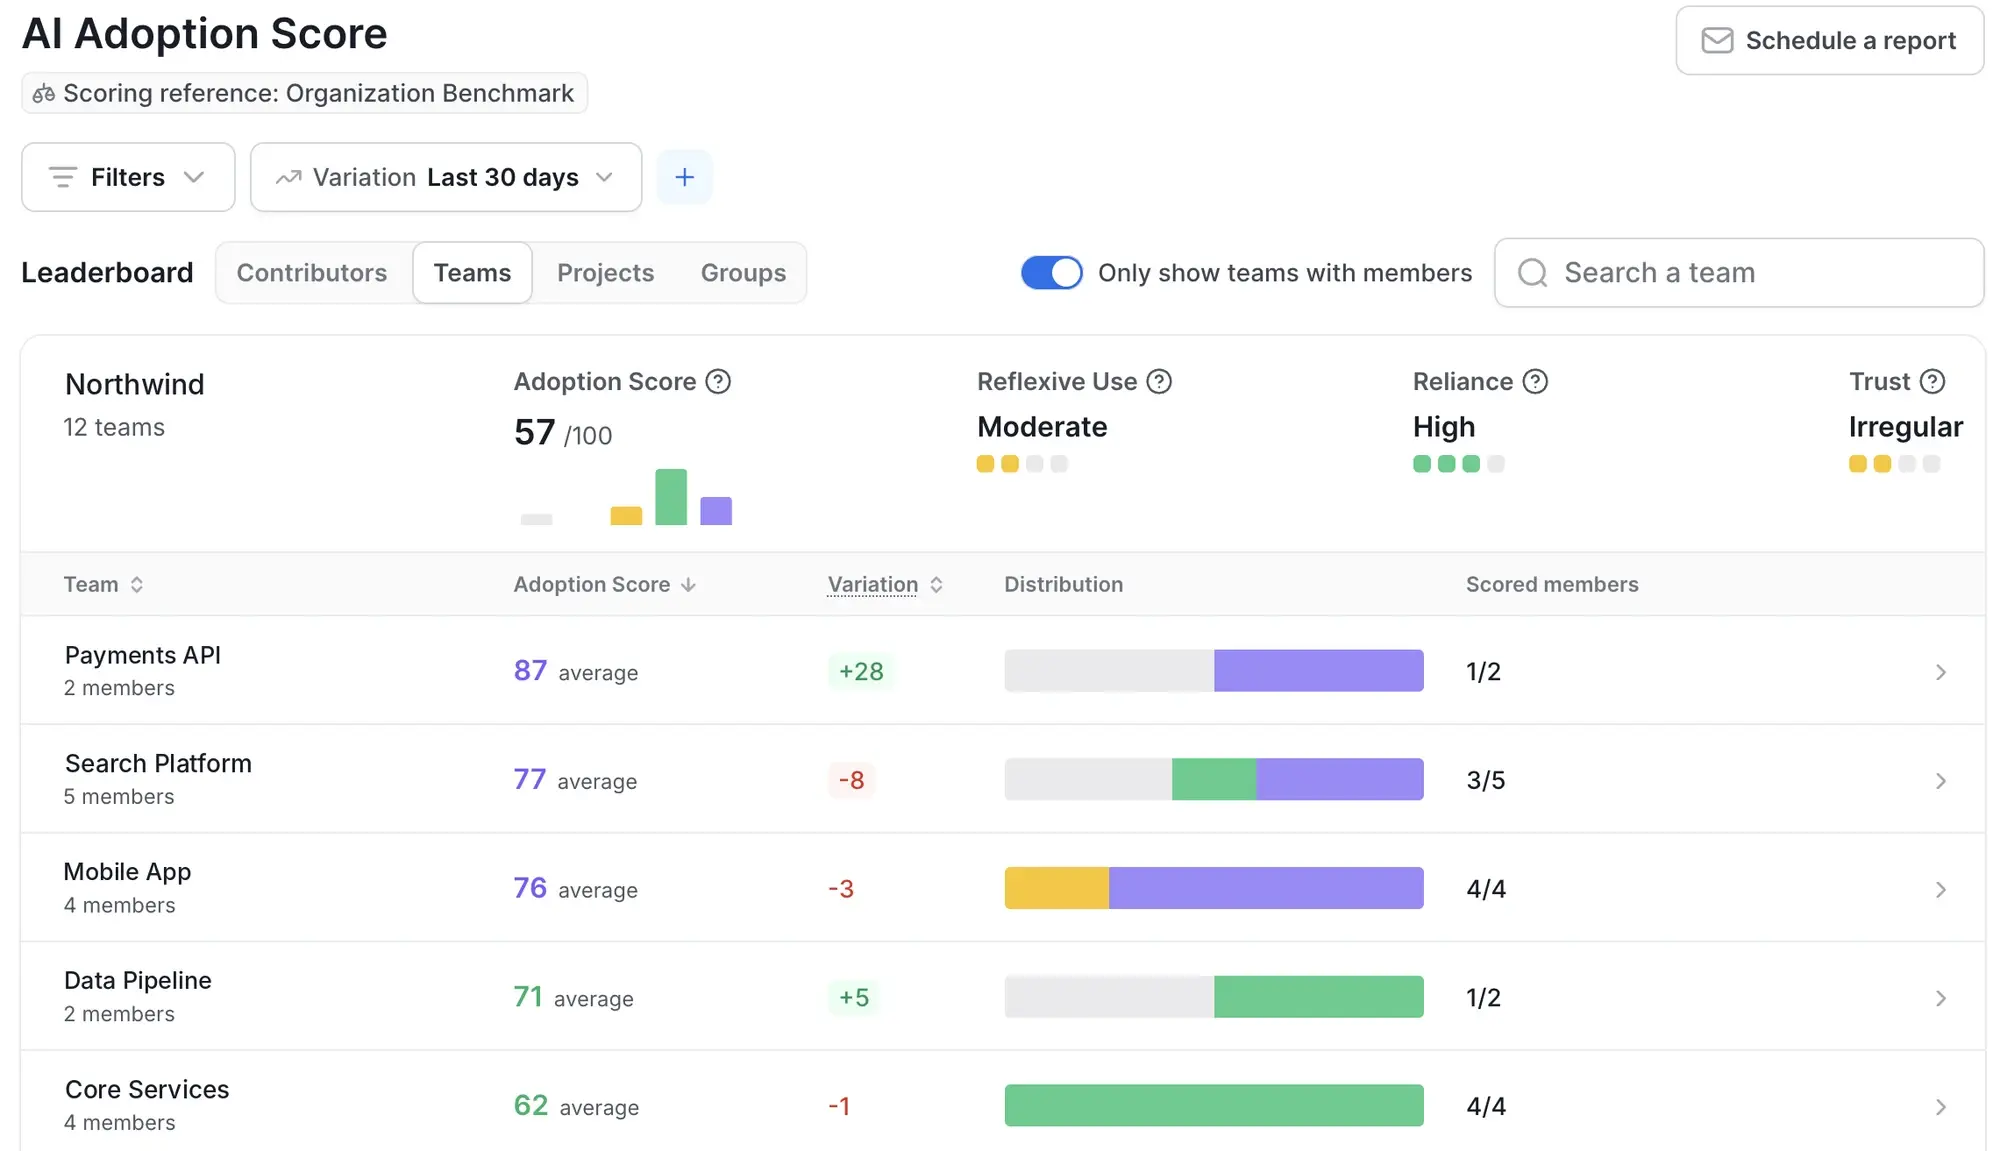
AI acceptance rate measures how often developers actually use AI-generated suggestions. A rising acceptance rate next to a growing pickup time usually means more generated code reaches reviewers than the team can absorb. To check whether AI changes delivery at all, Axify puts AI adoption next to cycle time, throughput, and DORA metrics for the same teams.
The board is full of active tickets, but the completed column barely changes. Each additional start creates another unfinished item that needs attention.
That means you have too much work in progress and need WIP limits.
Parallel work can also expand faster than integration activity. CircleCI's Q3 2026 analysis of more than 22 million workflows found that feature-branch workflows active on a typical day had grown 40% since Q1, compared with 17% on the main branch. Those are workflow counts, so use the finding as a reason to check whether your own parallel work is reaching completion.
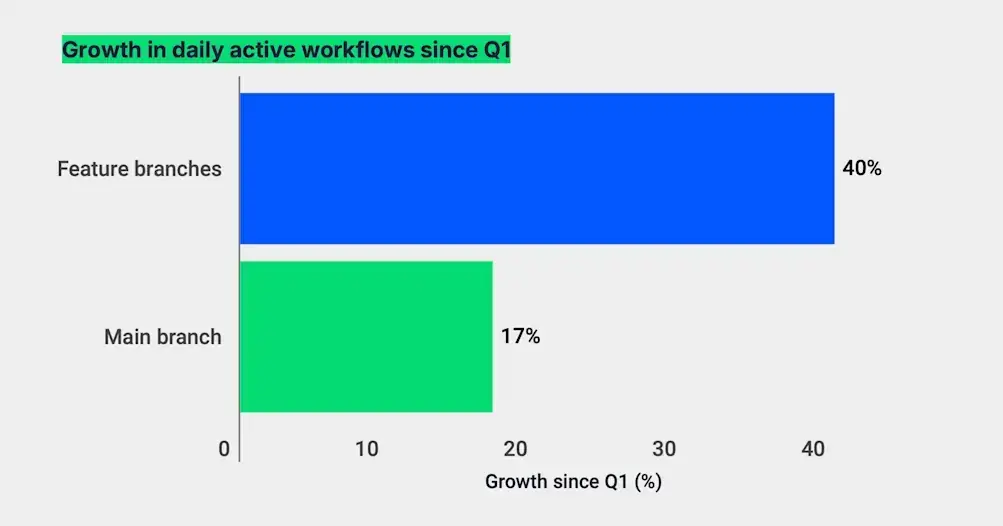
Source: CircleCI's Q3 2026 analysis
These flow metrics work together, so review WIP, aging items, and throughput on the same timeline.
Set work in progress limits for each stage and pause new starts when a limit is reached. People with spare capacity can help review, test, or unblock existing items. Review limits weekly as part of continuous improvement, and adjust them as capacity changes.
A change may be ready from your team's perspective, but another team may still need to approve an API, supply test data, or review a shared component. That handoff leaves the ticket open even though its current owner can't move it forward.
To fix this:
Missing context can make these waits harder to resolve. In Stack Overflow's 2026 Developer Survey, 60.9% of the 12,374 respondents said important context living in people's heads makes it difficult to get the context they need for work. That matters even more when the context holder is unavailable, because the next team takes even longer to proceed.
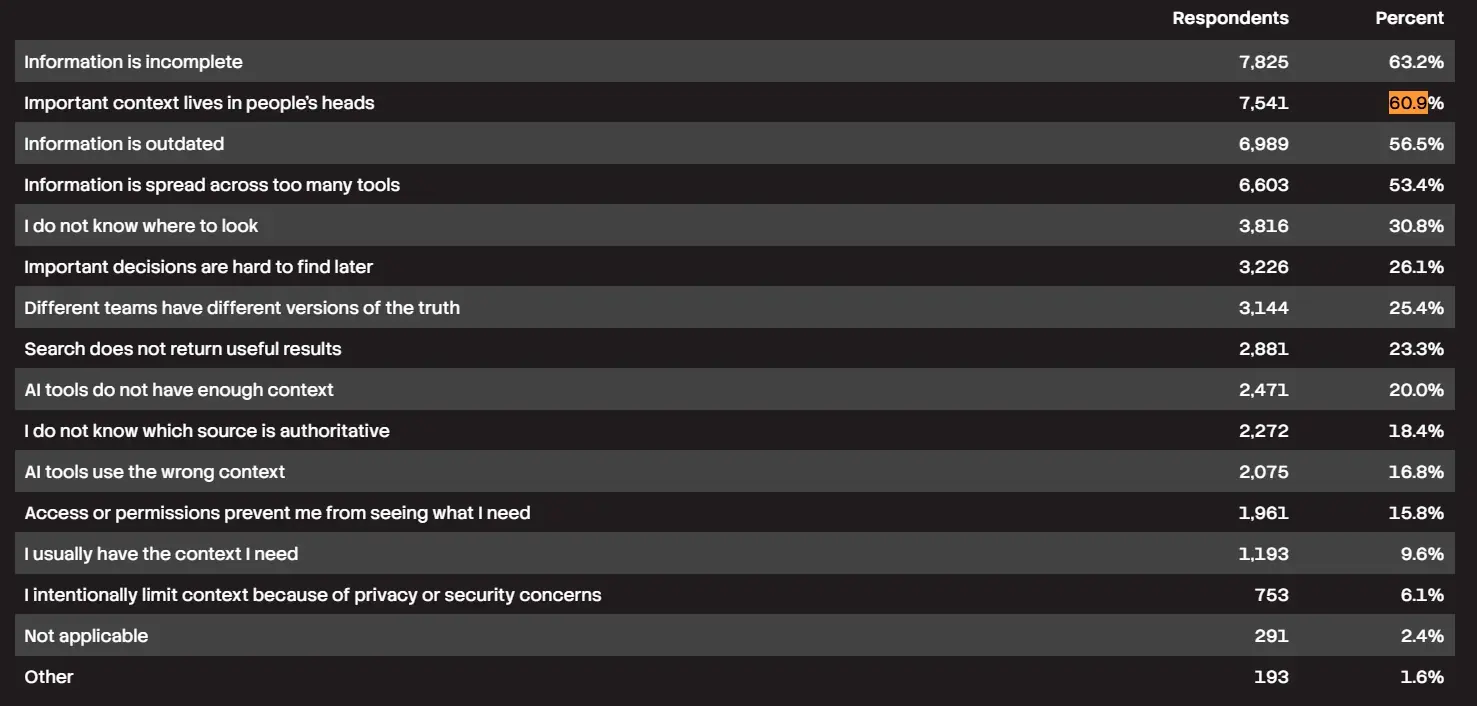
Source: Stack Overflow's 2026 Developer Survey
To avoid this, give the receiving team a short written explanation of the change, the relevant decisions, and any acceptance criteria. Then agree on response times, escalation contacts, and what counts as a complete request through a shared service agreement.
If the same boundary blocks work repeatedly, review the ownership split. A team that needs outside approval for every small change may need broader responsibility for that component. So, start with the recurring delay and agree which decisions it can own safely.
A ticket can be approved and still sit for days before anyone starts coding. Sometimes "ready" means the request has a priority, while acceptance criteria, access, or a product decision are still missing.
Measure time spent in each backlog status, including refinement and ready for development. Check status entry and exit timestamps directly. Subtracting PR cycle time from issue cycle time won't reliably isolate this wait because the two metrics can cover different boundaries and overlapping work.
To see that earlier delay alongside coding and release, you need the full ticket history connected to the delivery stages. In Axify's value stream map, this wait has its own stage, Awaiting development, shown next to planning, development, and post-development time.
Ask Axify Intelligence "Where do we lose the most time before delivery?" and it can point you to the stage, and the teams, where ready issues wait longest before work starts.
A weekly review of upcoming tickets gives the team a chance to settle questions before work is scheduled. So, break large requests into smaller tickets with clear acceptance criteria. Each ticket should name the expected behavior, the checks that confirm it, and any prerequisites.
When scope creep changes those conditions, update the ticket and agree what moves out of the current request. Keeping an expanding request marked ready makes it harder to distinguish preparation from actual waiting.
The PR is merged, but customers are still using the old version. The change may be waiting for a scheduled release, a manual approval, or a test environment that another team is using.
That's why you should track deploy time, measured from merge to production. Review deployment frequency alongside that delay and the batch size per release. If merged changes accumulate between infrequent releases, the release process may be setting the pace.
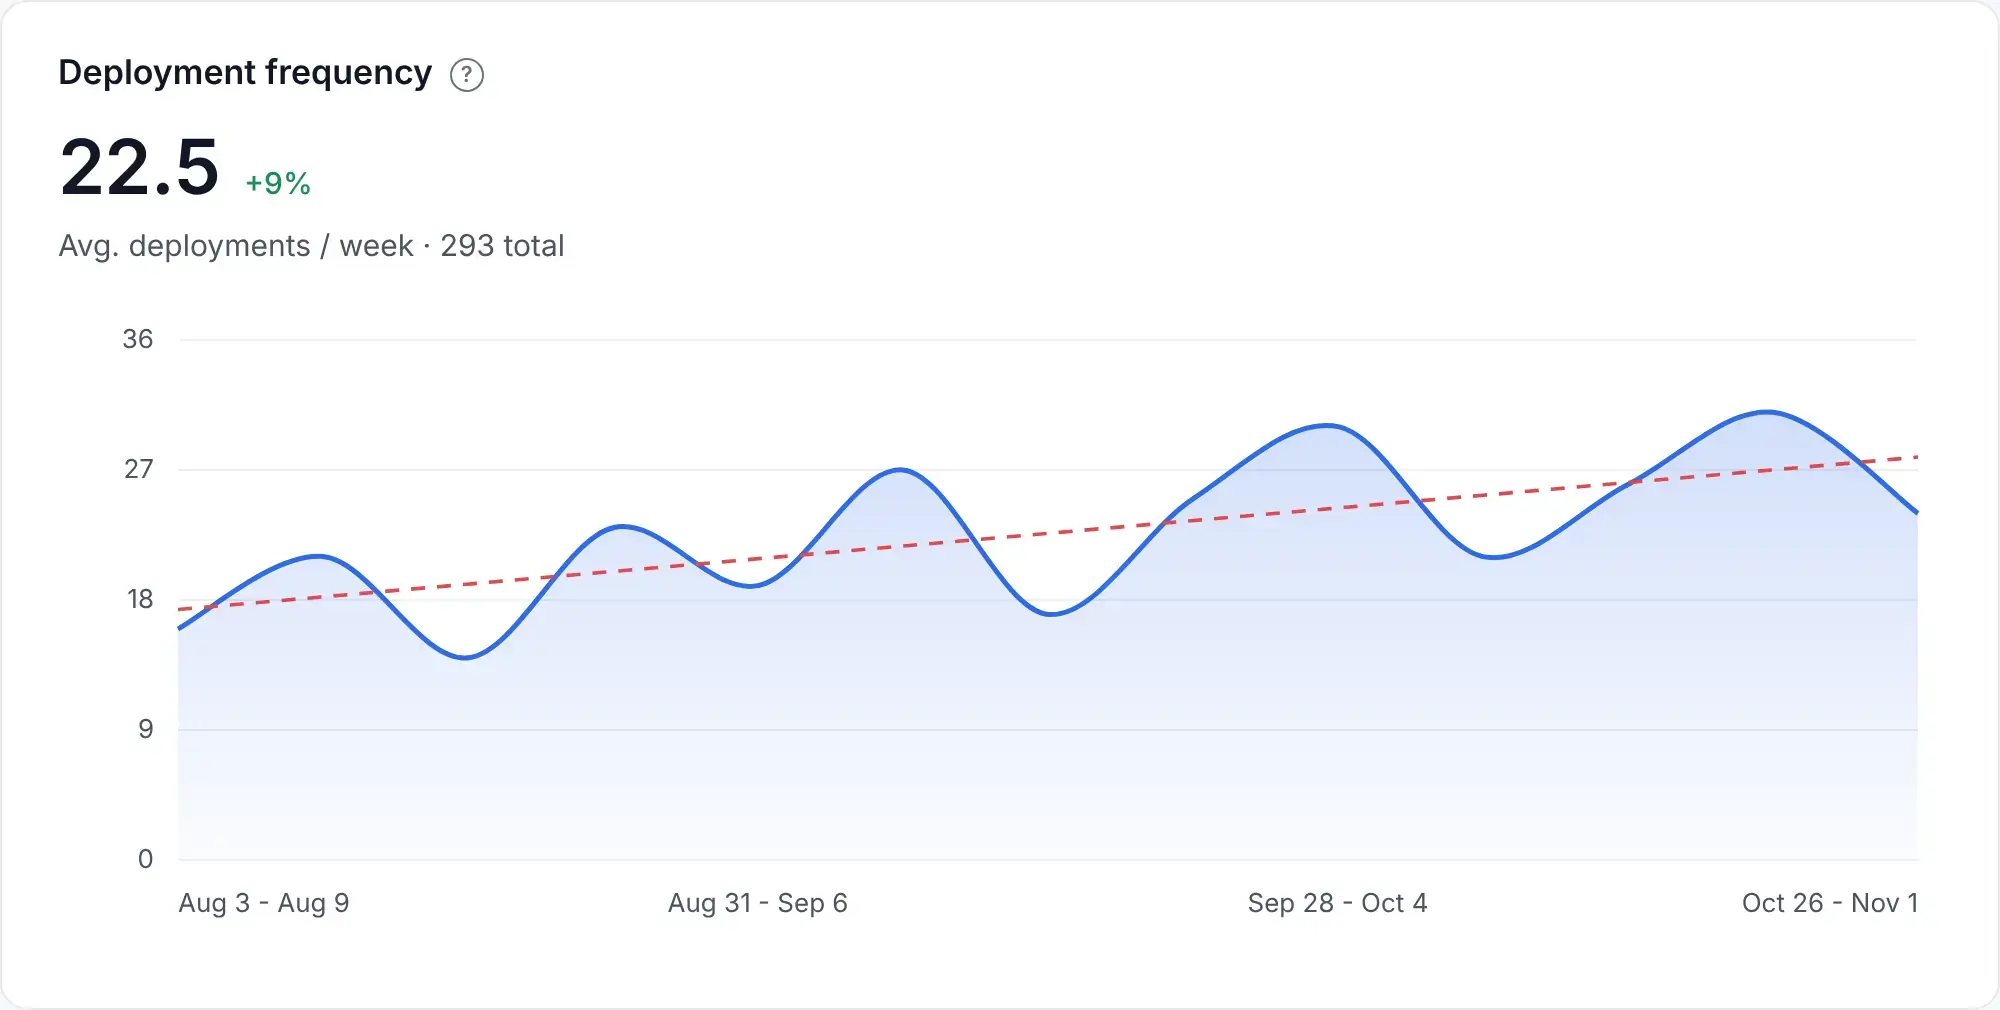
Pro tip: Before adding automation, identify the step that increases your waiting time.
Is the pipeline slow, or does a completed build sit until someone approves it? Manual testing environments can also create a queue when teams share one setup and must wait their turn.
Automate repeatable build, test, and deployment steps, and make environment setup reproducible. For approvals, define who can decide, what evidence they need, and who covers an absence.
If a release train is the constraint, move toward continuous delivery in manageable steps, for example with progressive delivery. Start with a service that can be tested and rolled back independently. Feature flags can separate code deployment from feature availability, so an unfinished launch doesn't hold every unrelated change.
Lastly, check that smaller releases shorten merge-to-production time without increasing production failures. The aim is to deliver high-quality software more frequently, with a clear way to stop or reverse a problematic change.
The ticket is closed, then a bug sends the team back into the same code. Or a deployment needs a rollback and a follow-up fix. Either way, capacity that could have finished planned work goes into correcting something already shipped.
To investigate this pattern in Axify, check change failure rate, failed deployments, failed deployment recovery time, and the share of bugs among completed issues. Here, failures mean production deployments that need immediate intervention, such as a rollback or hotfix.
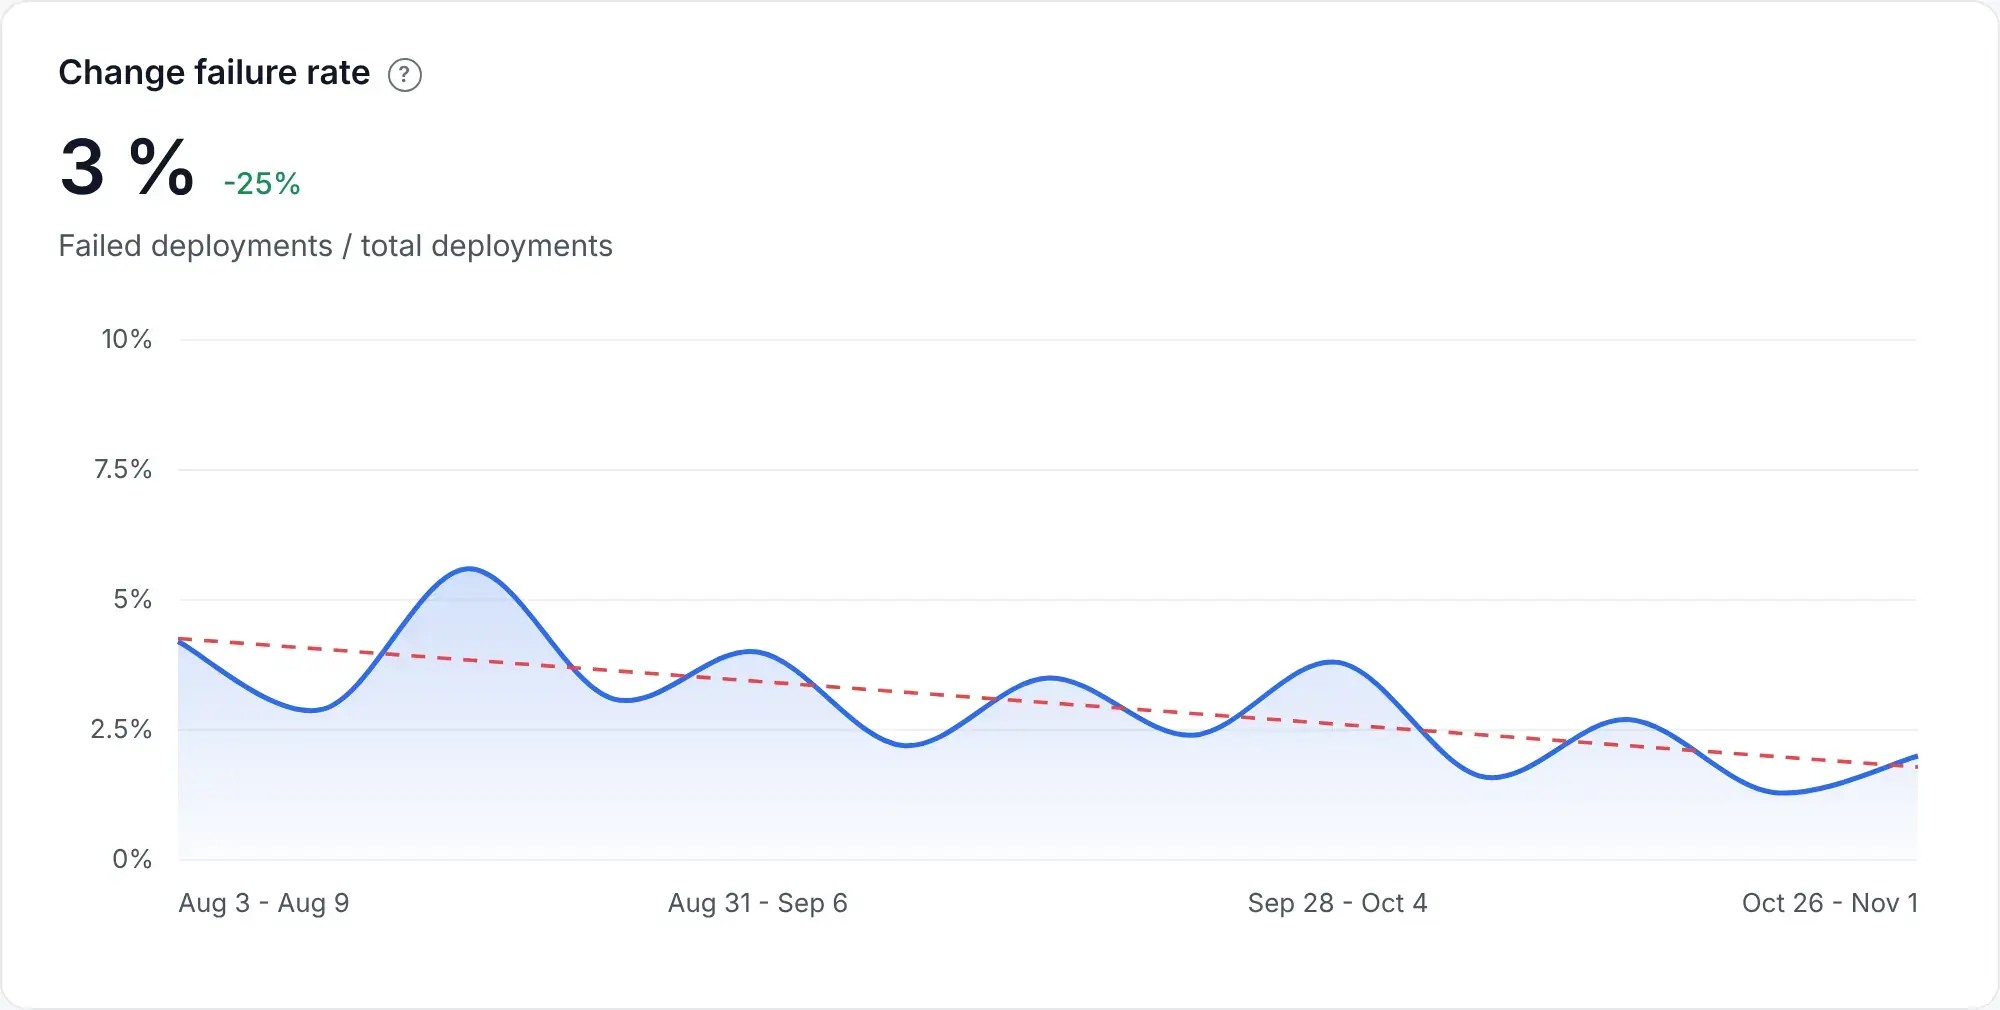
Rework doesn't show up as a single number, so read it through these signals together. For deployment-related recovery, use DORA's failed deployment recovery time, the time needed to recover from a failed production deployment.
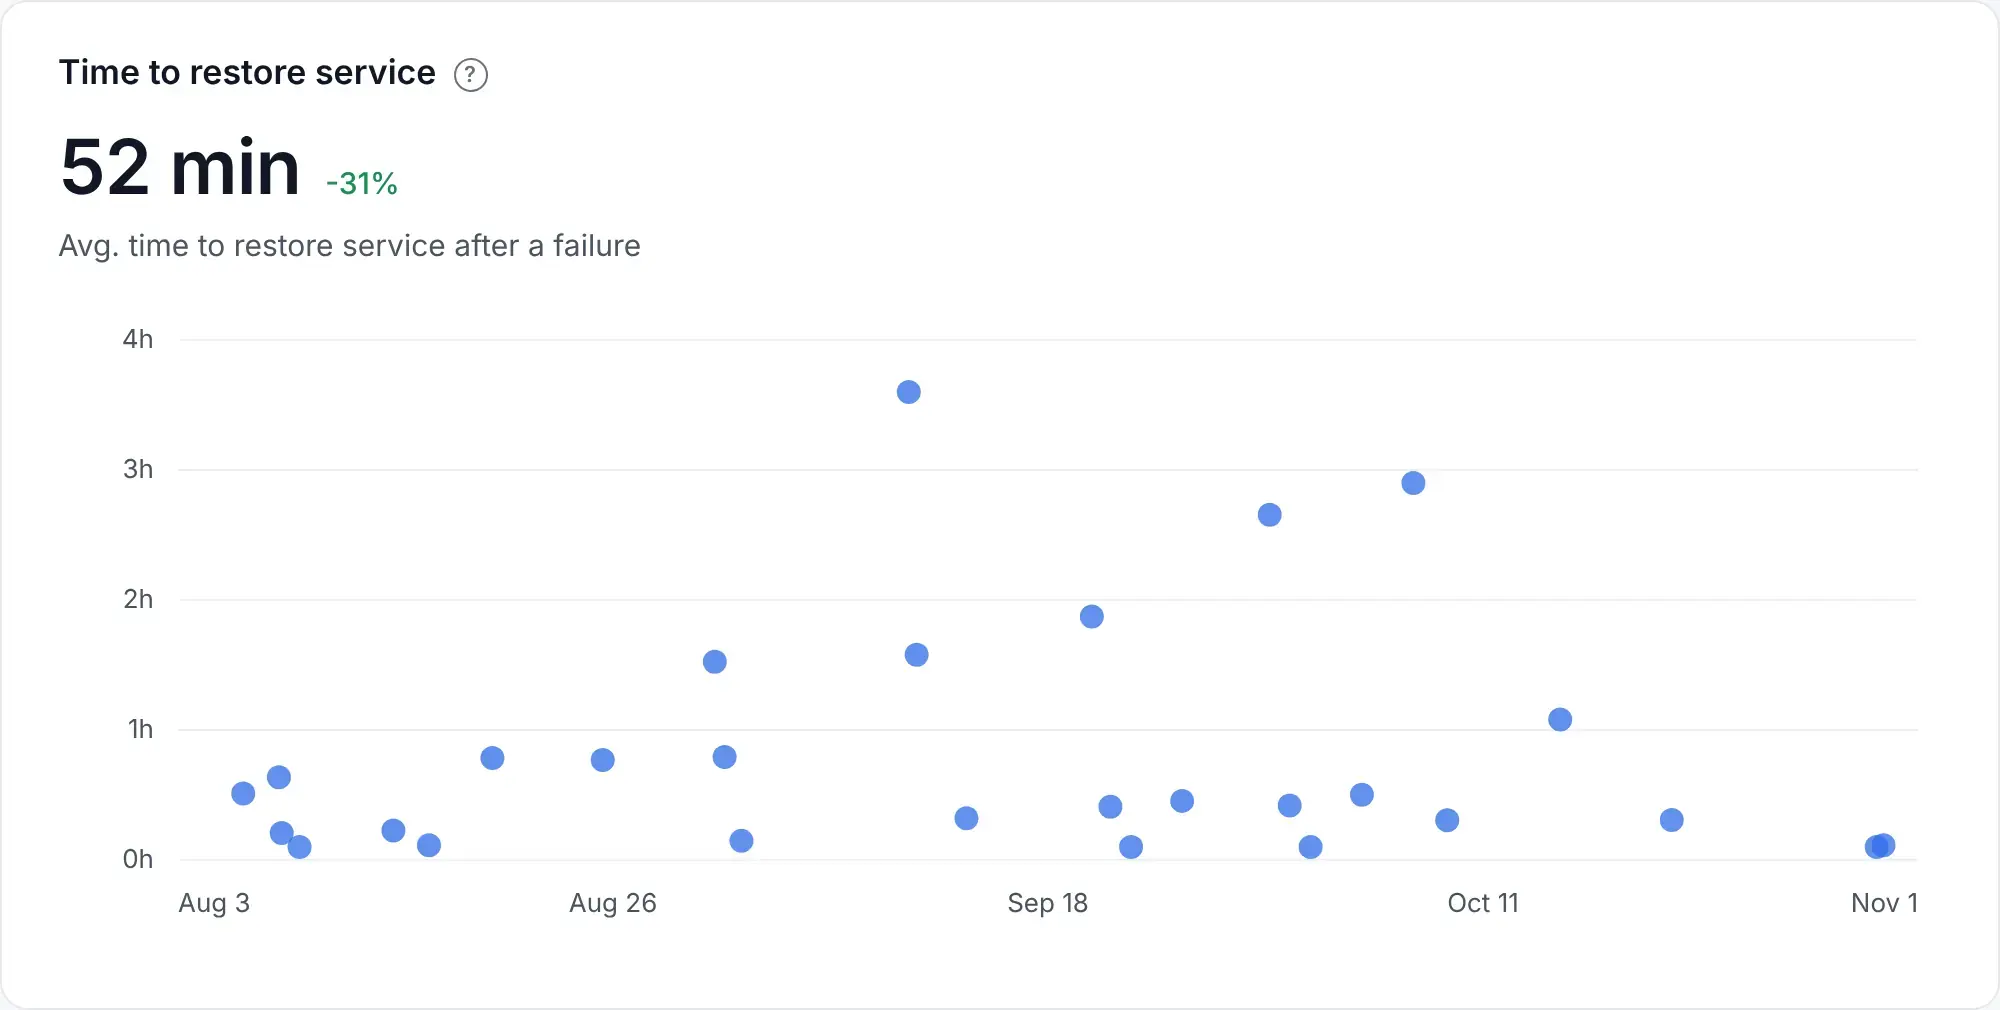
DORA groups delivery metrics in two categories: throughput and instability.
So, look at delivery volume and speed, but also analyze failed deployments and recovery time for the same service. If failed deployments and recovery time rise along with throughput, rollbacks and hotfixes are absorbing the capacity you gained.
AI-generated code needs the same scrutiny before it reaches production. In Stack Overflow's 2025 Developer Survey, 45% of the 31,476 respondents to the question on AI frustrations said debugging AI-generated code is more time-consuming.
So, ask your developers which corrections keep recurring, then check their reports against your deployment and issue records.
Bring reviews forward on risky changes, add tests around modules with recurring defects, and review the cause after a failed release. If technical debt repeatedly breaks the same path, address that specific weakness and check whether failures decrease.
Side note: Faster coding also has a price. Axify's AI cost view brings Claude Code, Cursor, GitHub Copilot, and LiteLLM spend into one total, by model, team, and contributor, with a projected trend. Put AI cost next to PR throughput: if spend climbs while merged work stays flat, the extra output is likely stuck in review or rework.
Your existing tools already hold useful timing data. For bottleneck detection without manual dashboards, check which stages a platform maps automatically and what setup it still needs.
Here are two types of bottleneck detection tools to compare.
Jira's cumulative flow diagram shows where issues accumulate across board columns, while its control chart shows cycle time variation. These built-in reports rely on your board filters and status mappings.
A widening review band is a reason to check whether review capacity matches incoming work. Confirm which statuses feed that column before comparing periods.
GitHub's Pulse summarizes pull requests, issues, and commits within a repository. You can inspect activity there, then check individual PRs to investigate review delays. Tracing earlier ticket waits also requires the relevant issue history.
Pro tip: Our guide to SDLC tools covers the wider planning, coding, testing, and deployment stack, so feel free to check it out.
Engineering analytics platforms, also called software engineering intelligence platforms, connect your issue tracker, Git provider, and CI/CD tools and calculate stage durations for you. Most break pull request cycle time into coding, pickup, review, and merge. They differ in how far the view extends before coding starts and after merge.
Axify's value stream map covers the full journey from ticket to production in four stages: planning, awaiting development, in development, and post development. Once your tools are connected, Axify maps each stage automatically and highlights where tickets wait, with no custom dashboards to build. Check that the workflow mapping matches your process.
When you compare platforms during a trial, follow one recently delayed ticket through each one. Check whether its reports show the wait before coding, review delays, and the final move into production.
Pro tip: Our value stream mapping tools comparison covers other options and their delivery-stage coverage.
These five mistakes come up most often when teams try to remove a bottleneck.
Axify's value stream mapping software shows where tickets wait between planning and production.
Board-column times, cycle time, throughput, and work in progress help you check where unfinished work accumulates. You can compare review times before and after assigning a dedicated reviewer.
DORA metrics add deployment frequency, lead time for changes, change failure rate, and failed deployment recovery time. Together, these show whether faster releases also stay reliable.
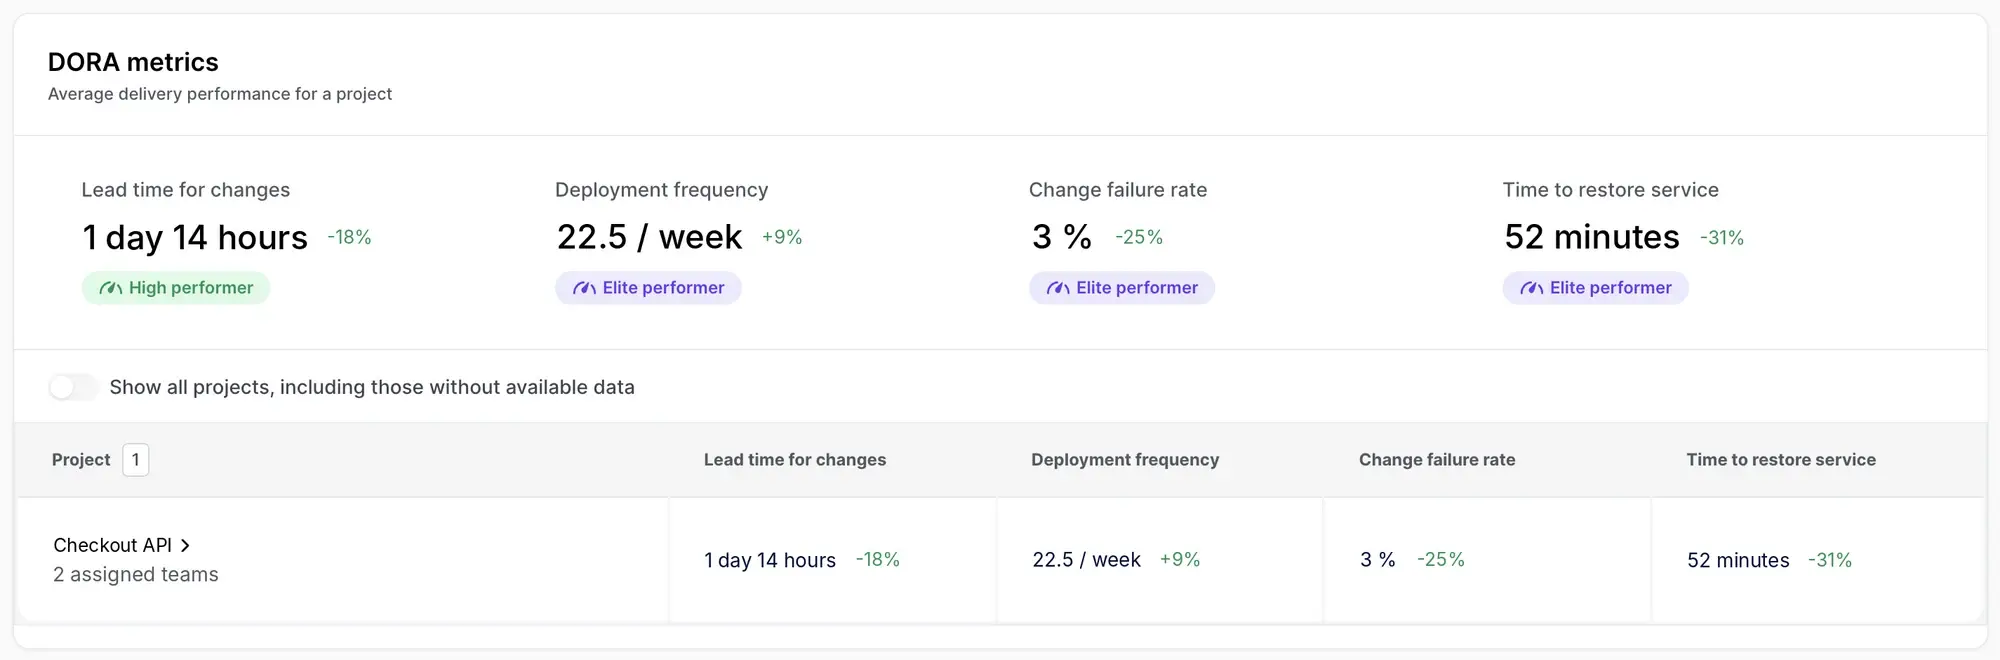
Axify Intelligence explains those changes in plain language. It reads your value stream, flags the stage where tickets wait longest, recommends where to focus with an estimated impact on delivery time, and lets you act on that recommendation directly from the platform. It can also add an AI summary of the key changes to the reports you send by email, now or on a schedule.
Ask it questions in the app, or query the same data from Claude, ChatGPT, or Cursor through the read-only MCP server, for example: "Which team's review time increased last week?"
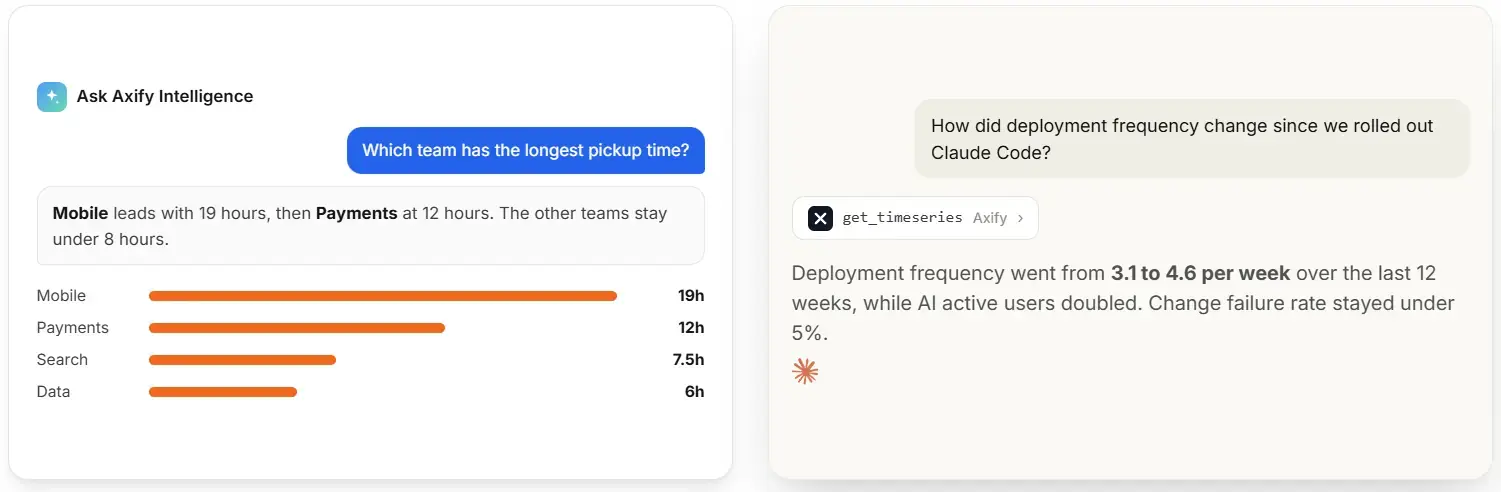
To find your software delivery bottlenecks, start with the stage where work keeps waiting, fix it, and check that releases get faster without getting less reliable.
Want to see where your tickets wait between planning and production? Start your 14-day free trial of Axify.

You identify bottlenecks by mapping ticket-to-production stages and finding where waiting time and unfinished work repeatedly accumulate. Compare issue histories, pull request timestamps, and deployment records across four to six weeks, then address the stage limiting completed work.
PR pickup and review delays are common software delivery bottlenecks, although the main constraint varies by team. Check whether pull requests wait for reviewers longer than tickets wait in preparation, testing, or release before choosing a fix.
Flow efficiency measures active work as a percentage of total cycle time, and your first target should reflect waiting you can remove. For example, with two active days, cutting total cycle time from 10 days to eight raises efficiency from 20% to 25%.
Engineering analytics platforms such as Axify show stage durations automatically once your issue tracker, Git provider, and CI/CD tools are connected. When you compare options, check whether a platform tracks waits before coding starts or only from the first commit. Axify maps the full journey from ticket to production.