Delivery Performance
12 minutes reading time


You’ve probably heard that measuring lines of code or tracking completed tickets is a good way to understand your software development team’s progress. We’ve seen lots of engineers thinking these metrics could drive better results.
But here’s the catch: focusing on the wrong numbers can waste time, hide real issues, and even lower your team’s performance. Research shows that 14% of IT projects fail completely, 31% don’t meet their objectives, and 43% run over budget. This can also happen when teams rely on metrics that don’t align with their goals.
Our engineers learned that metrics like these can lead you astray without the right context. That’s why we focus on key metrics reflecting team productivity, software quality, and business outcomes.
By the end of this article, you’ll know exactly how to measure what matters to drive higher ROI.
Let's get started!
Software engineering metrics help you track your software development process's performance, productivity, and quality. These metrics cover different aspects of the software development lifecycle, such as how efficiently your team delivers high-quality code to production, how frequently failures occur, and how quickly issues are resolved.
When used correctly, they guide your software engineering teams in aligning their work with your business goals while improving product quality and user satisfaction.
You track software engineering metrics to identify bottlenecks, improve team performance, ensure quality, and align your work with business objectives. These metrics give you a clear picture of how well your software engineers are performing and where potential issues, such as high defect density or delays in cycle time, may arise.
Monitoring progress over time allows you to make better resource allocations, avoid unintended consequences, and focus on delivering software products that meet user expectations and business goals.
As a side note, those are the principles on which we built Axify in the first place.
Software engineering leaders needed a way to turn those engineering metrics into insights that directly impact your business performance. And you can see all that in our engineering metrics dashboard below:

To understand your team’s performance, you need to track the right metrics in software engineering. These metrics can be grouped into three main categories: efficiency, quality, and team focus. Each is critical in improving your software development projects and aligning with your business goals.
Efficiency metrics measure how smoothly your team delivers software. These metrics focus on streamlining workflows and reducing delays in the software development process. Examples include:
We’ll discuss those metrics in a second. For now, if your goal is to improve efficiency, you need solid value stream management.
Speaking of that:
Quality metrics help you maintain high standards for your software products by measuring aspects such as reliability and defect rates. Improve these metrics by solving the problems they indicate. It’s how you can boost customer satisfaction and deliver a seamless user experience. Examples include:
Team focus metrics ensure your software engineering team is working sustainably. These metrics indicate whether you have balanced workloads and how you spend your resources. The point is to prevent burnout by providing insights into team capacity and resource allocation. Besides, your performance increases if you place the right people in the right positions. Examples include:
People metrics track team morale, satisfaction, and collaboration, while process metrics focus on workflows, delivery times, and software quality. Combining both gives you a complete picture of your team’s performance.
Not all metrics help you improve. Some can mislead you into thinking your team is performing well when it’s not.
Tracking the wrong numbers can waste time, lower team morale, and even harm the quality of your software products. Let’s look at two metrics you should avoid: misleading and counter metrics.
Some metrics seem useful but fail to capture real value. For example, tracking lines of code might make you think more code equals better productivity, but it doesn’t measure code quality or usefulness.
Similarly, relying on user story points or completed tickets can encourage teams to focus on speed over meaningful progress, leaving quality issues unresolved. These metrics might initially make your executive team happy, but they fail to provide actionable insights about performance levels or user satisfaction.
You should shift your focus to relevant metrics, such as flow efficiency or lead time, which highlight outcomes instead of raw outputs.
Counter metrics act as guardrails against metric over-optimization. For example, while deployment frequency is critical for delivery speed, it needs to be balanced by change failure rate to avoid rushing poor-quality deployments.
Another example is tracking code churn alongside code quality to spot when rapid iterations create more problems than solutions.
Understanding and tracking the right metrics can help you improve the performance of your software engineering team while aligning with your business goals. Here, we explain several key metrics by defining their purpose and impact with examples.
Lead time for changes measures how quickly a code change goes from commit to production. It’s a critical metric for understanding the efficiency of your development pipeline. Elite teams achieve lead time for changes of less than a day, while low performers take between one and six months, according to the 2024 State of DevOps Report.

For example, if it takes your team three weeks to move a change into production, you may have bottlenecks in your code review process or testing stages. Shortening lead time for changes also improves time to market and helps you deliver value to users faster.
Deployment frequency shows how frequently you deploy code to production. It is generally accepted that elite performers deploy multiple times per day, while low performers only deploy every few months. And if you deploy between once per day and once per week, you still have a high deployment frequency.
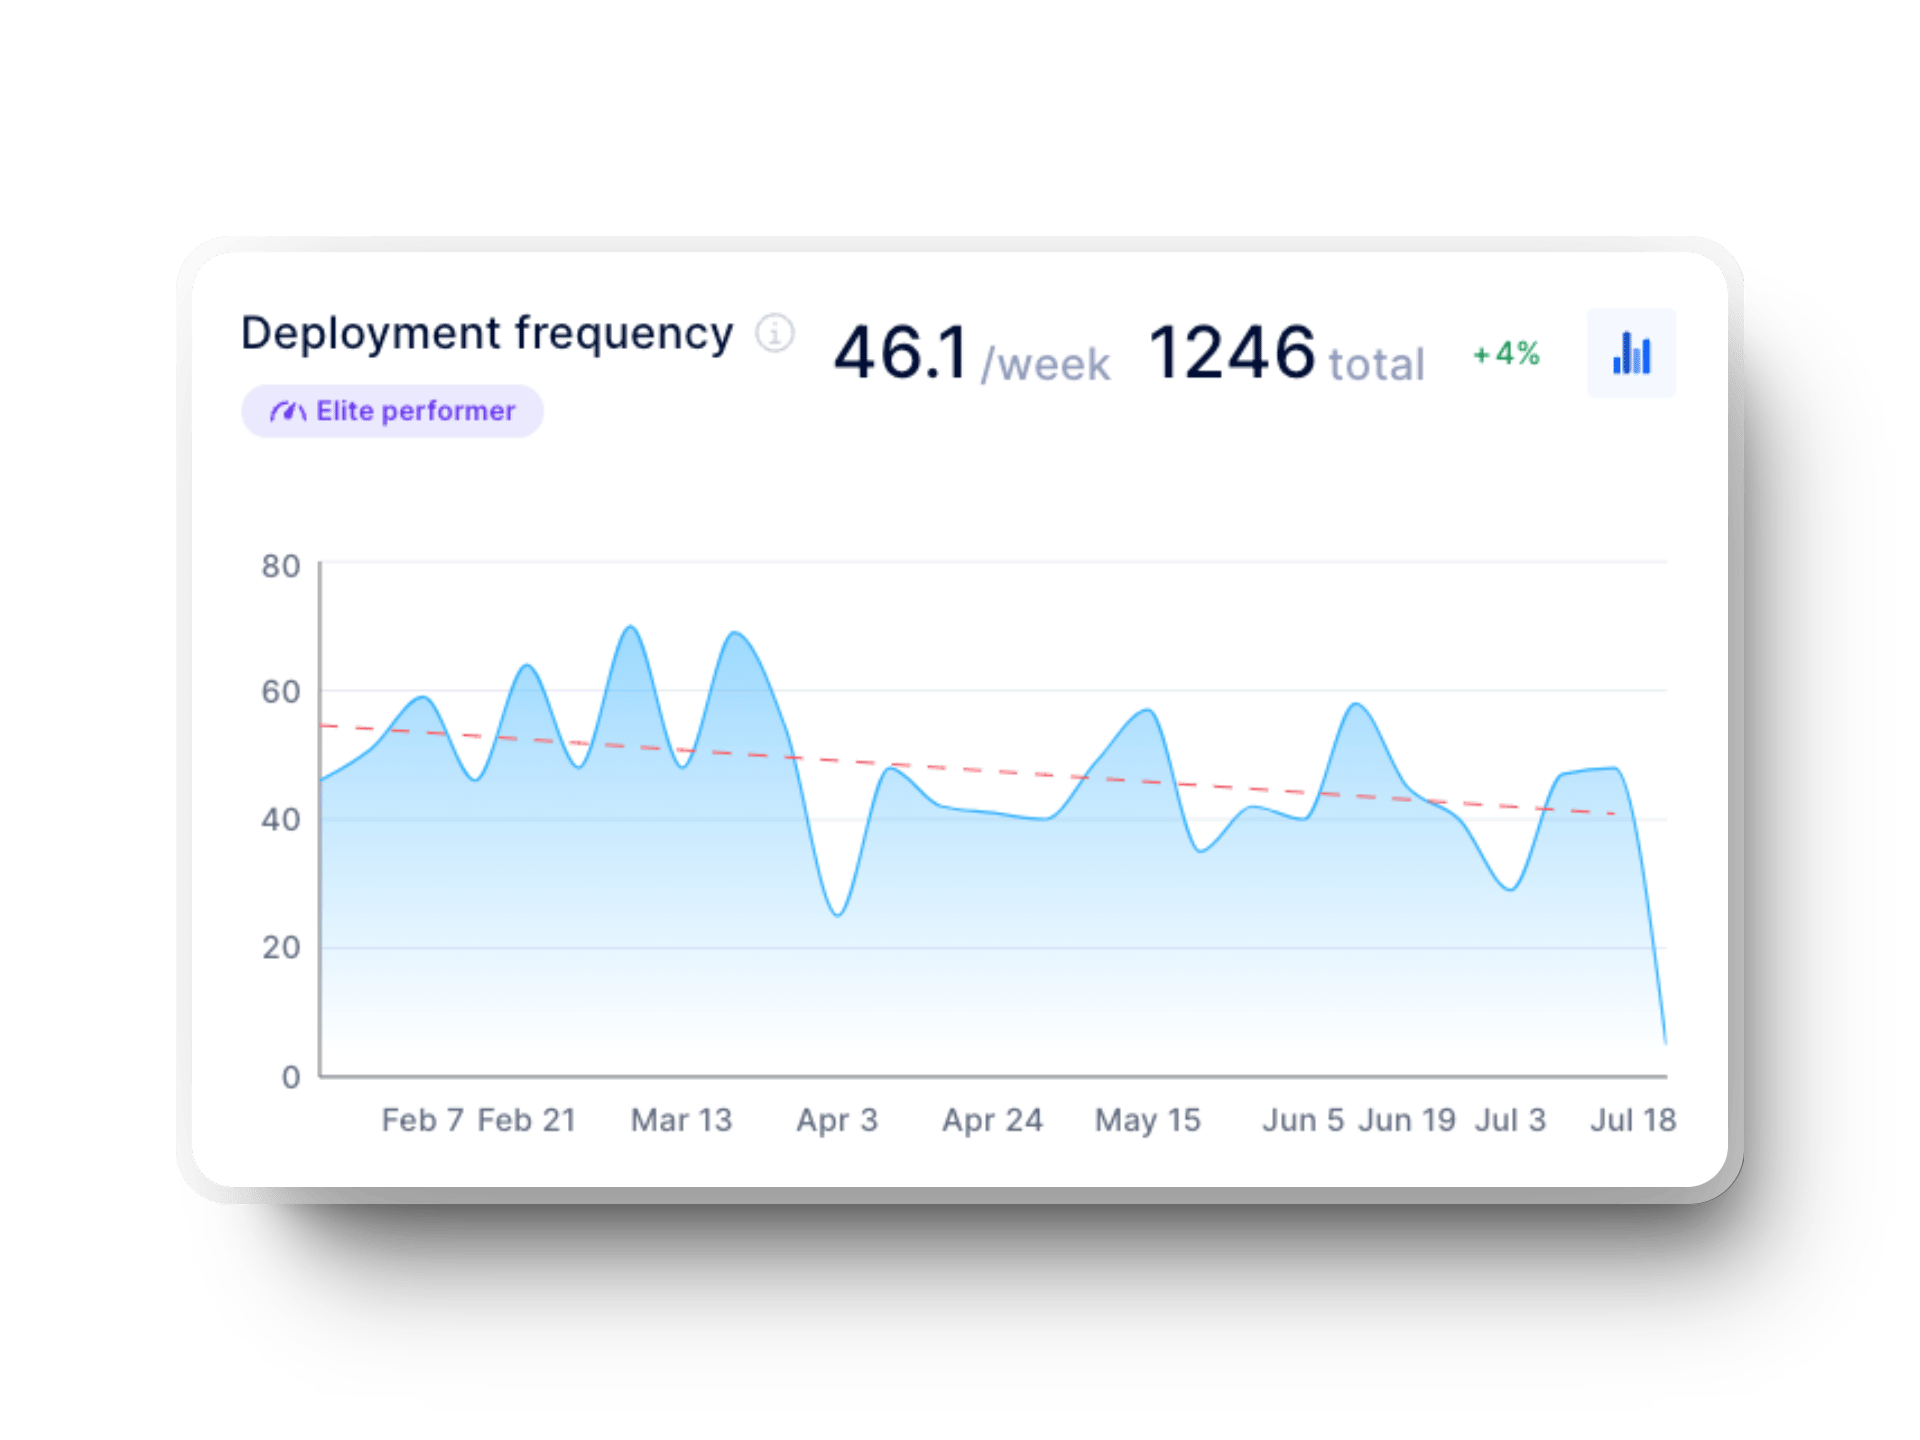
Still, you need some context around this metric. That’s why we advised you to follow SPACE principles earlier – to truly measure your performance, you need at least three metrics across three dimensions.
In this scenario, if your team deploys weekly but faces quality issues, it might be better to aim for smaller, more frequent deployments. This reduces the risk of failure in production and makes it easier to troubleshoot when issues arise.
MTTR, now known as Failed Deployment Recovery Time, measures how quickly your team can restore service after a failure. According to Google's State of DevOps Report, elite teams recover in under an hour, while low performers take weeks.
%20in%20axify%20for%20software%20development%20teams.webp?width=1920&height=1440&name=time%20to%20restore%20service%20(dora%20metrics)%20in%20axify%20for%20software%20development%20teams.webp)
Imagine a scenario where a bug in your production system causes downtime. If your MTTR is over a day, it likely means your team struggles to identify and fix issues quickly.
According to Google’s State of DevOps, though, MTTR is still medium performance between one day and one week. But you can shorten this MTTR even more; it’ll help you ensure even better uptime and user satisfaction.
Change failure rate tracks the percentage of deployments that result in failures requiring fixes or rollbacks. Elite teams have a failure rate of 5%, while low performers reach 40%.
More interestingly, though, high-performing teams have a 2x higher CFR than medium-performing teams. In fact, high-performers’ change failure rates are 20%, while medium-performers' are just 10%.
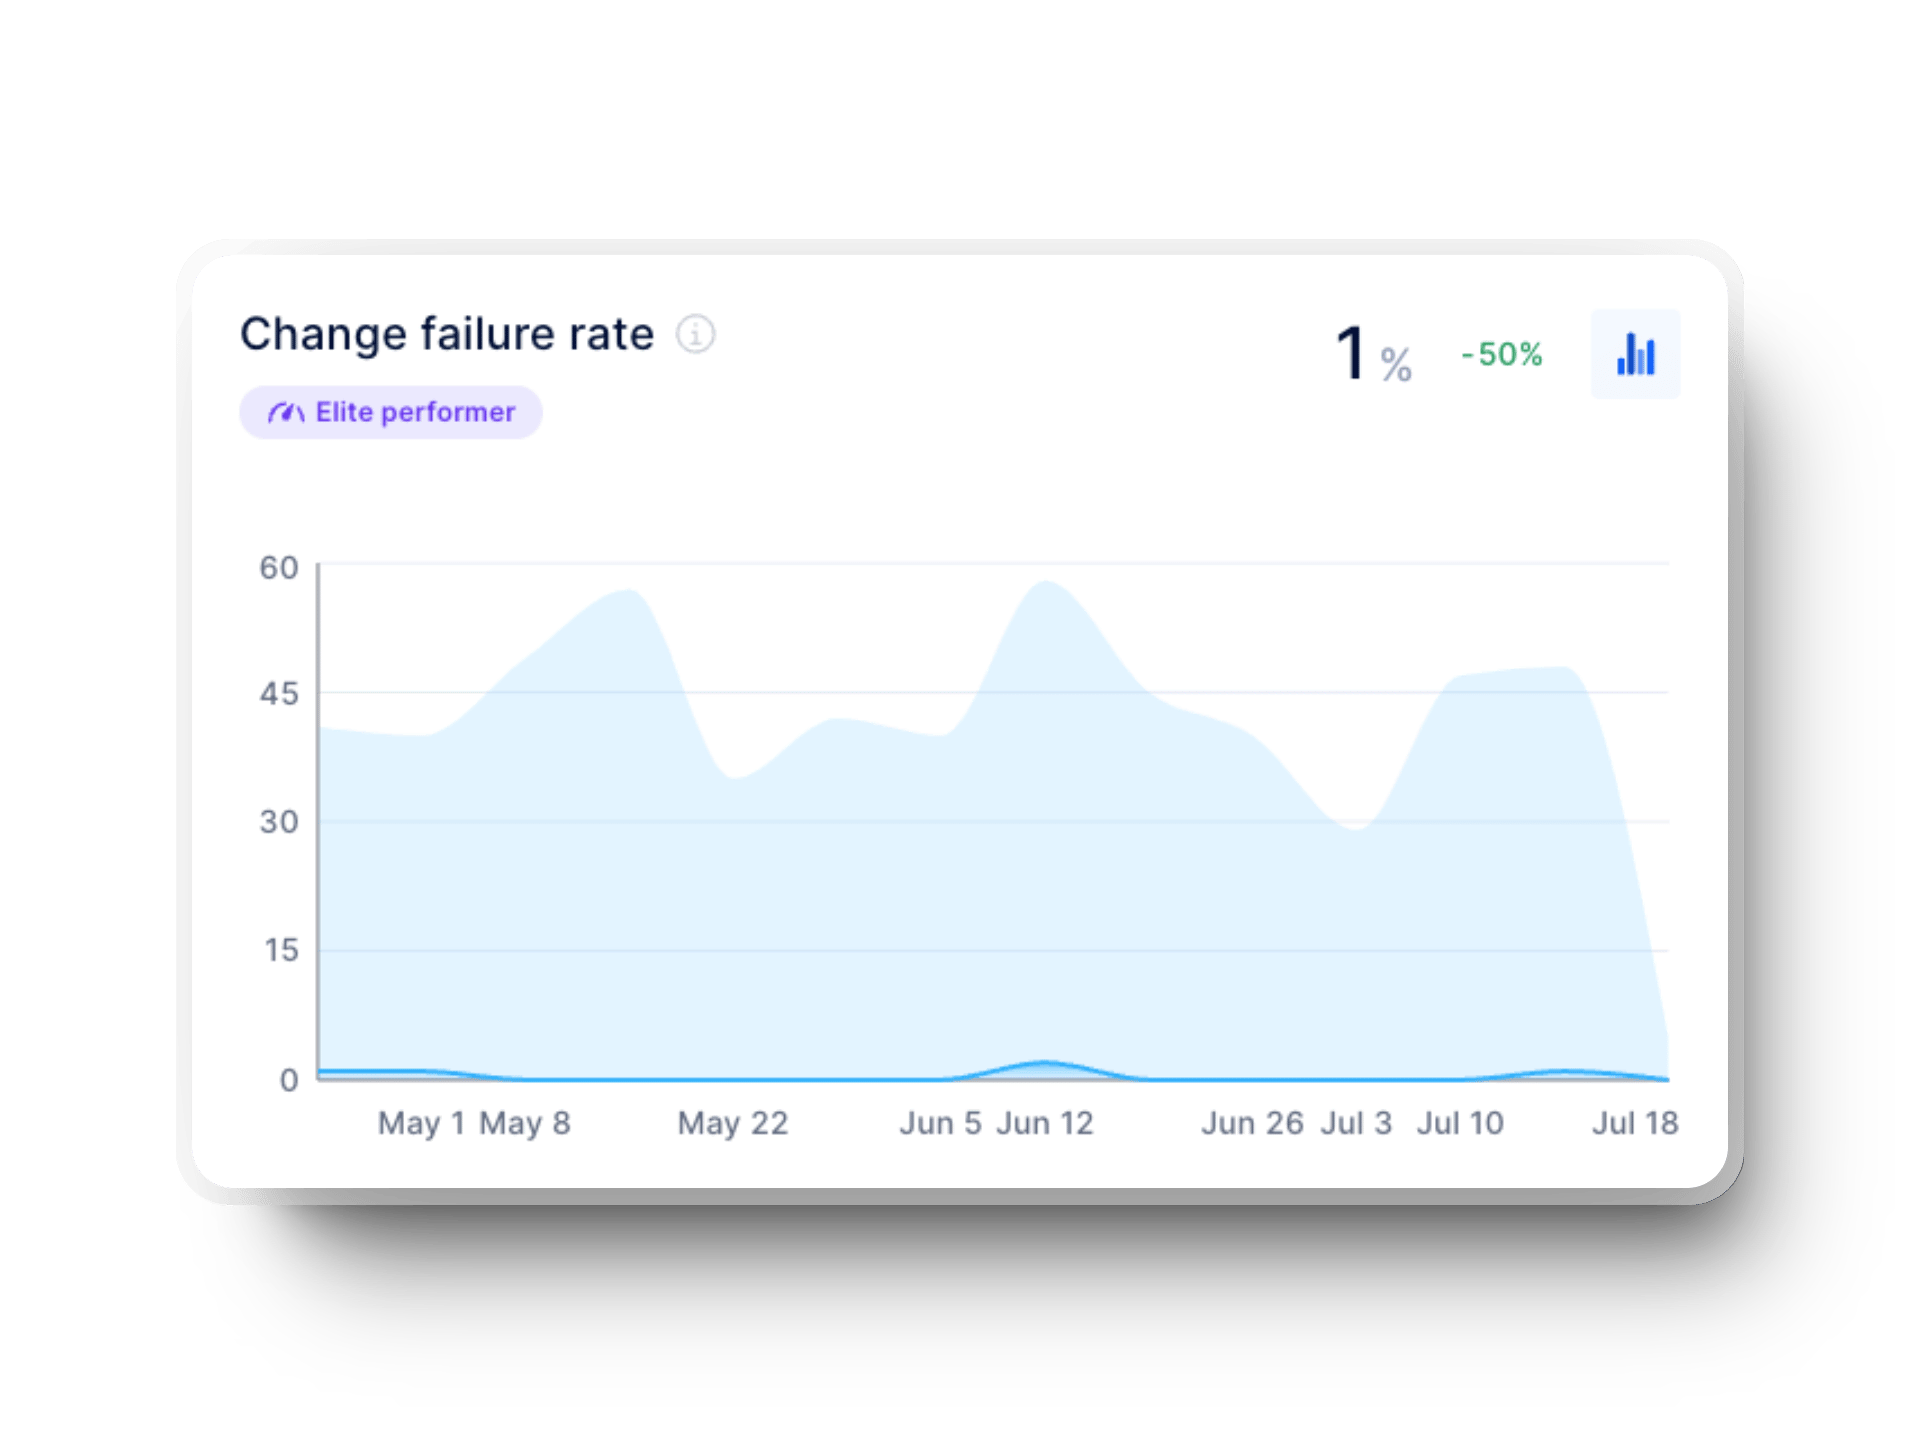
If 20% of your deployments introduce bugs, it could signal insufficient testing or rushed deployments. However, that’s not the case with high-performing teams.
The point is to look beyond stats and focus on quality checks to reduce your failure rate. Code coverage, for example, shows you how much of your code is tested.
The refactor ratio measures the time spent improving existing code compared to writing new code. A study at Microsoft revealed that refactoring efforts have various advantages. In fact:

This shows that you can enhance code quality, long-term maintainability, and performance when you refactor strategically.
For example, if a legacy module repeatedly causes bugs, investing time in refactoring can prevent recurring issues. Tracking your refactor ratio helps you identify areas of technical debt and make better decisions about allocating development resources efficiently.
Code churn tracks how frequently code is rewritten or deleted shortly after creation. High churn typically signals potential issues such as unclear requirements or rushed coding. For example, if you notice repeated churn in a specific programming language, it could mean your team lacks expertise in that area or that the user story was poorly defined.
Moderate churn can be healthy for iteration, but excessive churn wastes time and can lower morale. Monitoring churn helps you identify where workflows or specifications need improvement to keep your software development projects on track.
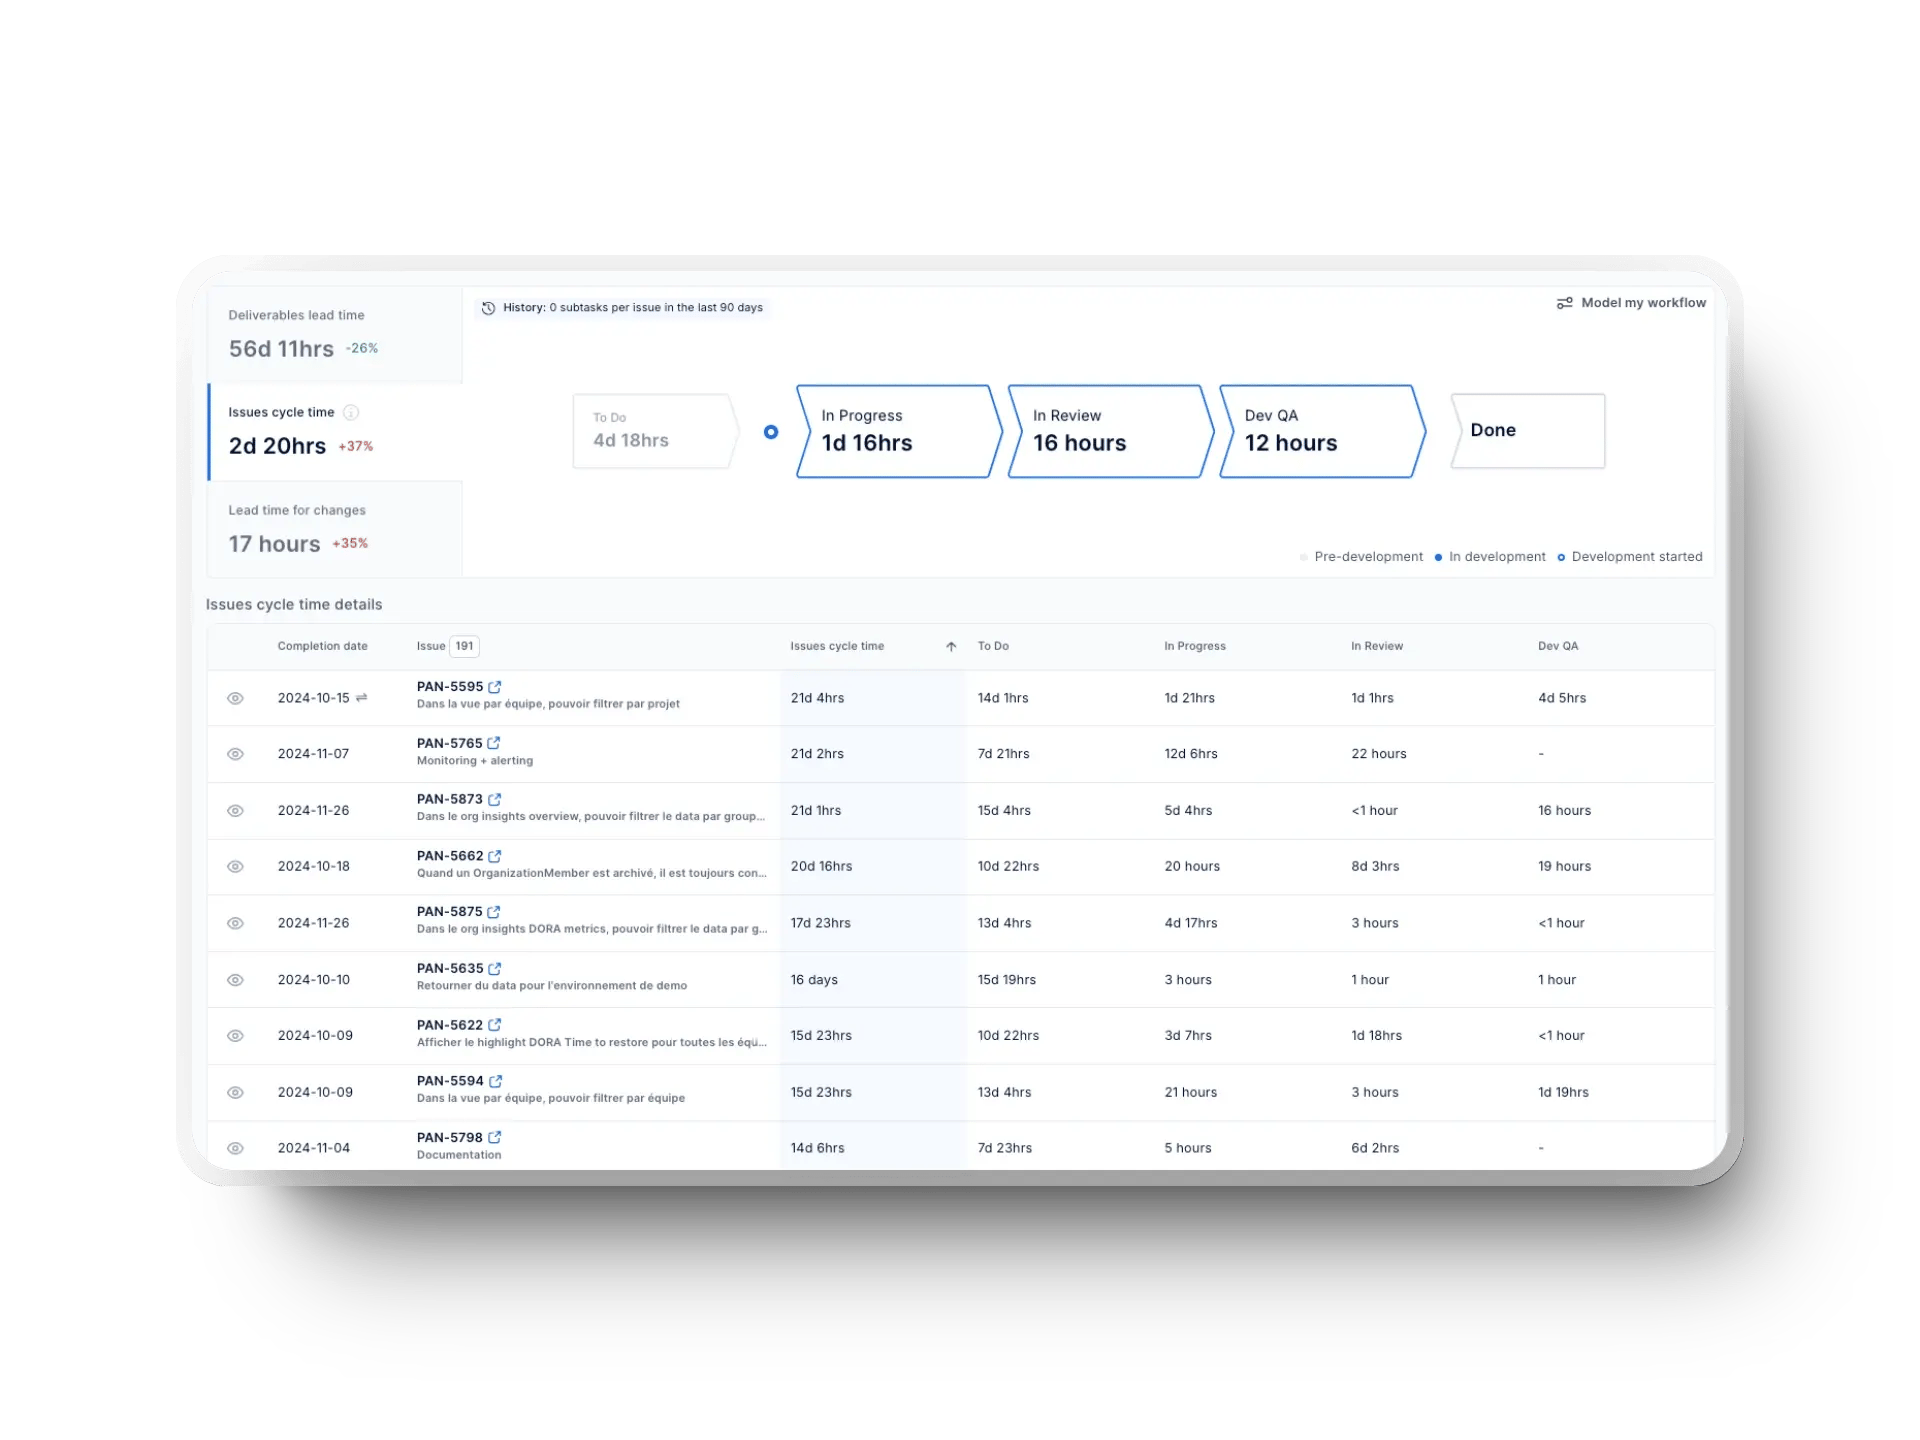
Cycle time measures how long it takes to move a task from start to finish within the software development process. It begins when work starts on a task and ends when it’s ready for deployment.

For example, if it takes your team an average of 10 days to deliver a small feature, you might have bottlenecks along the way. Check your code review process, ensure tasks are adequately prioritized, and verify if there are delays in the deployment stages. Analyze your entire SDLC, especially where you notice different stats than usual trends.
Shortening cycle time improves delivery speed, helps you meet tight deadlines, and improves customer satisfaction, leading to better overall market performance.
Test coverage measures how much of your codebase is covered by automated tests. Aiming for a specific percentage—whether 80% or even 100%—shouldn’t be the goal. The real measure of success is confidence in your system, not just hitting a number.
Higher test coverage can help catch critical quality issues before deployment. Very low test coverage can lead to missed bugs and unintended consequences during deployment.
However, coverage alone doesn’t guarantee stability—what matters is whether the right tests are in place to prevent failures in production.
Basically, prioritizing test coverage helps strengthen the customer experience and reduce the risk of expensive downtime or bugs. Rather than focusing on a percentage, teams should prioritize meaningful tests that validate core system behavior. Otherwise, pursuing an arbitrary metric can lead to "false tests" that inflate coverage numbers without truly improving software quality.
Defect density measures the number of defects found per unit of code, such as per 1,000 lines of code. It helps you assess the code quality of your software products and identify areas prone to errors.
For example, if a specific module has a higher defect density than others, it might indicate poorly written or overly complex code. Tracking defect density lets you pinpoint problem areas, prioritize improvements, and avoid quality issues in future releases.
This metric is especially useful when comparing similar projects or tracking progress in long-term software development efforts.
This metric measures how long code stays in the code review process before being merged. A study analyzing reviews on Gerrit and Phabricator found that reducing the time between acceptance and merging could speed up reviews by 29-63%. If your reviews are dragging on, it might mean reviewers are overloaded or unclear about expectations.
For example, if your team takes an average of 10 days to complete reviews, you could address this by distributing review tasks more evenly or improving review guidelines. Shorter review times ensure faster delivery while maintaining code quality.
.webp?width=1920&height=1440&name=pull%20requests%20cycle%20time%20breakdown%20graph%20in%20axify%20%20(1).webp)
The pull request merge rate tracks how many pull requests are successfully merged compared to those left idle or rejected. As a rule of thumb, you should optimize and complete pull requests in 24 hours.
And if only 60% of pull requests are being merged, you might have communication gaps or unclear review standards. Tracking this metric helps you spot delays and improve developer workflows accordingly. That way, you’ll keep your software development projects moving forward efficiently.
WIP tracks the number of tasks your team is actively working on at any given time. Too much WIP typically leads to context-switching, longer delivery times, and reduced team productivity.
%20in%20Axify.webp?width=1920&height=1440&name=work%20in%20progress%20(WIP)%20in%20Axify.webp)
For example, if your team has 10 ongoing tasks but only completes 5 within a time frame, it might signal that you’re overloading your team.
Keeping WIP levels low allows your team to focus on completing tasks efficiently rather than juggling too many at once. This helps you deliver higher-quality results while reducing stress and avoiding bottlenecks.
Throughput measures the total number of tasks, features, or bug fixes your team completes within a set period of time, such as a sprint or week. This metric helps you understand how efficiently your team delivers value to users.

For example, if your team consistently completes 20 tasks per sprint but suddenly drops to 10, it could signal a bottleneck or a resource allocation issue. Monitoring throughput helps you identify and remove these obstacles, which allows your team to work more effectively.
Throughput is also helpful for tracking trends and ensuring your team maintains steady productivity levels without overloading themselves.
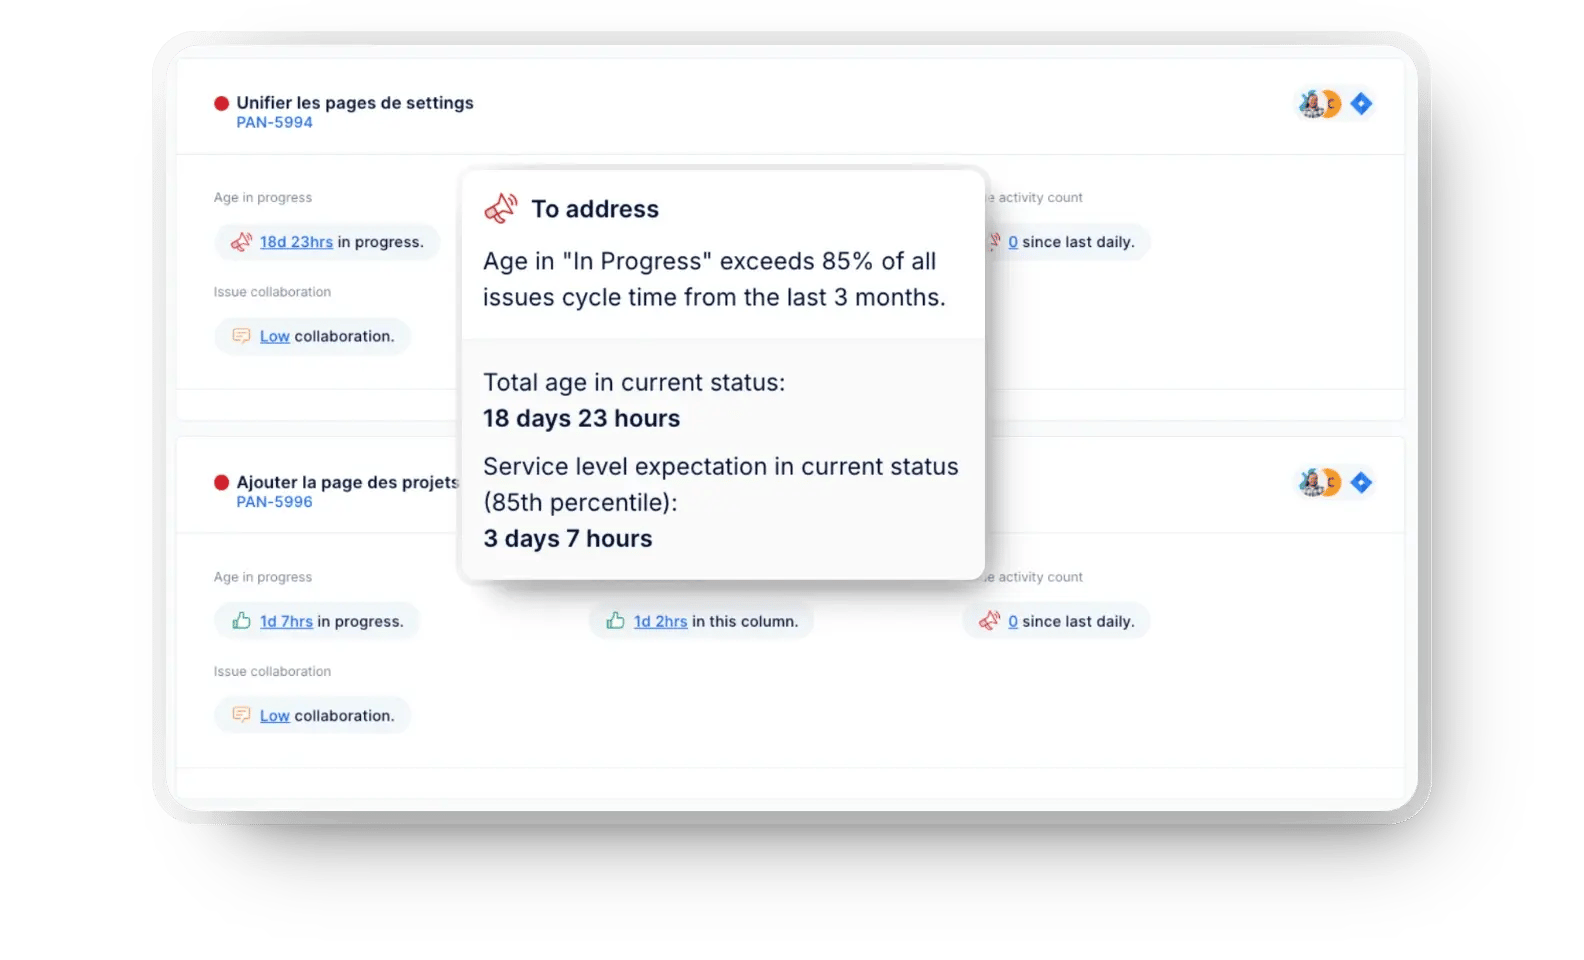
Work item age tracks how long a task or feature has been in progress from the moment work began. This metric is crucial for identifying tasks that are stuck or moving too slowly.
For instance, if a feature has been in progress for three weeks while others take just one, it could indicate unclear requirements or resource conflicts. Monitoring work item age helps you prioritize tasks that are at risk of falling behind.
This ensures they’re completed within a reasonable time frame. It also helps you maintain predictability in your software delivery process, which improves customer satisfaction.
Team satisfaction measures how happy your team members feel about their work environment, processes, and overall morale.
The point is to build that welcoming, productive environment in the first place. And according to a Dale Carnegie study, 84% of people on high-performing teams were highly satisfied with their freedom to express opinions, and 70% felt comfortable sharing emotions at work.
![]()
On the other hand, if your team reports low satisfaction, it might be time to revisit workflows, improve communication, or reduce unnecessary stress. Satisfied teams are more collaborative and productive. This leads to better outcomes for your software development projects and higher user satisfaction.
To get the most out of software engineering metrics, you need to focus on how they help you improve performance, not just track numbers. Here are five actionable steps to turn metrics into meaningful changes for your team.
You can start by identifying bottlenecks that slow down your software development process. For example, if code reviews consistently take too long, you can redistribute workloads or set clearer review standards.
Focusing on the right problems first ensures your efforts make a real impact.
Avoid relying on vanity metrics such as lines of code or completed tickets. Instead, focus on metrics directly affecting outcomes, like customer satisfaction, team efficiency, and code quality. For example, tracking cycle time instead of story points gives you actionable data to reduce delivery delays and improve user experience.
You should use metrics during retrospectives or sprint planning to uncover patterns and guide discussions. For instance, if the age of a work item increases, your team can brainstorm ways to resolve stuck tasks faster. Integrating metrics into your rituals ensures they become tools for learning and improvement.
A single spike in a metric might not mean much, but consistent trends typically reveal deeper issues. For example, a steady rise in defect density might signal declining code quality over time. Monitoring trends helps you stay proactive instead of reacting only when problems become critical.
Share metrics transparently with your team so they can take ownership of their workflows. Research from the Journal of Management shows that trust in self-managing teams can reduce the need for excessive monitoring – which saves you more resources in the long run.
However, balancing autonomy with oversight is key to keeping team performance high. Metrics should empower your team, not feel like micromanagement.
Measuring software engineering metrics can improve performance, but it’s not always simple. You might face obstacles that make tracking and using these metrics harder than expected. Understanding these challenges helps you address them effectively and get the most out of your data.
Here are some common challenges:
The right tools help you track metrics effectively and turn them into actionable insights. Here are some options to consider:
Software engineering metrics are essential for improving team performance, ensuring quality, and aligning your work with business goals. When you focus on the right metrics, you can identify bottlenecks, track progress, and deliver better results for your team and users. The main goal should be to track what matters.
Axify simplifies how you measure and improve your workflows using real-time dashboards and detailed insights.
Are you ready to empower your team with meaningful data? Book a demo today and see how Axify can transform your engineering processes.
