Delivery Performance
18 minutes reading time

You've probably been told that measuring lines of code or tracking completed tickets is a good way to understand your software development team's progress. But those numbers can hide problems. Your team might close more tickets while delays in pull request reviews keep finished work from reaching users. And with AI coding tools in the mix, output can rise faster than delivery: in a 2026 Linux Foundation survey, 64% of maintainers on large open source projects said AI-assisted contributions increased review times.
So, how do you measure developer productivity without overlooking quality or developer experience?
This guide covers three frameworks, DORA, Core 4, and the SPACE framework, alongside a full library of 27 metrics organized by what each one actually measures. You'll learn which metrics help you spot slow handoffs, track production failures, and check whether AI-assisted coding helps your team deliver sooner.
We also discuss:
Let's get started!
Software engineering metrics are measures of how quickly your team delivers changes, how reliably your software runs, and how developers experience their day-to-day work.
They cover productivity, quality, and performance across the software development lifecycle: how efficiently your team delivers high-quality code to production, how frequently failures occur, and how quickly issues are resolved.
When used correctly, they help your engineering teams align their work with business goals while improving product quality and user satisfaction. For the business-level view of the same data, see our guide to software development KPIs.
Pro tip: A handful of metrics from one shared data source beats a long list pulled from different tools. That's why we prefer a single engineering metrics dashboard that everyone on the team reads the same way.
You track software engineering metrics to identify bottlenecks, improve team performance, ensure quality, and align your work with business objectives. These metrics give you a clear picture of how well your teams are delivering and where potential issues, such as high defect density or delays in cycle time, may arise.
Monitoring progress lets you make better decisions about where to invest, avoid unintended consequences, and focus on delivering software that meets user expectations and business goals.
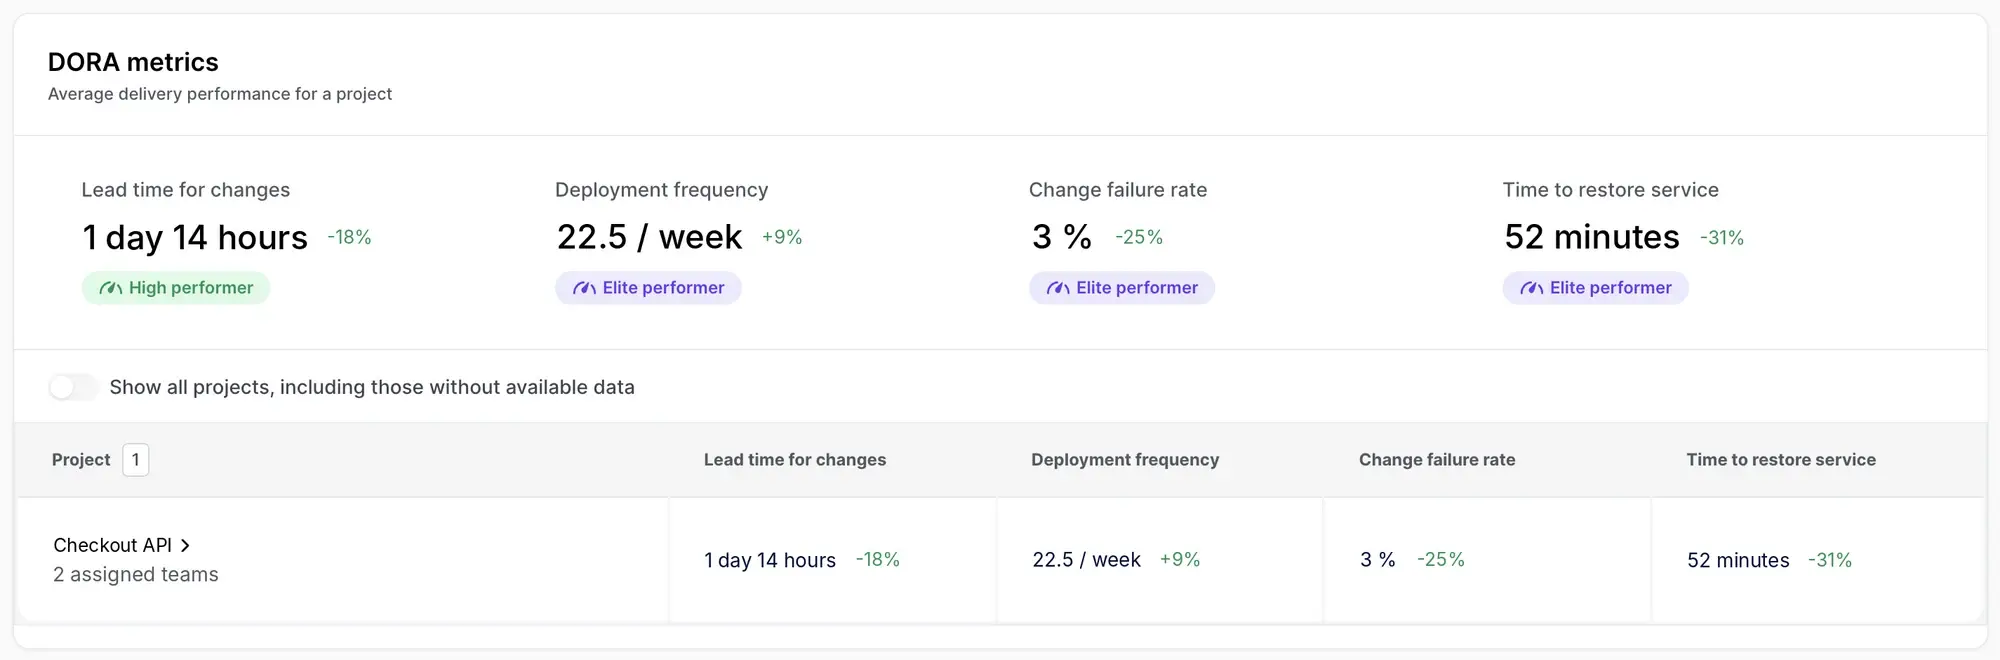
Those are the principles we built Axify on. Engineering leaders need a way to turn engineering metrics into insights that affect business performance, and today that also means checking whether AI-assisted coding actually speeds up delivery. Axify connects DORA metrics, value stream mapping, and AI usage, impact, and cost in one view:
DORA, SPACE, and Core 4 provide three approaches to measuring software engineering work. They cover delivery performance, developer experience, and how teams spend their time.
The right starting point depends on what you need to understand. Slow releases, constant interruptions, and too much time spent fixing bugs each call for different measures.
| Framework | Created by | What it measures | Best for |
|---|---|---|---|
| DORA | DORA researchers, including Nicole Forsgren, Jez Humble, and Gene Kim | Software delivery throughput and instability, including deployment speed, failures, and recovery | Checking whether changes to deployment processes help teams release faster and with fewer failures |
| SPACE | Researchers from GitHub, Microsoft, and the University of Victoria | Satisfaction and well-being, performance, activity, communication and collaboration, and efficiency and flow | Understanding how interruptions, collaboration, and working conditions affect productivity |
| Core 4 | DX, with researchers and contributors to SPACE and DevEx | Speed, effectiveness, quality, and impact, including the share of work spent on new capabilities | Choosing a focused set of measures that balances delivery pace, developer friction, defects, and feature development |
These frameworks overlap, so you can use them together as your measurement needs grow.
DORA stands for DevOps Research and Assessment, and the DORA framework uses five metrics to assess software delivery performance: deployment frequency, lead time for changes, failed deployment recovery time, change failure rate, and deployment rework rate.
Together, they help you check whether faster releases come with more production failures or additional corrective deployments.
The SPACE framework approaches productivity measurement through five dimensions, covering how developers feel, what they achieve, their activity, collaboration, and flow.
It combines quantitative metrics with developers' reported experiences. This way, you can investigate situations where ticket counts look healthy, but the team reports constant interruptions or difficulty getting help.
Core 4 is the framework from DX (now part of Atlassian) for measuring speed, effectiveness, quality, and impact. It draws on DORA, SPACE, and DevEx.
It pairs metrics such as PR throughput with developer feedback, defect measures, and the proportion of work devoted to new capabilities. That gives you a way to check whether increased output also leaves your team enough time for planned software development.
Axify draws on multiple frameworks. It combines DORA metrics with value stream mapping and AI metrics so you can investigate delivery delays alongside the conditions contributing to them.
People metrics track team morale, satisfaction, and collaboration. They relate to the SPACE dimensions of satisfaction and communication discussed above, while process metrics focus on workflows, delivery times, and software quality. Together, they help you assess delivery reliability and how your team experiences the work.
Not all metrics help you improve. Some can mislead you into thinking your team is performing well when it's not.
Tracking the wrong numbers can waste time, lower team morale, and even harm the quality of your software. Let's look at two kinds of metrics to handle with care: misleading metrics and counter metrics.
Some metrics seem useful but fail to capture real value. For example, tracking lines of code might make you think more code equals better productivity, but it doesn't measure code quality or usefulness. The same goes for AI-era vanity metrics such as raw token counts or AI-generated line counts.
Similarly, relying on user story points or completed tickets can encourage teams to focus on speed over meaningful progress, leaving quality issues unresolved. These metrics might initially make your executive team happy, but they fail to provide actionable insights about performance or user satisfaction.
Shift your focus to metrics such as flow efficiency or lead time, which highlight outcomes instead of raw outputs.
"Focusing on outcomes ensures that the team's efforts are aligned with the needs of the customers and the goals of the business. It encourages the team to think beyond simply completing tasks and to consider how their work can create value. When the goal is defined in terms of desired results (outcomes) rather than specific tasks (outputs), it allows for multiple paths to success."
— Addy Osmani, Senior Staff Engineering Manager at Google Chrome, Focus on outcomes over outputs
Side note: In routine maintenance work, you can still prioritize outputs, because the focus is on solving specific tasks and there's little room for innovation.
Counter metrics act as guardrails against metric over-optimization. For example, while deployment frequency is critical for delivery speed, it needs to be balanced by change failure rate to avoid rushing poor-quality deployments.
Another example is tracking code churn alongside code quality to spot when rapid iterations create more problems than solutions.
Axify insight: Focus on flow metrics that reflect customer experience and long-term success so your team works smarter, not harder.
These 27 metrics help you see where work slows down and what causes production problems. Each entry explains what the metric measures and gives an example of how to use it. Here's how the categories map to the questions you're trying to answer:
| Category | Question it answers | Metrics |
|---|---|---|
| Speed (productivity) | How fast does work reach production? | Deployment frequency, lead time for changes, cycle time, throughput |
| Flow (productivity) | Where does work wait? | WIP, work item age, time spent in review, PR merge rate |
| Reliability | How often do changes break, and how fast do we recover? | Change failure rate, failed deployment recovery time, deployment rework rate, defect density, MTBF, MTTF, availability |
| Quality | Will the code stay easy to change? | Test coverage, code churn, refactor ratio |
| People and experience | What working conditions sit behind the numbers? | Team satisfaction, DevEx dimensions, eNPS, developer friction, onboarding speed, burnout and task balance |
| AI | Is AI use turning into faster, better delivery, and at what cost? | AI adoption and usage, AI impact on delivery, AI cost and net time saved |
Software engineering productivity metrics show how quickly work moves through your delivery process, where it waits, and how much your team finishes within a given period. They measure the system, not individual developers.
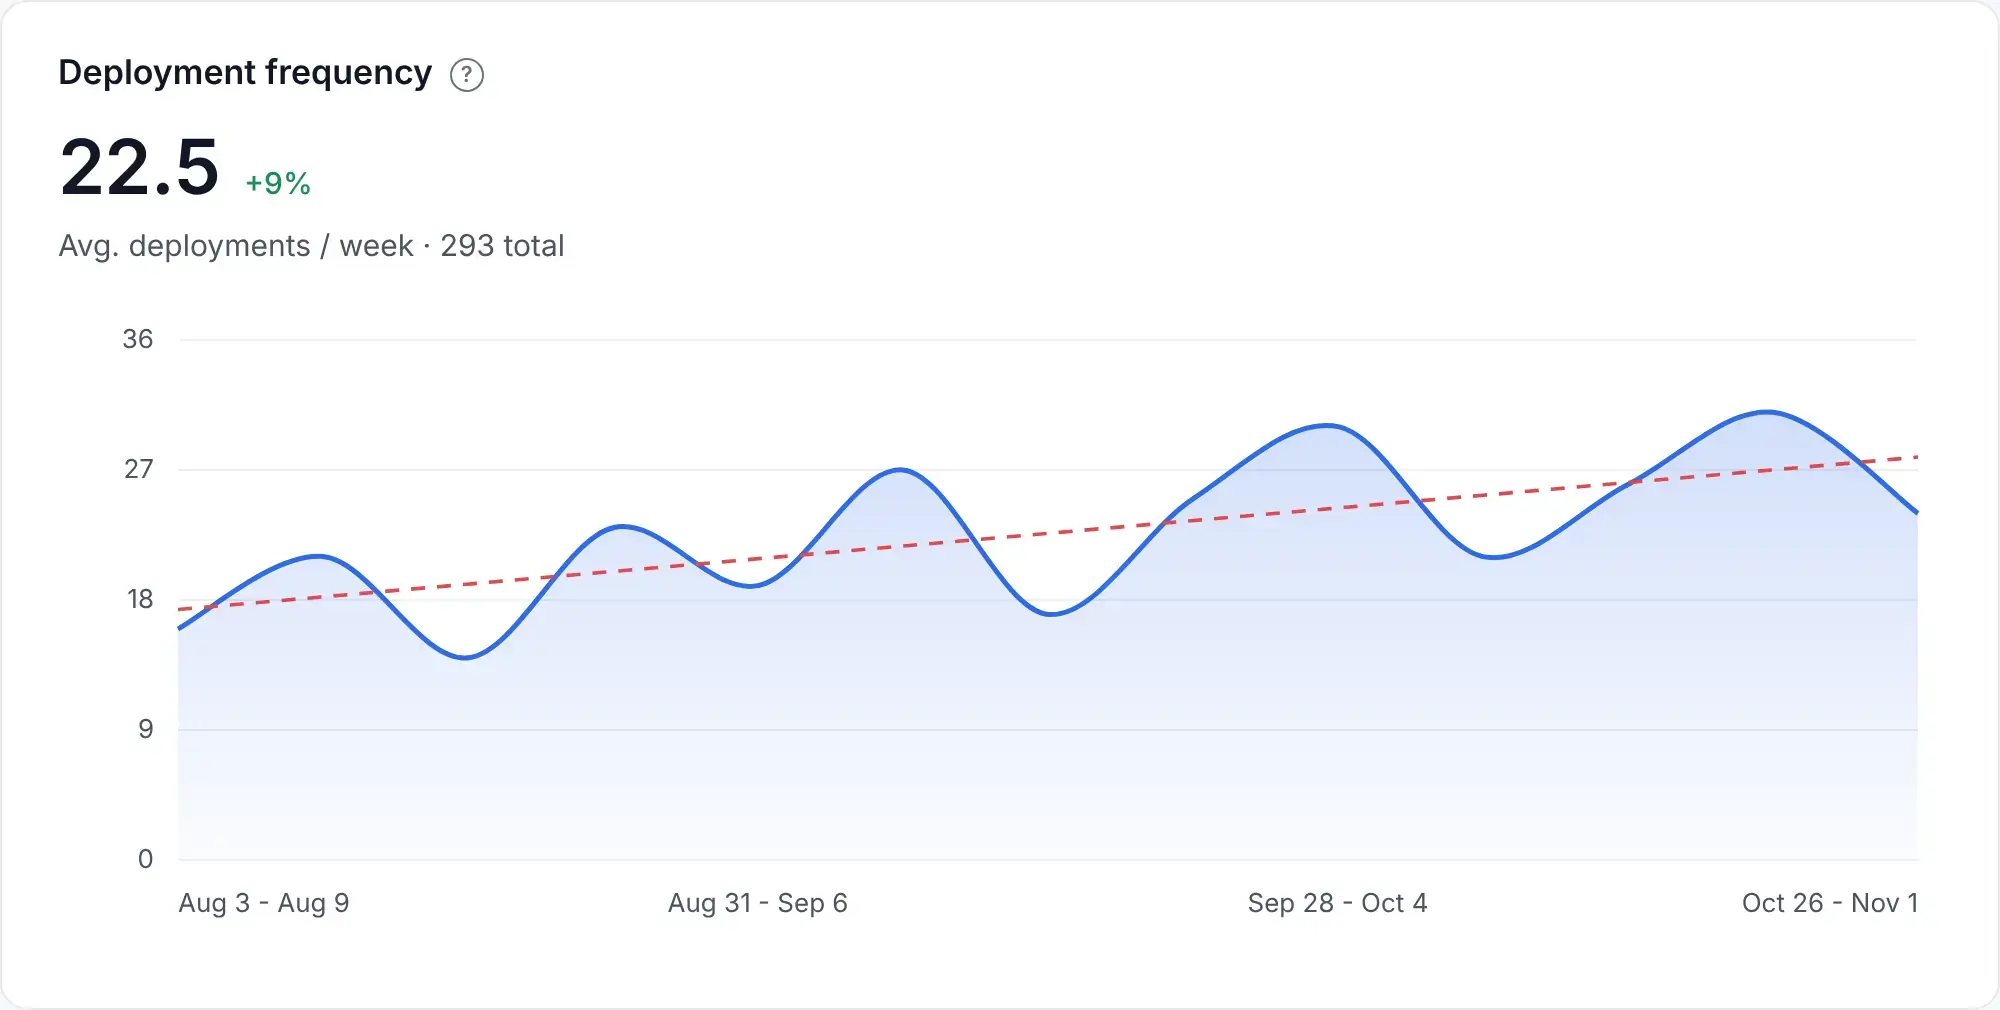
Deployment frequency shows how often you deploy code to production. In the 2025 DORA report, 16.2% of respondents reported on-demand deployments, while 31.5% deployed between once per week and once per month.
Still, you need some context around this metric. More deployments could reflect smaller releases, but they could also include repeated fixes for production problems.
For example, if your team deploys weekly but faces quality issues, smaller, more frequent deployments may help. Smaller changes are easier to review and test, and there's less code to investigate when something breaks.
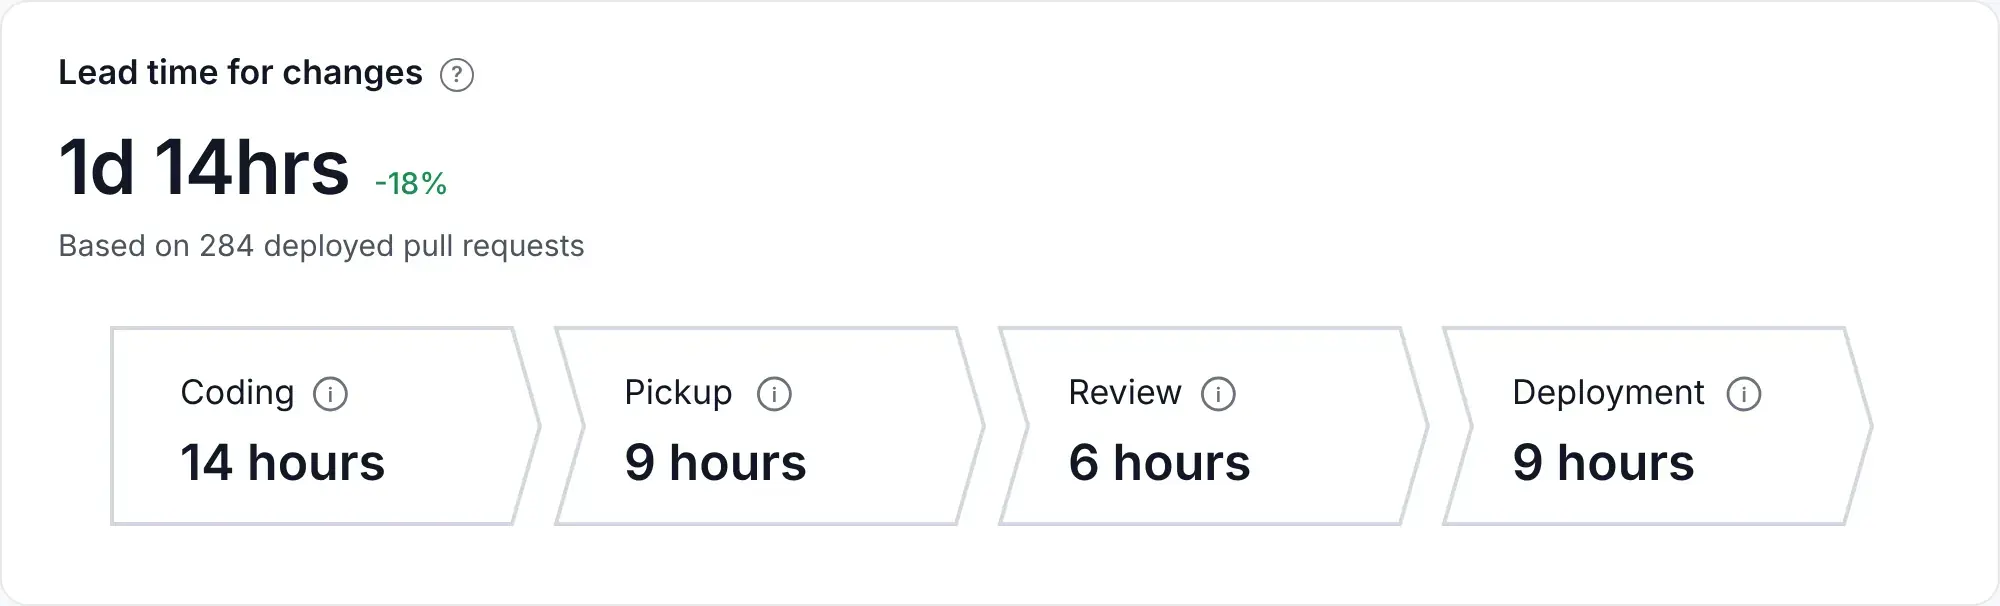
Lead time for changes measures the time between a change's first commit and when it is successfully running in production. It includes any further coding, review, testing, waiting, and deployment time after that first commit.
In the 2025 DORA report, 31.9% of respondents reported lead times between one day and one week, while 28.3% reported between one week and one month.
Let's say it takes your team three weeks to move a change into production. In this case, you may have bottlenecks in your code review process or testing stages. A breakdown of time spent in those stages helps you identify which phase needs attention before you ask developers to code faster.
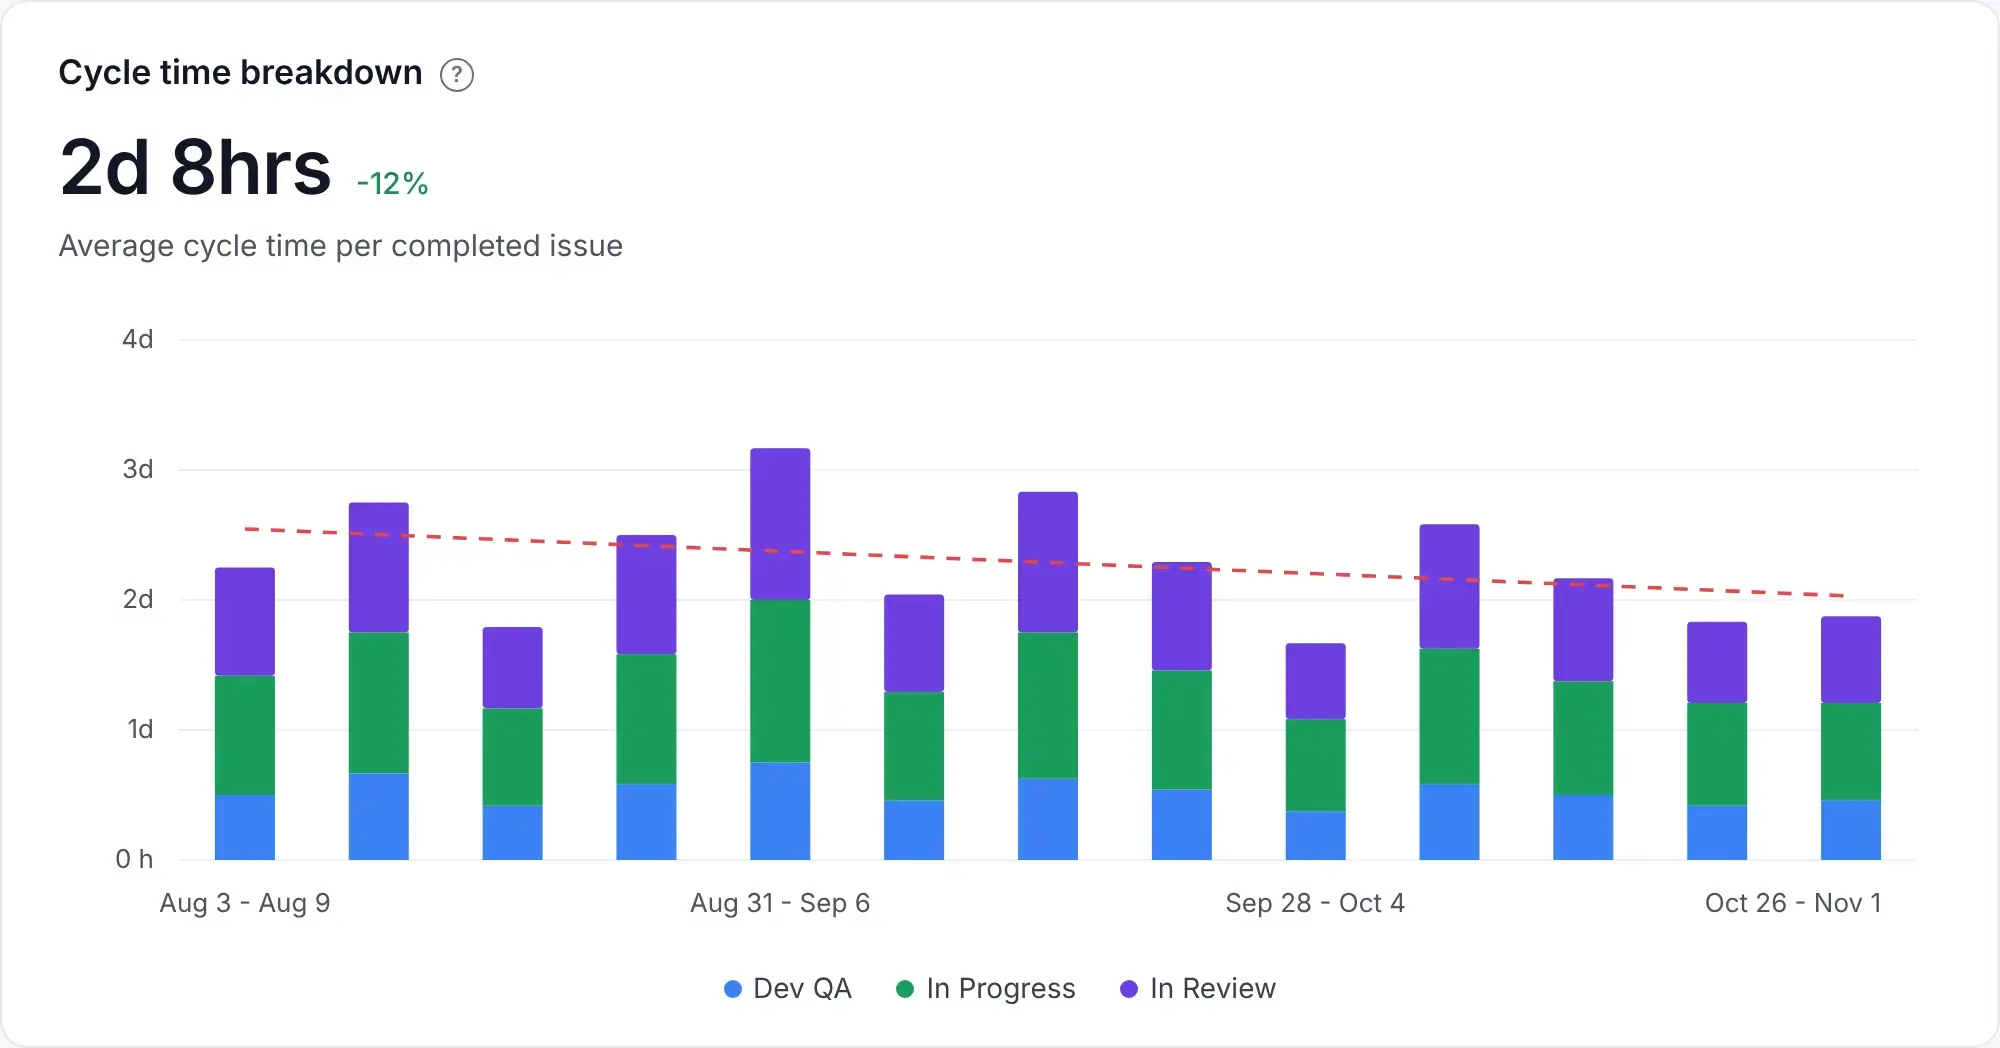
Cycle time in software development measures how long it takes to move a task from the start of active work to completion. Your team needs a consistent finish point. For delivery measurement, that can be when the change reaches production, so the measurement includes waiting time as well as active work.
If a small feature now takes 10 days to deliver whereas your usual cycle time is 5 days, check how those days are distributed. Two days of coding followed by 8 days of reviews, testing, and release approvals calls for a different fix than ten days of active development.
This also matters with AI-assisted coding. Faster code generation may barely reduce cycle time if it increases review and deployment queues.
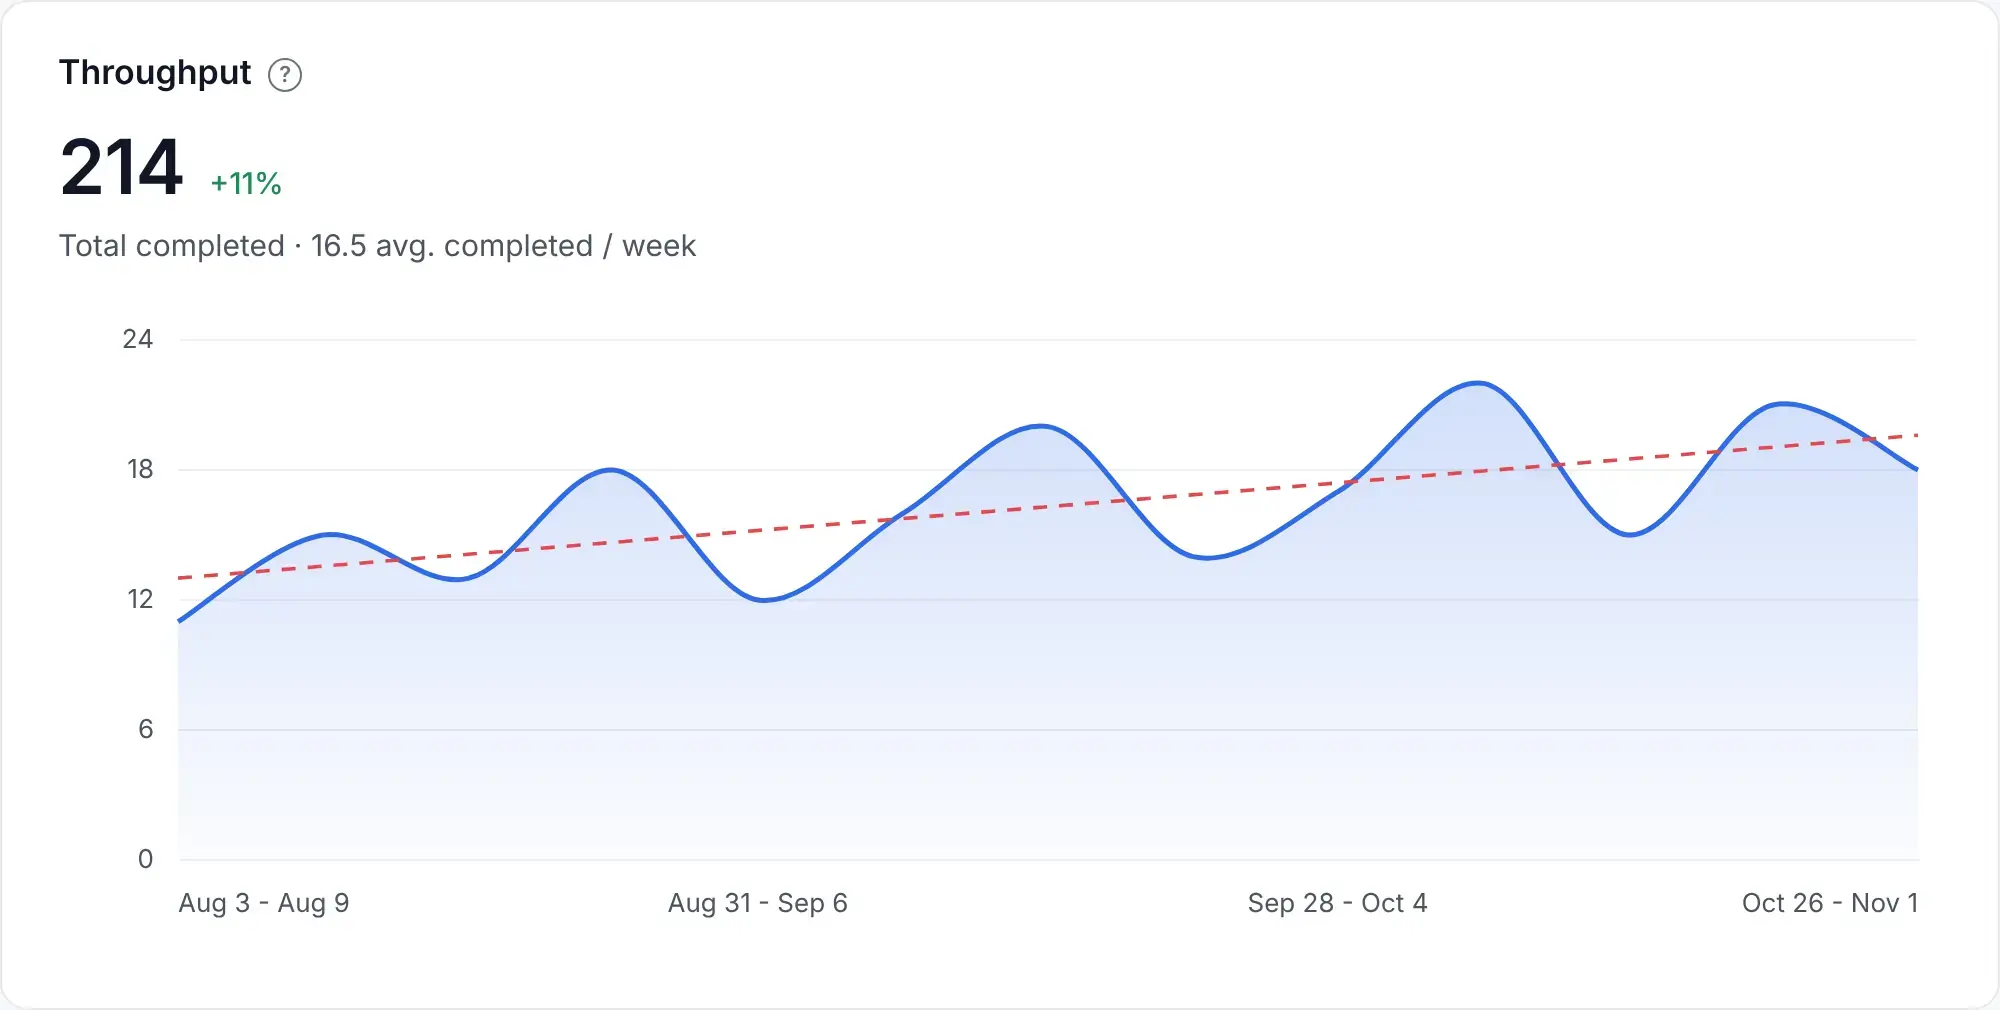
Throughput measures the total number of tasks, features, or bug fixes your team completes within a set period, such as a sprint or week.
Now, imagine your team consistently completes 20 tasks per sprint but suddenly drops to 10. This pattern could signal a bottleneck or a change in the size of the work. Your team may have moved from small fixes to a larger integration.
The reverse pattern needs context as well. AI may help developers finish their work faster, but testing or review queues can still limit team throughput. The 2025 DORA report describes AI as an amplifier of existing strengths and weaknesses. Small changes, automated tests, and prompt reviews help teams carry those gains through delivery; slow feedback and manual handoffs can absorb them.
DORA's 2026 ROI of AI-assisted Software Development report explains why those gains can stall at first: it describes a J-curve, a temporary productivity dip while teams learn the tools and pay a "verification tax" reviewing generated code.
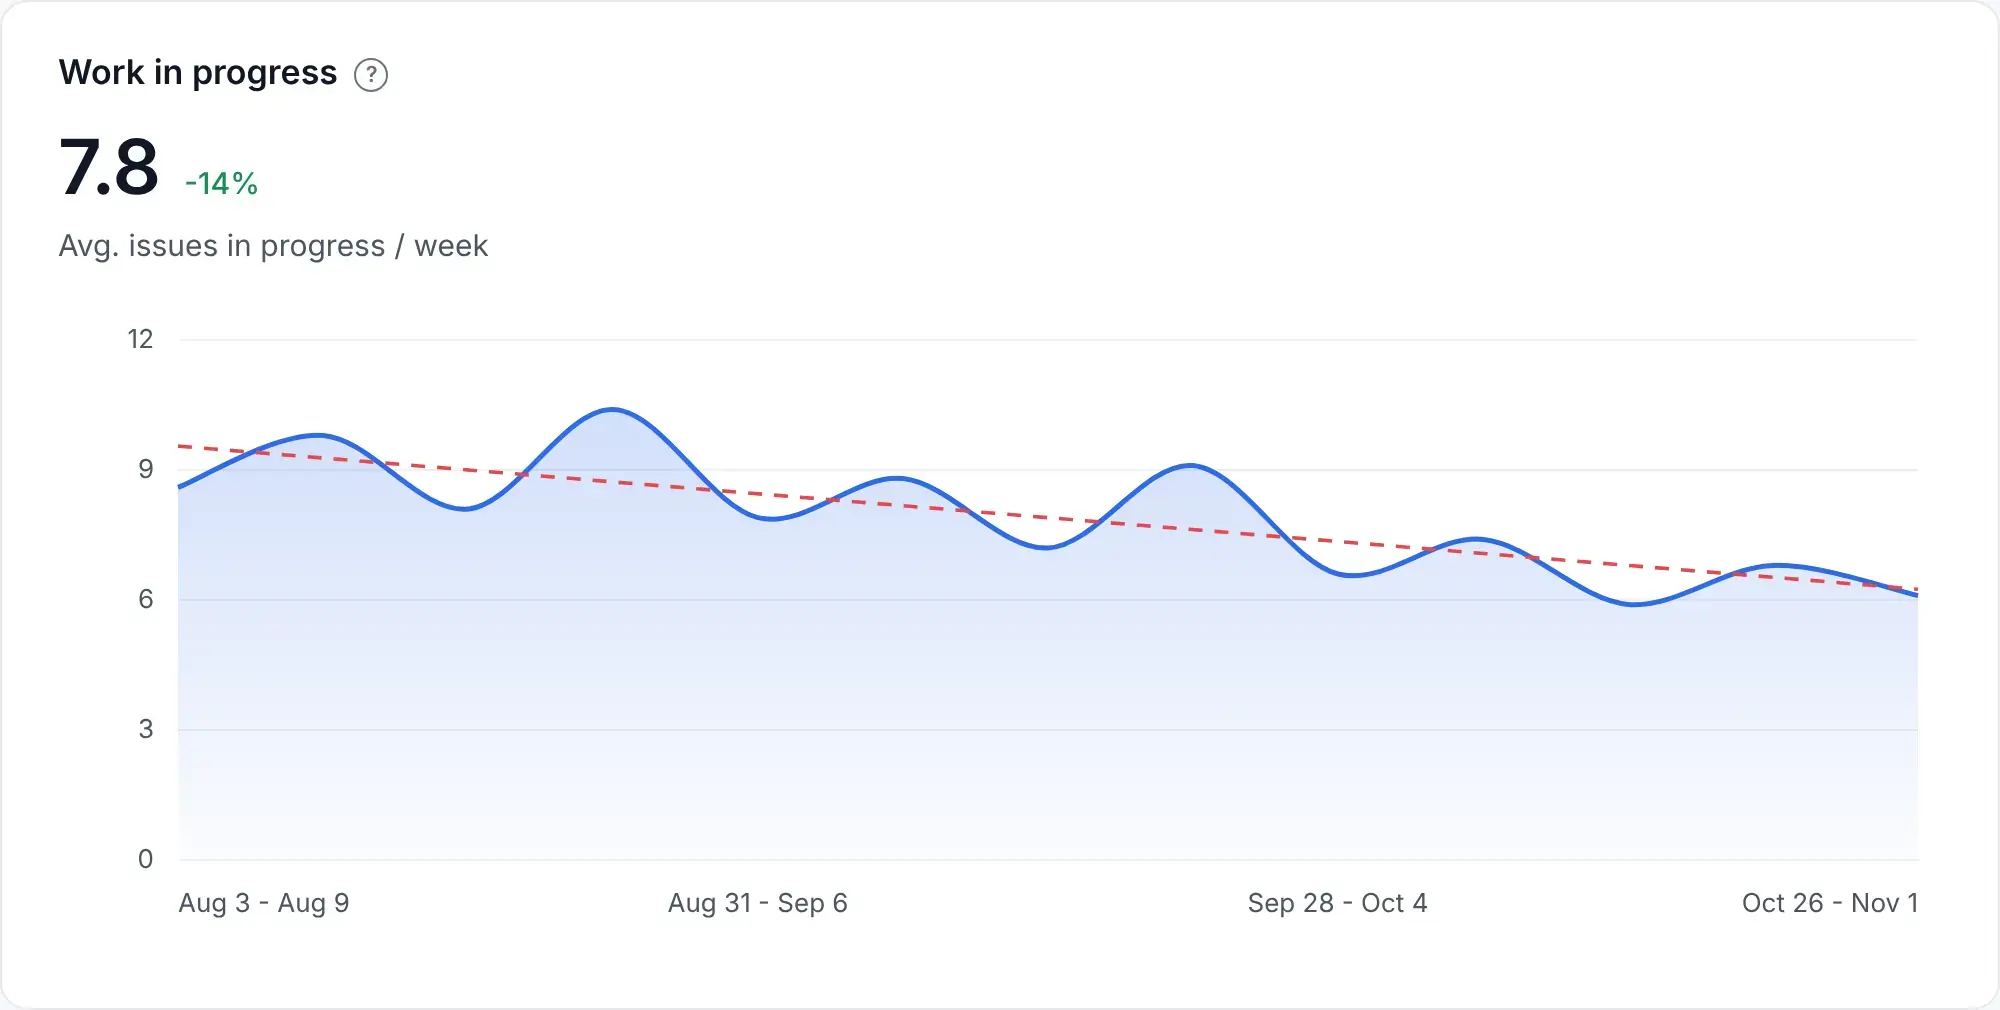
Flow metrics help you understand how work moves, where it waits, and whether your team starts more work than it can finish.
WIP tracks the number of tasks your team has started but has not yet finished. That includes blocked tasks, since they still need attention before completion.
Too much WIP can lead to context-switching, longer delivery times, and reduced team productivity.
Let's say your team has 10 active tasks and keeps starting new ones while older tasks remain blocked. In this scenario, check how excess WIP slows flow efficiency. A WIP limit can help the team finish existing work and resolve blockers before taking on more.
Work item age tracks how long a task or feature has been in progress since work began. It helps you identify unfinished tasks that may need attention.
For instance, if a feature has been in progress for three weeks while similar items usually take one, it could indicate unclear requirements, a dependency, or repeated review cycles.
You can then check what is holding it up and who can resolve the issue. Unlike cycle time, which describes completed work, work item age gives you a chance to intervene while the task is still open.
This metric measures how long code stays in the code review process before it is merged. It helps to separate the wait for a first response, the review itself, and the wait after approval.
In the Linux Foundation's 2026 survey of open source contributors and maintainers, 64% of maintainers on large projects (more than 50 contributors) reported that AI-assisted contributions increased review times. The finding is particularly relevant to teams that handle a high volume of contributions.
For example, if reviews take 10 days, you could investigate delays in pull request reviews before changing the process. Reviewers may be overloaded, or approved changes may sit idle because nobody owns the merge.

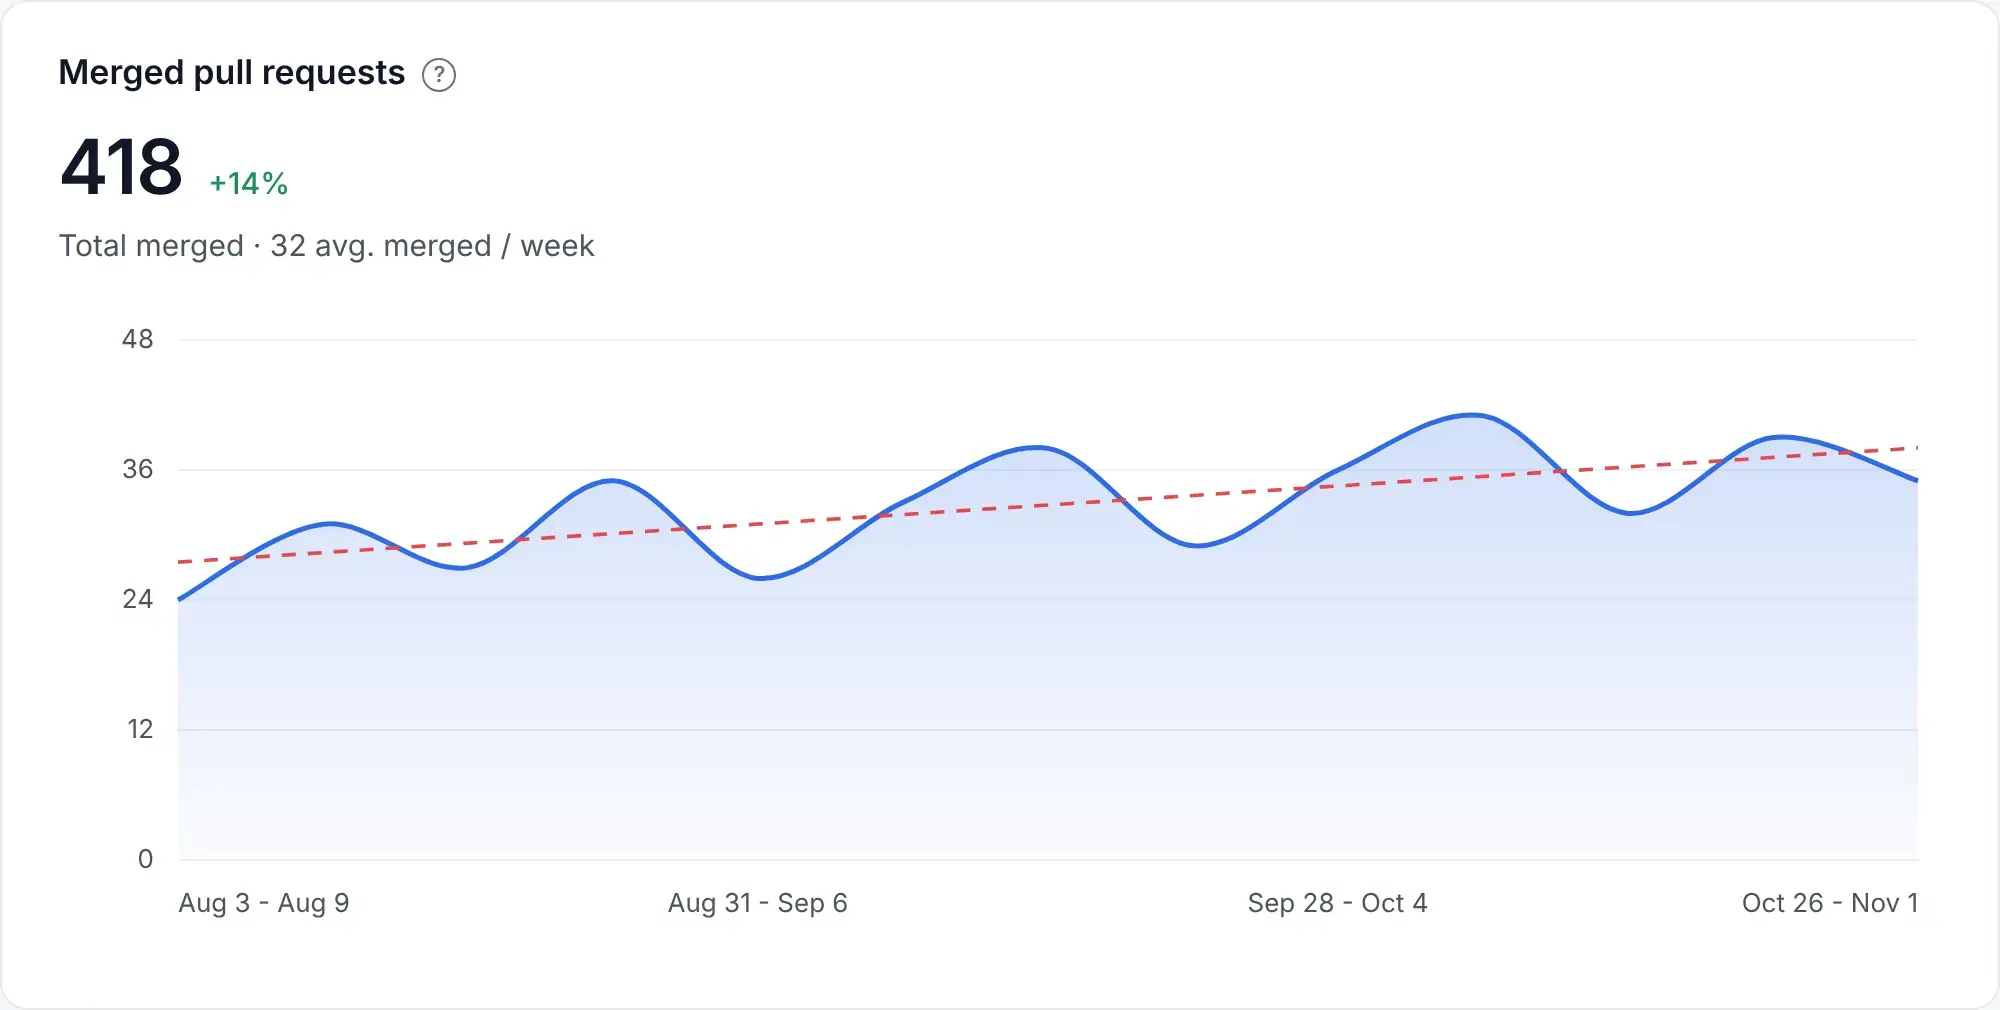
Pull request merge rate measures the percentage of opened PRs that have been merged. You need a consistent group of PRs and a cutoff date so comparisons remain meaningful.
So, if 60 of the 100 PRs opened last month have merged, the rate is 60% at that cutoff. The remaining PRs need context. Some may be blocked, while others were deliberately closed after requirements changed.
AI can increase the number of proposed changes, so review capacity matters here as well. A falling merge rate alongside longer review times may indicate that proposals are arriving faster than the team can evaluate them.
Reliability metrics in software engineering show how often changes cause problems, how long recovery takes, and whether your service remains available to users.
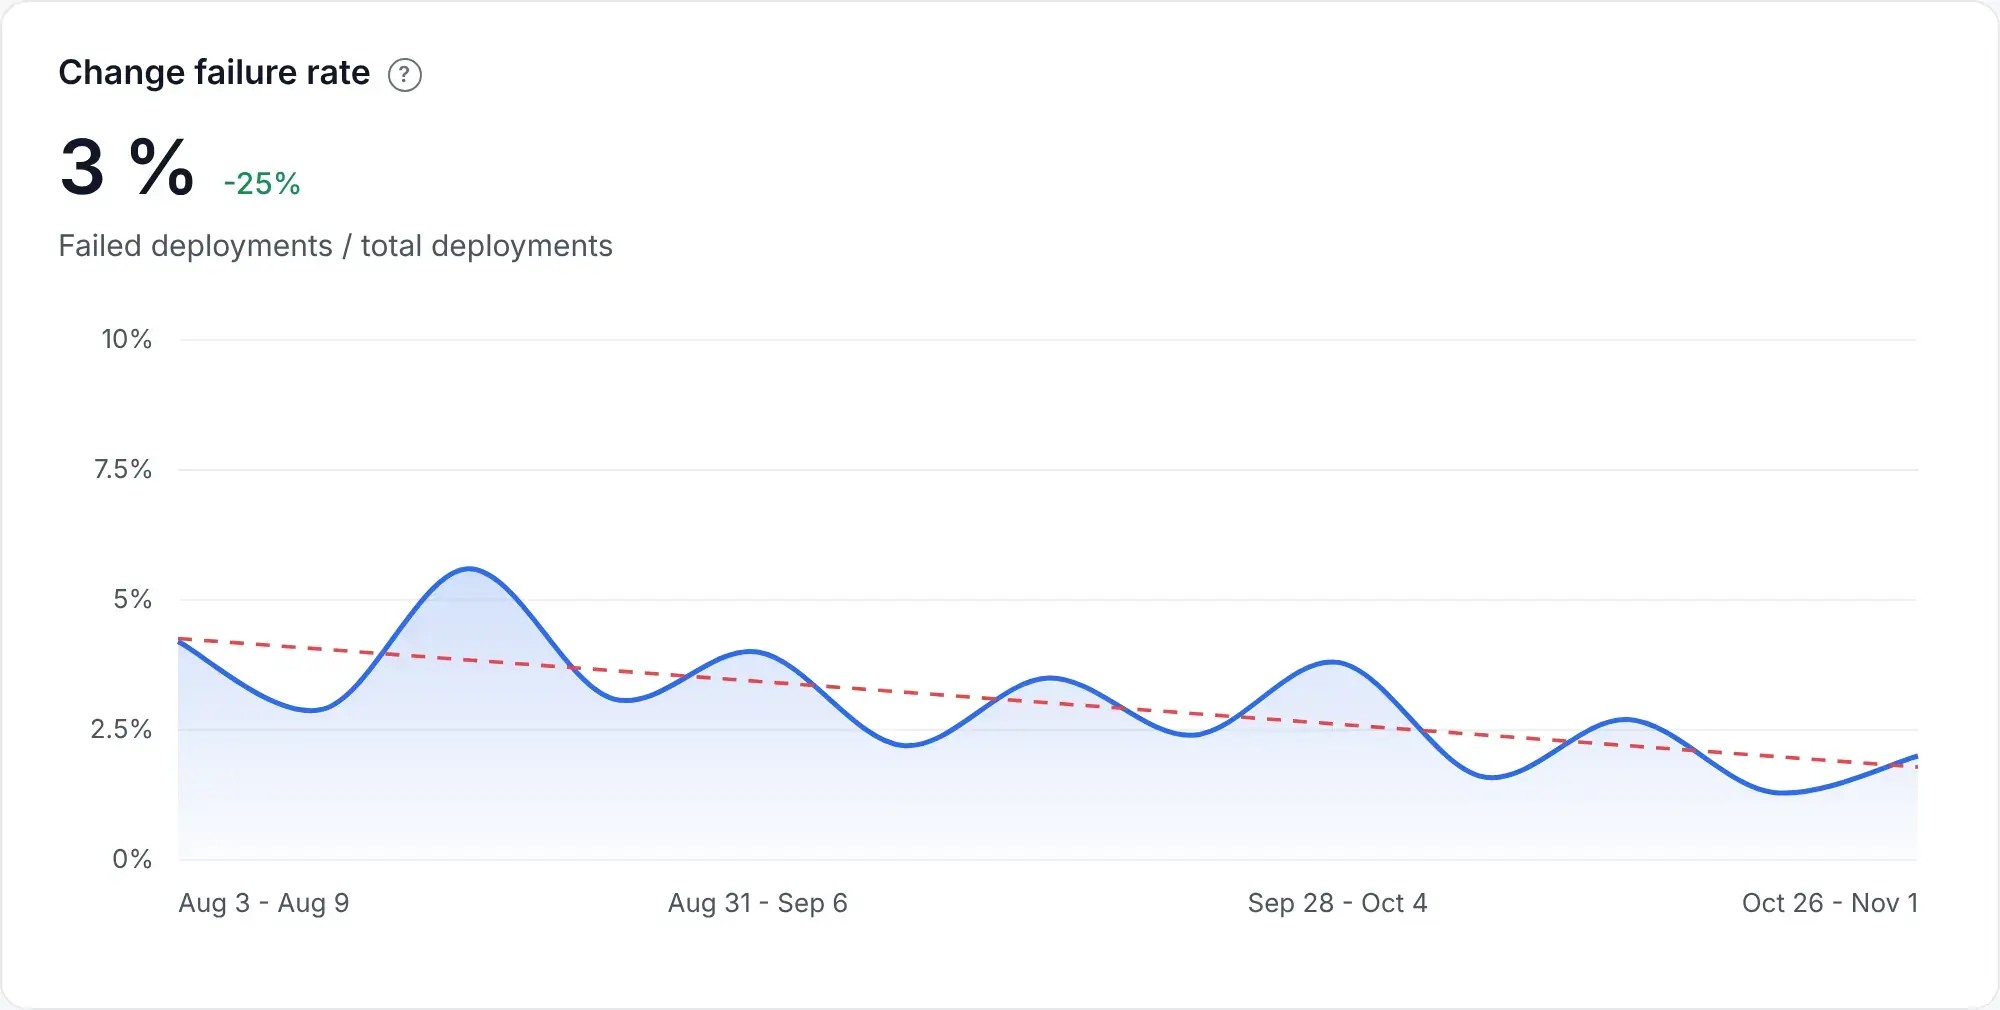
Change failure rate tracks the percentage of production deployments that cause degraded service and require intervention, such as a hotfix or rollback.
In the 2025 DORA report, 26% of respondents reported change failure rates between 8% and 16%. That describes the survey sample rather than a target every team should adopt.
For instance, if four of your last 20 deployments required immediate fixes, your change failure rate is 20%. You can then review those failures for recurring causes, such as missing integration tests, configuration mistakes, or changes that were too large to review properly.
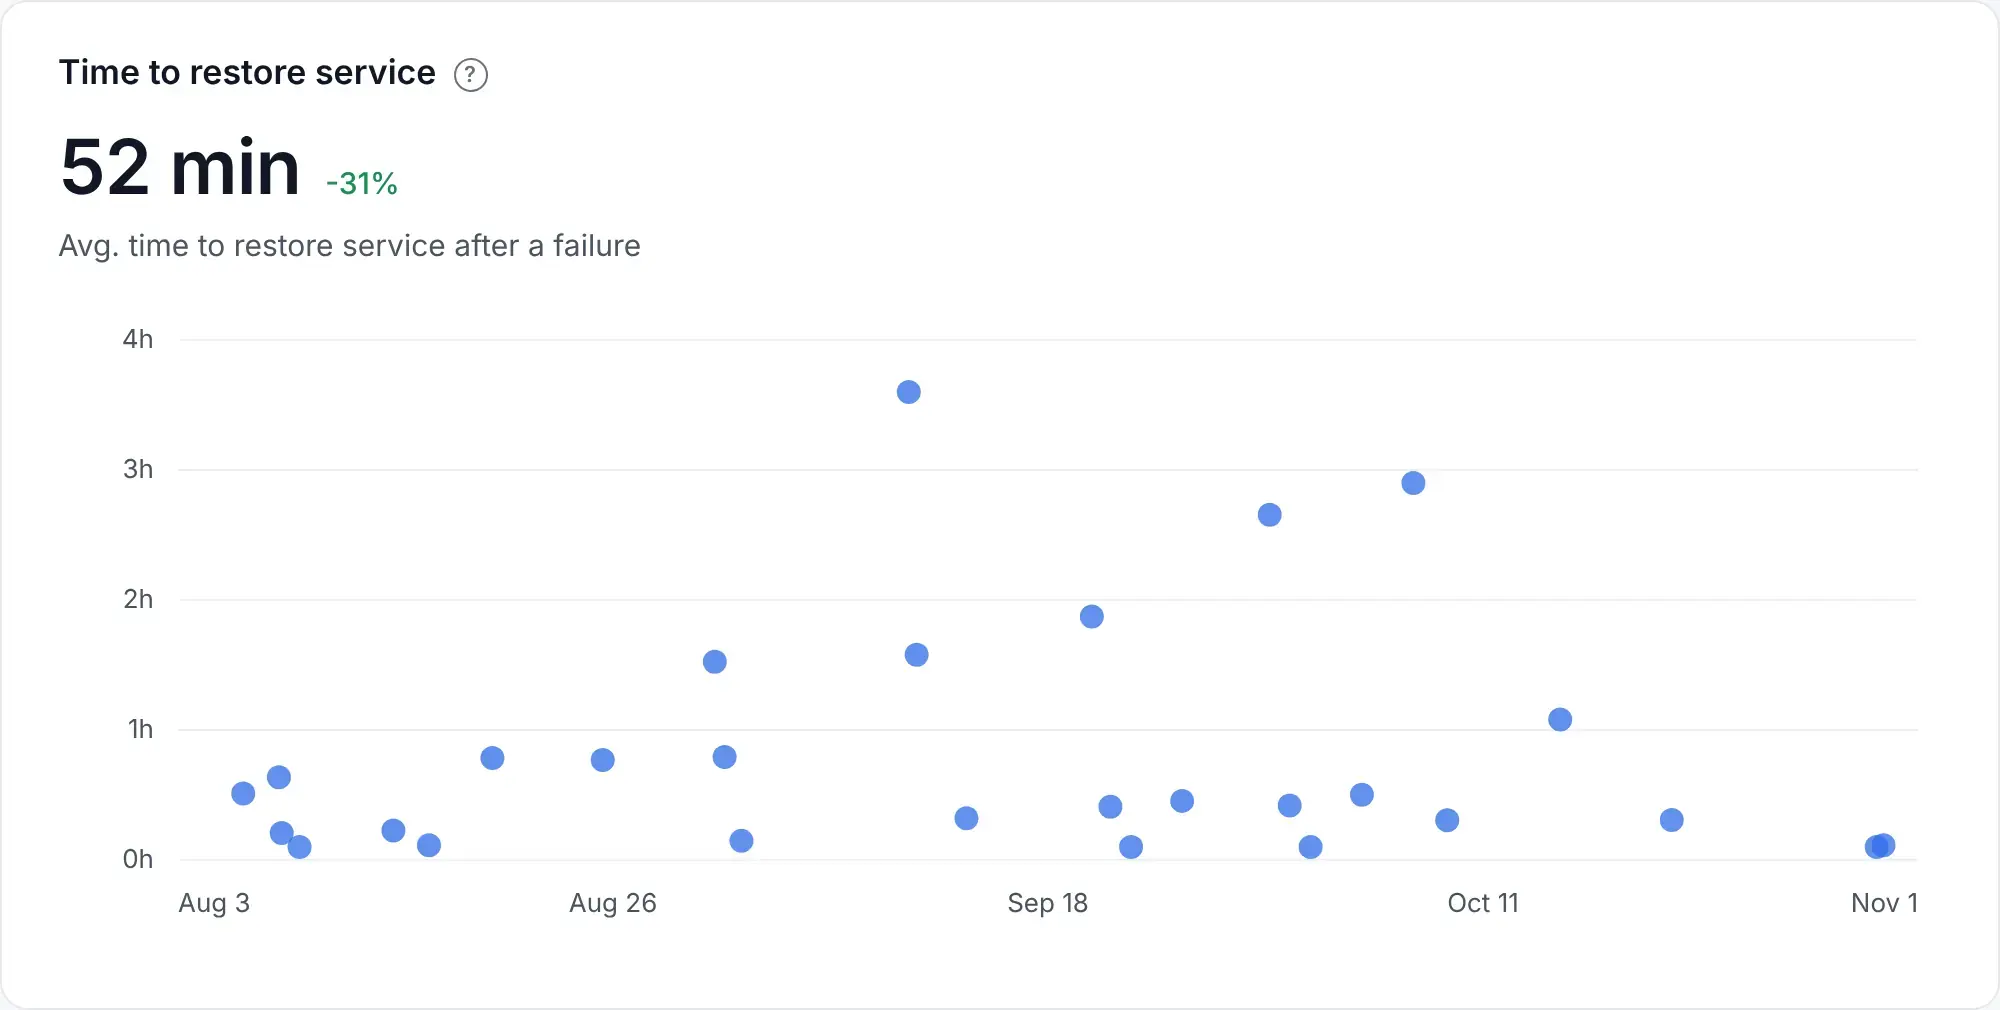
Failed deployment recovery time measures how long your team takes to restore service after a production deployment causes a failure. It replaced the broader recovery measure commonly called MTTR within DORA, so the scope is specifically deployment-related incidents.
In the 2025 DORA report, 21.3% of respondents reported recovery in less than one hour.
So, if a deployment breaks checkout at 10 a.m. and service returns at 11 a.m., recovery took one hour. If most of that time passed before the right engineer received an alert, better alert routing may help more than changes to the rollback procedure.
Side note: Although we've grouped it here with reliability measures, DORA classifies recovery time under throughput.
Deployment rework rate is DORA's fifth delivery metric. It measures the percentage of deployments that were unplanned and happened because a production incident or user-facing bug needed attention.
So, if eight of your 50 deployments were unplanned corrective releases, your deployment rework rate is 16%. Change failure rate counts deployments that cause problems, while rework rate counts the additional deployments needed to address them.
In the 2025 DORA report, 26.1% of respondents reported rework rates between 8% and 16%. If your rate rises after AI adoption, check whether additional coding output has increased the amount of corrective work.
Defect density measures the number of confirmed defects per unit of code, such as per 1,000 lines of code. It helps you identify parts of your software that need closer investigation.
As such, a module with 10 defects across 5,000 lines of code has a defect density of two defects per 1,000 lines. Repeated problems in that module may justify clearer interfaces, additional tests, or work to reduce code complexity.
This metric is most useful when you compare similar components with consistent testing practices. More thorough testing can increase the number of defects found, while AI-generated code can increase the denominator without improving quality.
MTBF measures the average operating time between failures in a system that can be repaired and returned to service. It helps you track how often users encounter service interruptions.
As an example, if a service records 1,200 operating hours and three failures, its observed MTBF is 400 hours. If that figure falls over several reporting periods, you can investigate recurring defects, overloaded components, or unreliable dependencies.
A higher MTBF means failures occur less frequently. You still need recovery time and availability to understand how much disruption those failures cause.
MTTF measures the average time until a component fails. It is commonly used for components that are replaced after failure, or for the first failure of a repairable system.
Let's suppose three fresh instances of a service fail after 20, 25, and 30 hours under the same controlled load. Their average time to first failure is 25 hours.
The conditions matter here. A result from a load test should be labeled as such, and planned shutdowns should be excluded from failure counts.
Availability measures how consistently users can access a working service. You can calculate it as the percentage of time the service is operational or, for request-based services, the percentage of valid requests that succeed. Google's SRE guidance uses request success rates to account for partial failures in distributed systems.
Let's say your API successfully handles 999,000 of one million valid requests. In this case, its request-based availability is 99.9%.
You should also check critical user journeys separately. An overall average can hide a checkout failure if most other requests still succeed.
Quality metrics help you assess test coverage, repeated code changes, and the effort your team spends making existing code easier to maintain.
Test coverage measures how much of your codebase your automated tests exercise. A specific percentage, whether 80% or 100%, needs context because coverage alone cannot tell you whether the tests would catch a meaningful failure.
For example, your checkout code may have high coverage while the tests miss duplicate payments or failed refunds. Tests that check those behaviors provide more confidence than tests that simply execute each line.
A study presented at ESEM 2025 examined 30 Java classes across six open-source projects. It found code that tests executed without checking whether it behaved correctly.
Because of that, higher coverage can help identify gaps, but your team should review the assertions and failure scenarios. Otherwise, the percentage can rise while important defects still reach production.
Code churn tracks how much code is rewritten or deleted within a defined period after it was added. High churn can point to unclear requirements, rushed implementation, or repeated corrections.
As such, if the same authentication code changes several times within two weeks, check whether requirements changed or reviewers found problems with the original approach.
Moderate churn can be healthy during experimentation. With AI-assisted coding, you should also check whether developers repeatedly replace generated code after review or testing. That correction work can absorb the time saved during the first draft.
The refactor ratio compares time spent improving existing code with time spent writing new code. Your team needs a consistent definition of refactoring so routine bug fixes and feature changes don't distort the measure.
A Microsoft study reported several benefits developers had experienced from refactoring. Among respondents:
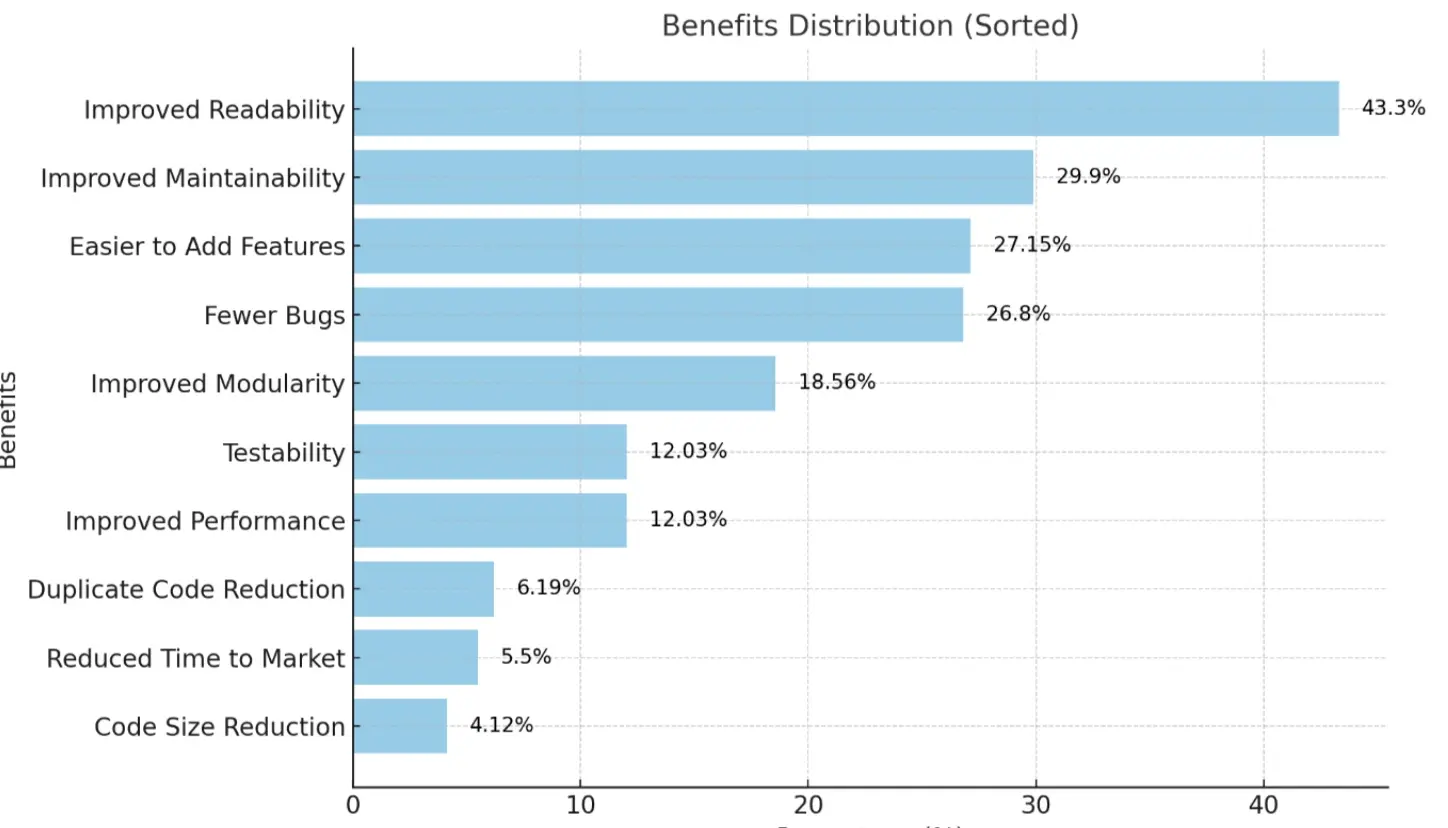
Source: Kim, Zimmermann, and Nagappan, Microsoft Research
These are reported experiences from an older study, rather than targets for your team.
So, if a legacy module repeatedly causes bugs, refactoring may help address the underlying technical debt. The ratio shows how much capacity you devote to that work, while defect trends and review effort help you assess whether it helped.
Productivity metrics in software engineering aren't only about speed. People metrics help you understand the working conditions behind delivery numbers. Survey scores can show a pattern, while written feedback helps explain what needs to change.
Team satisfaction measures how team members feel about their work environment, processes, and overall morale, and it tends to go hand in hand with productivity.
In a Dale Carnegie teamwork study, 84% of people on high-performing teams were very or extremely satisfied with their freedom to express opinions, and 70% felt able to express emotions at work.
Use this to your advantage: if satisfaction drops after several releases, ask about on-call interruptions, review workloads, and deadline pressure. Specific feedback gives you a clearer starting point than the overall score alone.
The DevEx framework groups developer experience into feedback loops, cognitive load, and flow state. These dimensions help you choose what to measure in daily work.
eNPS measures how likely employees are to recommend their organization as a place to work. On a 0-to-10 scale, scores of 9 or 10 count as promoters, while 0 through 6 count as detractors. The score is the percentage of promoters minus the percentage of detractors.
Imagine you have 60% promoters and 20% detractors: this gives an eNPS of 40. A follow-up question about the reason for each rating helps you understand what the score reflects.
Developer friction measures the obstacles that consume time or make routine work harder. These can include slow tools, broken pipelines, missing permissions, and repeated approval requests.
Let's assume your developers report losing 3 hours a week to unstable test environments. You can then compare that feedback with pipeline failures and reruns. After the environment is fixed, the same measures can show whether the problem has eased.
Onboarding speed measures how long a new hire takes to reach agreed milestones, such as a first successful build or the first few meaningful PRs merged.
For example, if new developers regularly wait a week for repository access, the access process is a clear obstacle. You can fix that step and check whether the next hires reach their milestones sooner.
The milestones should reflect comparable roles and tasks. A documentation change and a production integration require different levels of preparation.
Burnout measures capture reported exhaustion and strain. Task balance shows how work is distributed across incidents, bug fixes, maintenance, and feature development.
A study presented at ICSE 2025 analyzed survey responses from 484 Microsoft developers. Larger gaps between their actual and ideal workweeks were associated with lower self-reported productivity and satisfaction.
So, if one team spends most of its time on urgent fixes and reports increasing exhaustion, you can review on-call coverage and recurring incidents before assigning another deadline.
Task mix alone cannot establish burnout. Some developers enjoy difficult debugging work, so workload data needs to be read alongside their feedback.
AI metrics help you check who uses AI tools, what happens to delivery after adoption, and how much the tools cost.
AI adoption measures show how many people use AI tools and how regularly they use them. 51% of professional developers reported using AI tools daily in Stack Overflow's 2025 Developer Survey.
With Axify's AI Adoption and Impact feature, you track usage by team and AI tool, such as GitHub Copilot, Cursor, or Claude Code.
Axify's AI adoption score looks at whether developers turn to AI regularly, rely on it for their work, and use it at a steady rhythm. These are its three pillars: Reflexive use, Reliance, and Trust. You can also compare active users with licensed users and track AI acceptance rate. The acceptance view shows total suggestions versus accepted changes over time, helping you see how often developers keep the output.
For example, 40 active users among 50 available seats gives an 80% adoption rate for the selected period. That tells you whether people use the tools, but you still need delivery metrics to assess AI's impact on your workflow.
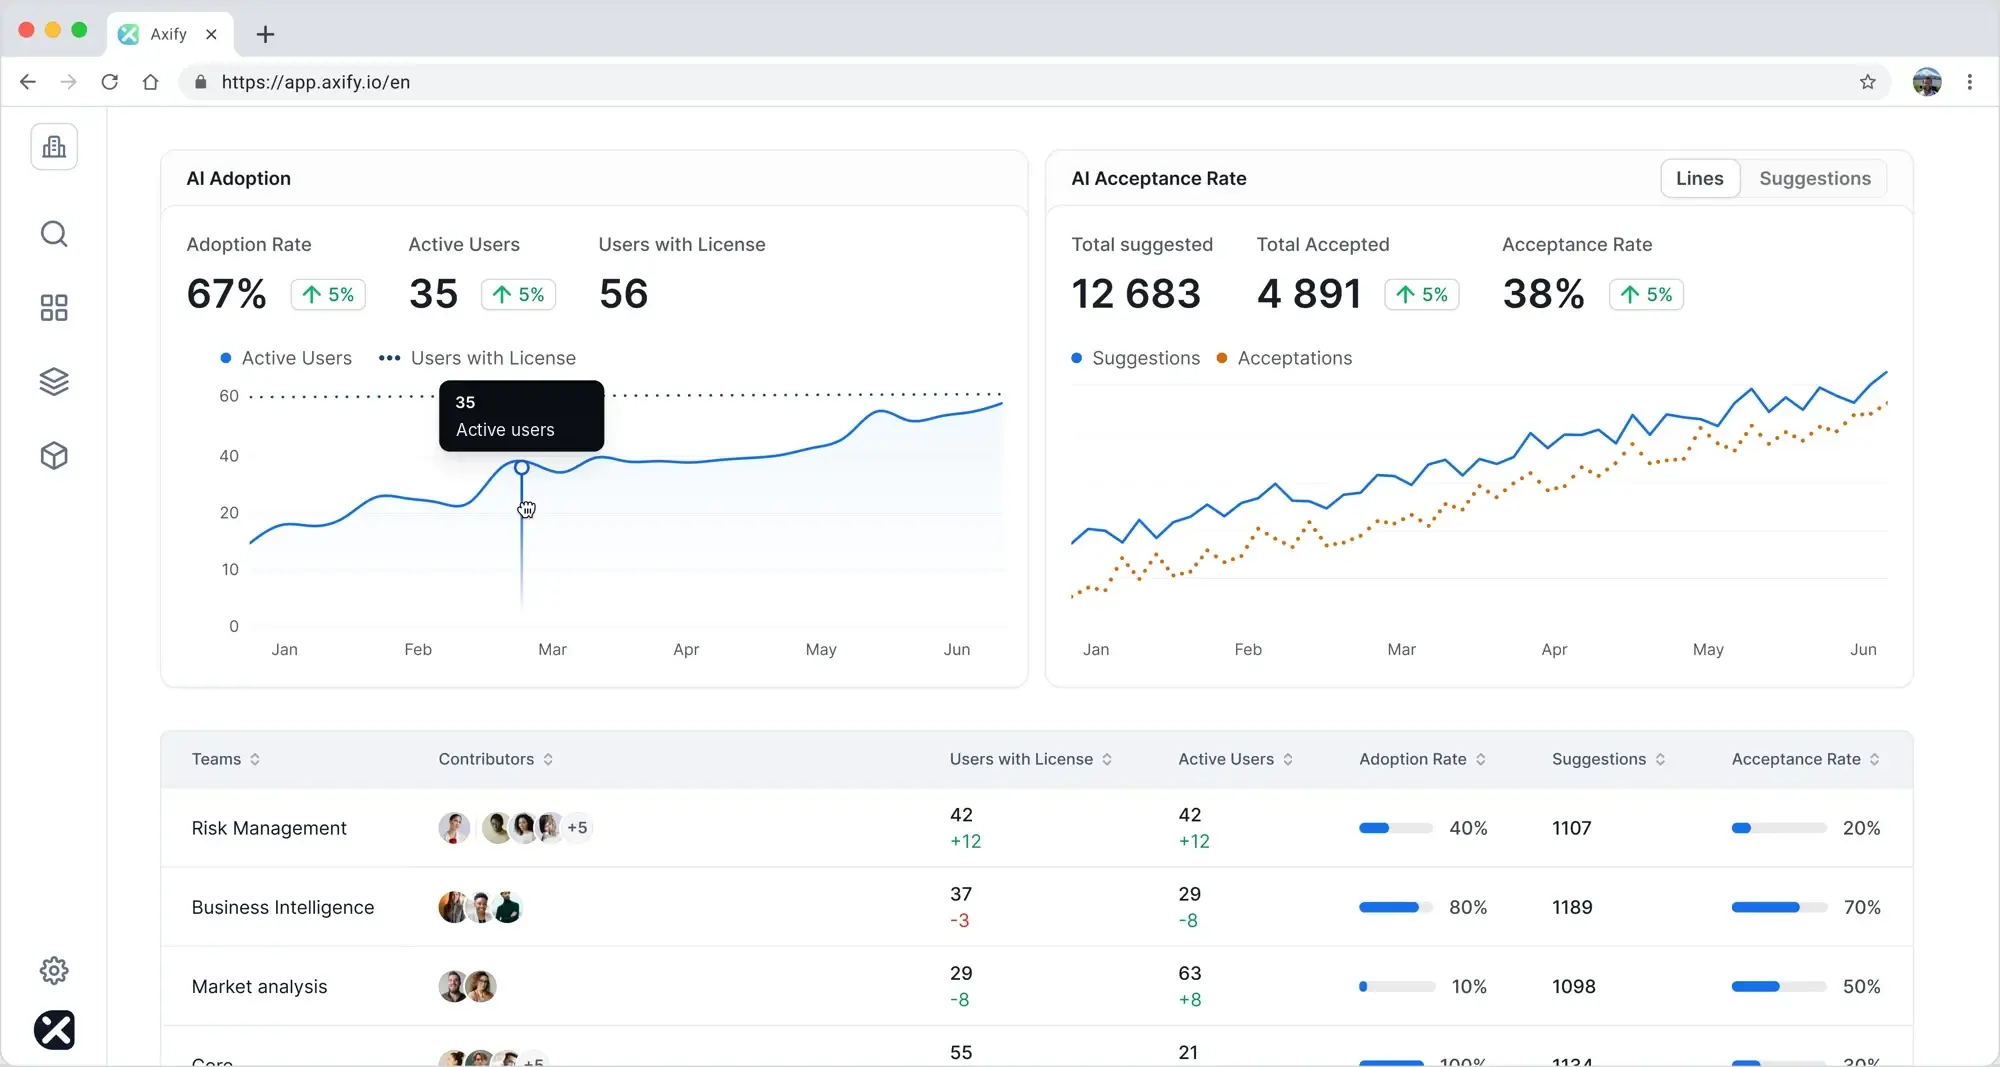
AI impact measurement compares adoption with cycle time, throughput, review time, and change failure rate across the software delivery lifecycle.
Here's how that looks in Axify: compare a team's 4-week baseline with a 4-week AI pilot. If cycle time falls from 10 to 7 days, check whether review time and change failure rate stayed stable. You should also account for changes in staffing and task size before attributing the difference to AI.
Axify Intelligence can then help you investigate delivery bottlenecks and identify which workflow changes to try next (and you can implement them directly from the platform).
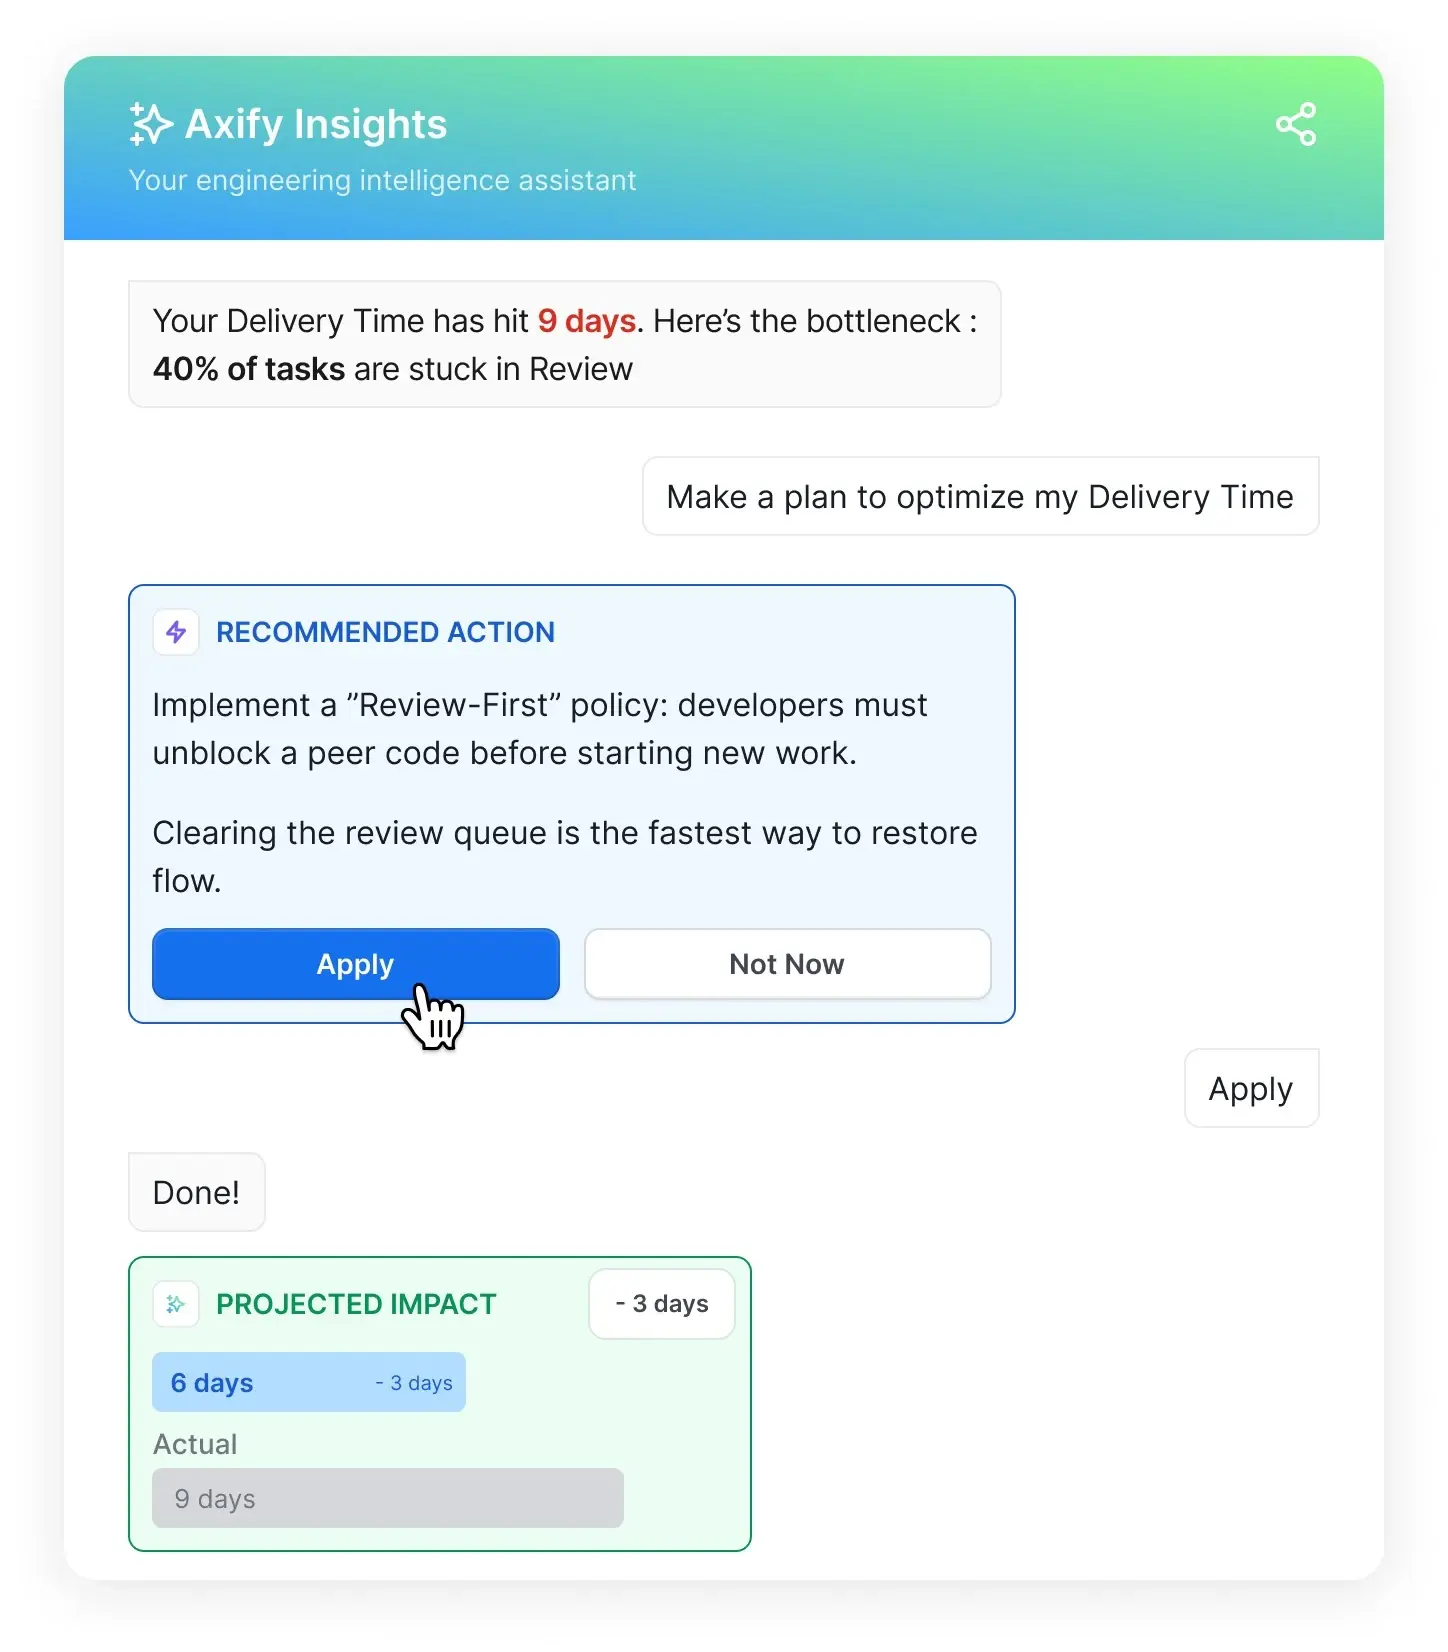
You can also use Axify's MCP server to explore these results through a compatible AI assistant. For example, ask, "How did cycle time, throughput, review time, and change failure rate change between this team's baseline and AI pilot?" The assistant retrieves your Axify data so you can compare the periods and ask follow-up questions about where delays increased.
AI cost measures show what you spend, while net time saved accounts for the effort required to review, correct, and maintain AI-generated work.
DORA's 2026 ROI report warns that purchasing licenses alone won't guarantee a financial return, and it counts the time developers spend verifying generated code as a real cost of adoption. So build your cost calculation beyond the spending visible in your tools.
For example, if AI saves 10 hours of coding but adds 6 hours of review and correction, the net saving is 4 hours before other overhead. That gives you a more useful starting point for an ROI estimate than the initial coding time saved.
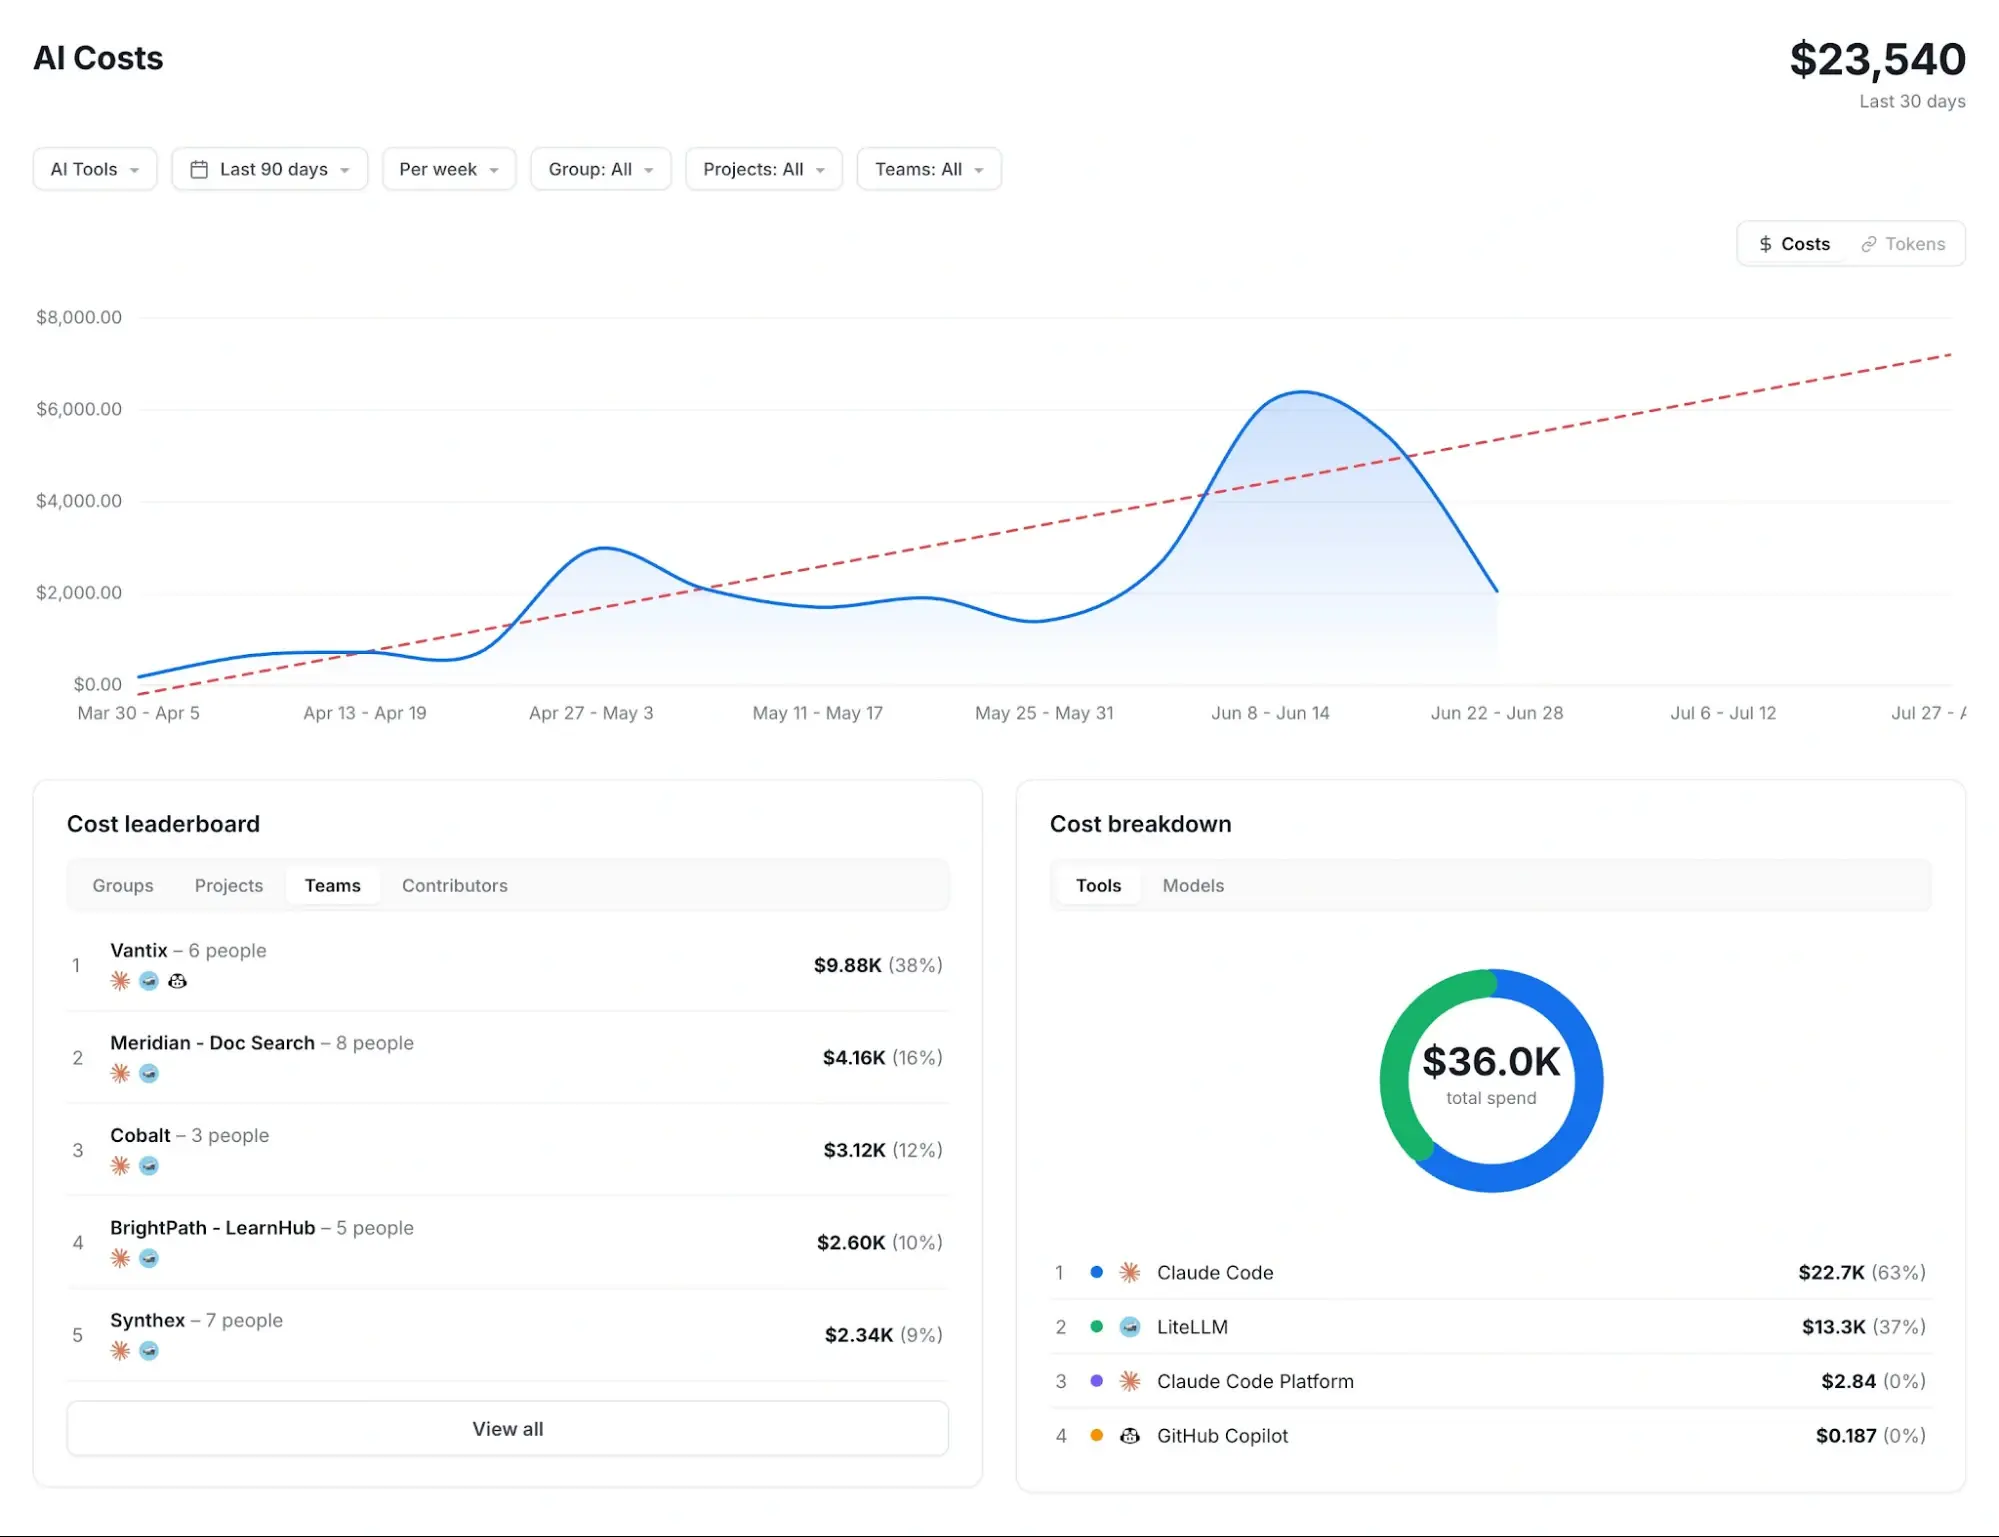
Axify's AI Cost and Forecasting helps you track AI usage costs by tool, model, and team, then project future spending. You can compare those costs with delivery metrics to investigate whether higher spending comes with faster delivery or more completed work.
Costs use providers' list prices, so include your actual contract charges and the review, correction, and training effort above when estimating ROI.
You need a clear problem to solve before you choose metrics. A small pilot gives you room to fix missing data and inconsistent definitions.
From our experience, here are the steps to implement software engineering metrics:
To get the most out of software engineering metrics, focus on how they help you improve performance, not just on tracking numbers. Here are six ways to turn metrics into meaningful changes for your team.
Start by identifying the bottlenecks that slow down your software development process. For example, if code reviews consistently take too long, you can redistribute workloads or set clearer review standards.
That's the approach Newforma took with Axify: by combining DORA metrics and value stream mapping to find delivery bottlenecks, its teams reduced lead time for changes by 63% and delivered 22X more often over five months.
"Rushing to optimize before the bottlenecks are known may be the only error to have ruined more designs than feature creep."
— Eric S. Raymond, The Art of Unix Programming
Focusing on the right problems first ensures your efforts make a real impact.
Avoid relying on vanity metrics such as lines of code or completed tickets. Instead, focus on metrics that directly affect outcomes, like customer satisfaction, team efficiency, and code quality. For example, tracking cycle time instead of story points gives you actionable data to reduce delivery delays and improve user experience.
Use metrics during retrospectives or sprint planning to uncover patterns and guide discussions. For instance, if work item age increases, your team can brainstorm ways to resolve stuck tasks faster. Integrating metrics into your rituals makes them tools for learning and improvement.
A single spike in a metric might not mean much, but consistent trends typically reveal deeper issues. For example, a steady rise in defect density might signal declining code quality over time. Monitoring trends helps you stay proactive instead of reacting only when problems become critical.
Share metrics transparently with your team so they can take ownership of their workflows. However, balancing autonomy with oversight is key to keeping team performance high.
A study in the Academy of Management Journal found that high trust could discourage monitoring in self-managing teams, and that low monitoring combined with high individual autonomy could harm performance.
Still, metrics should empower your team, not feel like micromanagement.
Compare metrics like cycle time, review time, and change failure rate before and after your team adopts an AI tool. Keep the team and type of work comparable.
If coding gets faster but reviews take longer or more releases need fixes, those gains may disappear before production. This helps you check whether AI tools improve engineering productivity across the whole delivery process.
Measuring software engineering metrics can improve performance, but it's not always simple. You might face obstacles that make tracking and using these metrics harder than expected. Understanding these challenges helps you address them effectively and get the most out of your data.
Here are some common challenges:
Pro tip: Pair every lagging indicator with a leading one. For example, instead of counting pull requests, follow how long PRs wait for pickup and review: it tells you much more about your delivery efficiency.
The right tools help you track metrics and turn them into actionable insights. Here are some options to consider:
Other engineering analytics tools in this category include Jellyfish, DX, and LinearB.
Software engineering metrics help you spot slow reviews, repeated production failures, and growing workloads. DORA, SPACE, and Core 4 give you different ways to choose what to measure and check whether your changes help.
Axify connects delivery metrics with AI usage and cost, so you can assess whether faster coding translates into faster releases. Your next step is to find where work waits: our guide to value stream metrics explains how to trace delays across your delivery process.
Want to see these metrics on your own data? Start your free 14-day trial of Axify, no credit card required.

DORA measures software delivery performance, SPACE covers developer productivity across five dimensions, and Core 4 combines speed, effectiveness, quality, and impact. In practice, they help you examine release performance, developers' working conditions, and how much effort reaches new capabilities.
Yes, DORA metrics remain an established framework for assessing software delivery in 2026. The current model uses five metrics and includes deployment rework rate. They measure delivery throughput and instability, so you still need other measures for developer experience.
Productivity metrics track completed work and how efficiently it moves, while reliability metrics track failures, recovery, and availability. For example, throughput shows completed work per week, while availability shows how consistently users can access a working service.
MTTR measures the average time needed to restore service after a failure, while MTBF measures the average operating time between failures. A system can recover quickly yet fail frequently, so you need both to understand how incidents affect users.
AI adoption makes review time, delivery speed, and failure rates more important to evaluate together. Faster code generation can increase pressure on reviewers and tests, so compare these measures before and after adoption, alongside tool costs and actual usage.
Your biggest problem should determine the category: choose reliability metrics for recurring outages or flow metrics for delayed work. If you have no clear starting point, flow metrics can help you spot aging tasks, blocked work, and overloaded stages.