


DORA Metrics
21 minutes reading time

Predict delivery dates by analyzing historical data and current progress.
Real-time tracking and insights into DORA metrics across your entire organization.
Detailed visual maps of your entire software development process.
Improve your software engineering with accurate metrics tracking.
Set inspiring objectives and track their progress.
Optimize team discussions around high-risk items and plan your tasks around real priorities.
Help development teams monitor and improve their well-being.

Axify gives you an unprecedented view of your operations.

Build high-performance development teams.

Make informed decisions and bring high-quality products to market faster.

For Scrum Masters, Agile and DevOps coaches, delivery managers and more.

Enhance your software delivery process for faster, higher-quality results.

Maximize efficiency with smarter resource distribution and management.
Boost your team's efficiency with insights and tools designed to accelerate project delivery.
Enhance developer experience for happier, engaged teams.

DORA metrics are five indicators that provide objective data to measure development team performance and drive software product improvement. They help developers continuously improve their practices, deliver software faster and ensure stability. Learn everything you need to know about DORA metrics by exploring our complete guide!

DORA is an acronym for DevOps Research and Assessment, a team that actively studies what differentiates a high-performing DevOps team from a low-performing team. In a seven-year program acquired by Google in 2018, this research group analyzed the DevOps practices and capabilities of more than 32,000 DevOps professionals and identified four key metrics in 2020 to measure software development and delivery performance.
In addition to an official DevOps report published annually, the team also released a white paper on the ROI of DevOps transformation, as well as the book "Accelerate: The Science of Lean Software and DevOps: Building and Scaling High Performing Technology Organizations," co-authored by Dr. Nicole Forsgren, co-founder of the DORA team and current partner at Microsoft Research.
Since there are many frameworks and methodologies to improve the way development teams build software products and services, DORA wants to shed light on what works and what doesn't in a scientific way.
Since their introduction, DevOps teams worldwide have been using DORA metrics to measure their performance and how they compare to high-performing teams.
At a high level, Deployment frequency and Lead time for changes measure speed, while Change failure rate and Failed deployment recovery time measure stability. A team can achieve better business results by measuring these metrics and continually iterating to improve them.
Indeed, the DORA team's studies show that teams with high delivery performance are twice as likely to meet or exceed their organizational performance goals.
In 2021, the DORA team added a fifth metric, reliability, to the factors impacting organizational performance. In this post, we will cover the first four metrics: Deployment frequency, Lead time for changes, Change failure rate, and Failed deployment recovery time.
As the name suggests, Deployment frequency refers to the frequency of releases: it measures how often a team deploys a change into production.
Development teams with better delivery performance tend to deliver smaller and much more frequent deliveries to provide value to users more frequently, improve customer retention and stay ahead of the competition.
How often does your organization deploy code to production or release it to end users?
| Elite performance | High performance | Medium performance | Low performance |
| On demand | On demand (multiple deploys per day) | Between once per week and once per month | Between once per week and once per month |
Source: 2023 Accelerate State of DevOps, Google.
Deployment frequency, as the name implies, measures the number of deployments the team makes in a given period (e.g., by month, week, or day). Therefore, a high Deployment frequency is a good indicator of the team's ability to make changes. In addition, a stable Deployment frequency (i.e., a regular deployment rate) can reflect an agile team delivering value continuously, which reduces the feedback loop, an invaluable benefit to the team and the users.

Regardless of where your team falls on the chart above, here are some ways to improve:
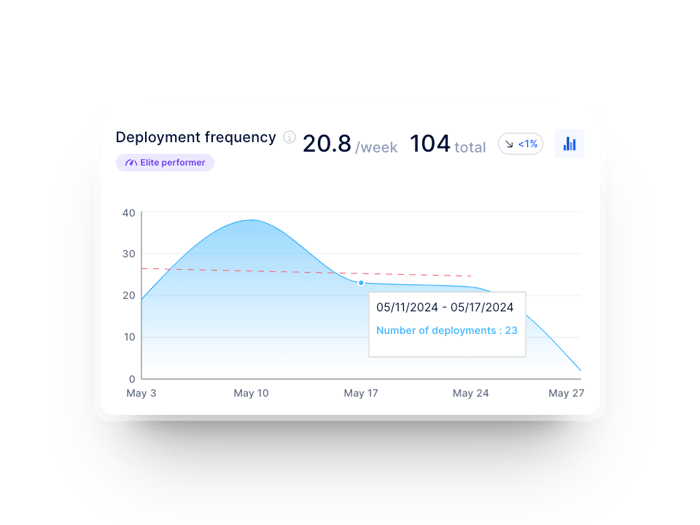
The Deployment frequency of a development team in Axify
This indicator measures the time between the first commit and deployment to production. We use it to understand the team's cycle time better and analyze its responsiveness to constantly changing user requests and needs. The shorter the time required to make changes, the more responsive the team is and the faster it adds value.
To measure Lead time for changes, we need two pieces of data: the exact time of the first commit and the exact time of the deployment in which it was made. We then use the average duration as a performance indicator: teams with better delivery performance can go from commit to production delivery in less than a day.
How long does it take to go from code committed to code successfully running in production?
| Elite performance | High performance | Medium performance | Low performance |
| Less than a day | Between one day and one week | Between one week and one month | Between one week and one month |
Source: 2023 Accelerate State of DevOps, Google
Lead time for changes indicates how quickly a team delivers changes to users. It represents flow efficiency, code complexity, and team capacity. Shorter delivery times are preferable, as they allow for a faster feedback loop on what you develop and for quick fixes.
There are many reasons for delayed deployments, including fear of deployment failure or rejection of partial delivery, so development teams need to have an accurate picture of how long it will take to put changes into production. This metric is handy for companies or managers tracking multiple contexts or teams, as it becomes a benchmark.

Regardless of where your team falls on the chart above, here are some ways to improve:

The Lead time for changes for a development team in Axify
Tip | Analyzing your process steps to target automation opportunities can benefit your team. By reducing human handling (both in testing and automation), you'll help speed up the delivery rate. Add a progressive repayment of technical debt and a better breakdown of items, and you'll be well on your way to reducing the Lead time for changes!
This metric captures the percentage of changes made to a code that subsequently resulted in incidents, rollbacks or any other type of production failure. According to the DORA report, the best-performing companies fall around 5%.
The tricky part for most teams is defining an "incident". It can be system unavailability (partial or complete), unusable functionality, a critical bug, a major bug or any bug. According to DORA, these are changes to production or user releases that result in service degradation (e.g., lead to service impairment or interruption) and then require corrective action (e.g., hotfix, rollback, fix forward or patch). A definition that is too broad or too restrictive could be detrimental to the team, and the answer is highly dependent on the team's context.
What percentage of changes to production or released to users result in degraded service?
| Elite performance | High performance | Medium performance | Low performance |
| 5% | 10% | 15% | 64% |
Source : 2023 Accelerate State of DevOps, Google
This is an indicator of code quality and stability. This metric shows the percentage of changes made that result in an incident. As mentioned earlier, the type of incident considered for this metric is specific to each team. But it is essential to understand that a high failure rate implies an increase in the time spent reworking existing features, thus decreasing the time allocated to deliver new value to users. While not a time metric per se, the failure rate of changes can have significant implications on your ability to create value quickly.
A low Change failure rate shows that the team identifies errors and infrastructure bugs before deploying code. This is a sign of a robust deployment process and the delivery of high-quality software. The goal of the DevOps team should be to reduce the Change failure rate to ensure that the software is available and working correctly.
Regardless of where your team falls on the chart above, here are some ways to improve:
Tip | Teams that deploy a few changes will see fewer incidents, but that doesn't necessarily mean they are more successful with the changes they deploy. Teams that deploy frequently may see more incidents, but if the Change failure rate is low, these teams will have an advantage because of their deployments' speed and overall success rate.

Change failure rate in Axify
Failed deployment recovery time measures the time it takes for a service to rebound from an incident or service degradation. No matter how well a team performs, unexpected outages or incidents will occur. And since we cannot avoid incidents, it's really the time it takes to restore or recover a system or application that makes the difference.
This metric is important because it encourages developers to build more reliable, available and resilient systems. We typically measure it by tracking the average time from when an incident is reported to when it is restored. For the best-performing teams, this means restoring the service in less than an hour.
How long does it generally take to restore service when a service incident or a defect that impacts users occurs?
| Elite performance | High performance | Medium performance | Low performance |
| Less than one hour | Less than one day | Between one day and one week | Between one and six months |
Source: 2023 Accelerate State of DevOps, Google
Failed deployment recovery time indicates a team's response time and the development process's efficiency. When it is low, it demonstrates that a team responds and resolves issues quickly to ensure product availability and functionality.
In addition, the ability of a team to recover quickly can positively impact users' confidence levels and make managers more comfortable with experimentation. This is a significant competitive advantage!
Regardless of where your team falls on the chart above, here are some ways to improve:
Tip | Balance speed and stability! Allow yourself to slow down sometimes to achieve better performance by reducing the work in progress (WIP). Avoid putting sudden changes into production at the expense of a quality solution. Rather than deploying a quick solution, ensure the change you make is sustainable and tested. It would be best to track Failed deployment recovery time to see how your team is improving and aim for steady, stable growth.

Failed deployment recovery time in Axify
To improve, you need a starting point and a goal to achieve. DORA metrics give development teams concrete goals, which you can break down into key outcomes. By knowing what data to track over time, developers will adjust their behaviour to improve the metric on their end, which will impact team and process efficiency.
In addition, variations in the results of DORA metrics will help you quickly target areas for improvement in the delivery process and identify problems such as ineffective testing.
DORA metrics are reliable metrics resulting from up-to-date scientific studies. Because the four metrics are interrelated, they are difficult to cheat, so you have a realistic picture of your situation. They also allow you to compare your team to the rest of the industry, identify opportunities for improvement and make changes to optimize your results on many levels.
Companies that streamline their development and delivery process increase the value of the software they develop and perform better in the long run. Tracking performance using DORA metrics enables DevOps teams to make decisions based on data, not gut feelings.
In addition, DORA metrics help align development goals with business goals. Finally, from a product management perspective, they provide insight into how and when development teams can meet customer needs.
In recent years, value stream management has become essential to software development. In this context, DORA metrics are indispensable, as teams that measure themselves tend to improve continuously. So when DevOps teams use DORA metrics, they typically see an increase in value over time.
As a set of proven DevOps benchmarks that have become the industry standard, DORA metrics provide a foundation for this process. They identify points of inefficiency or waste, and you can use this information to streamline and reduce bottlenecks in your workflows, such as deconstructing the Lead time for changes in steps to observe where the process is stuck. When your teams' DORA metrics improve, the efficiency of the entire value chain improves with them.
In addition, DORA metrics allow you to measure and improve yourself to ultimately:
DORA metrics also provide insight into team performance. By looking at the Change failure rate and Failed deployment recovery time, engineering managers can ensure that their teams are building robust products with minimal downtime. Similarly, tracking Deployment frequency and Lead time for changes assures that the team is working quickly. Together, these metrics provide insight into the balance between speed and quality within the team.
By comparing these four key indicators, one can assess how well the organization balances speed and stability. For example, if the Failed deployment recovery time is less than a week with weekly deployments, but the Change failure rate is high, then the team may be rushing deployments while lacking automated testing, or they may be unable to support the changes they are deploying. On the other hand, if deployments occur once a month and the Failed deployment recovery time and Change failure rate are high, the team may be spending more time fixing code than improving the product. It's all about context!
Most of the time, environments and data are decentralized, i.e., the data is dispersed in different sources throughout the organization. Moreover, extracting it can be complex when it is only available in raw format. Finally, the data must be transformed and combined into actionable units to allow development teams to take full advantage of it. In addition to the time required to perform these manipulations, manually calculating the data leaves room for interpretation, which presents a risk of error or of communicating the wrong information.
Like all data, DORA metrics need to be put into context and consider the story that these four metrics tell together. For example, Lead time for changes and Deployment frequency provide insight into a team's pace and how quickly it responds to evolving user needs. On the other hand, Failed deployment recovery time and Change failure rate indicate the stability of a software product and the team's responsiveness in the event of a service interruption or failure. Only a professional who understands the reality of the development team will be able to interpret this data correctly to contribute to their continuous improvement.
At Axify, we integrate DORA metrics into our dashboards to see all the factors supporting your team in continuous improvement at a glance. No data mining or ambiguity about interpretation. Everything is at your fingertips to stay on top of things! Plus, since all your teams will use the same structure and extraction method, it will be easier for you to compare apples to apples.

Once you've chosen a tool that allows you to track DORA metrics, don't focus on the metrics at first. Instead, start collecting data, follow the metrics for a few weeks, and then analyze what you need to improve.
Next, set goals for improvement: focus on your product and its growth and on growing your team and improving processes. Think of the DORA metrics as indicators of what you can do to impact the product and its business results positively.
In reality, metrics are just a tool. What's important is that the development team wants to improve its effectiveness and use metrics to know if it's making progress in its continuous improvement efforts. So give your team the tools they need to succeed in making the best changes that will help your team achieve their goals.
When your DORA metrics improve, you can be confident that you've made the right decisions to improve your team's performance and that you're bringing greater value to your customers.
Axify brings together several features to help you visualize the progress of these metrics for your team(s):
Contact us for more information on how Axify helps development teams measure DORA KPIs or request a demo.