Software Development
7 minutes reading time

-2.webp?width=1200&name=Axify%20blogue%20header%20(9)-2.webp)
We want to help you avoid that.
So, we’ll discuss the 24 key metrics that help you make informed decisions. We’ll also explain:
First, let’s step back and define what engineering metrics actually mean in practice.
Engineering metrics are quantifiable measurements that show how your team delivers value. They give you visibility into software development processes, highlight where performance supports or slows business outcomes, and provide a foundation for making better decisions.
These measures shouldn’t be used to control or micromanage your team. They’re supposed to help you build alignment and predictability, thus leading to solid improvements.
The truth is, without the right metrics, you risk wasted engineering efforts, poor quality software, and decisions that weaken both financial results and customer satisfaction. That’s why 66% of leaders now track outcomes tied to business impact, from DORA metrics to cultural signals from the SPACE framework.
For a deeper perspective, you can watch this short video on selecting the most effective metrics for leadership:
Metrics measure activity, while KPIs represent the few metrics tied directly to your strategic goals. Your metrics give you raw visibility into aspects of engineering processes, such as cycle time or the number of open defects. KPIs, on the other hand, focus on whether those measures translate into real business impact.
Take code quality as an example.
You might track metrics like code coverage, defect density, or review comments. None of these on their own guarantee better business results. But if your KPI is “improve release stability,” then those metrics become signals that feed into your monitoring process.

This can show you if your improvements are working. So, keeping this distinction clear prevents teams from gaming the numbers and keeps attention fixed on what truly matters.
Yes, you can track these metrics, but what's in it for you? Let's go over that next.
As a senior leader, you’re expected to show how your engineering team creates measurable business value. That requires more than conjectures or anecdotal reporting. You need evidence that links engineering work to financial and strategic outcomes.
Here are the main ways that tracking metrics gives you that clarity:
Next, let’s look at common mistakes leaders make when tracking these measures.
Even with the best intentions, you can weaken trust and decision quality if you track metrics the wrong way. Here are the most common mistakes to avoid:
Many companies report monitoring 50 to 100 metrics across different dashboards. That level of noise makes it nearly impossible to extract actionable insights. Instead, you should focus on a handful of measures that connect directly to your broader business objectives.
If you measure defects after release but never track mean time to recovery or flow efficiency, you only see problems after customers do. Leading signals give you early warning and help protect revenue.
Driving one number in isolation creates distortion. If you chase continuous deployment frequency without watching failure rates, you may reduce stability while trying to look fast. Metrics should be paired in tension to show the trade-offs.
This is one of the fastest ways to destroy trust. A survey found that 71% of employees question even the fairness of rarer performance reviews. This usually happens because work happens at a team level, so the entire team is responsible for the outcomes. Numbers are usually misapplied at the individual level. That’s why we always advise our clients that metrics should remain at the team or org layer.
Dashboards on their own don’t improve outcomes. The value comes when you bring the data into retros, quarterly reviews, and roadmap planning to guide better engineering productivity decisions.
Next, let’s see which engineering metrics matter most for leaders to track.
Choosing the right measures means focusing on signals that tie engineering work to business impact. Below are the key categories of engineering metrics that give you both operational and strategic visibility. Each will be explored in more detail, but this list shows how metrics span across Process, Product, Project, and People dimensions in your organization.
Process metrics give you direct visibility into how work flows from idea to production. The 2024 DORA Report continues to show that elite performers outperform average ones by orders of magnitude on delivery speed and stability.
Here are the process measures that give you the clearest view of efficiency, risk, and business alignment:
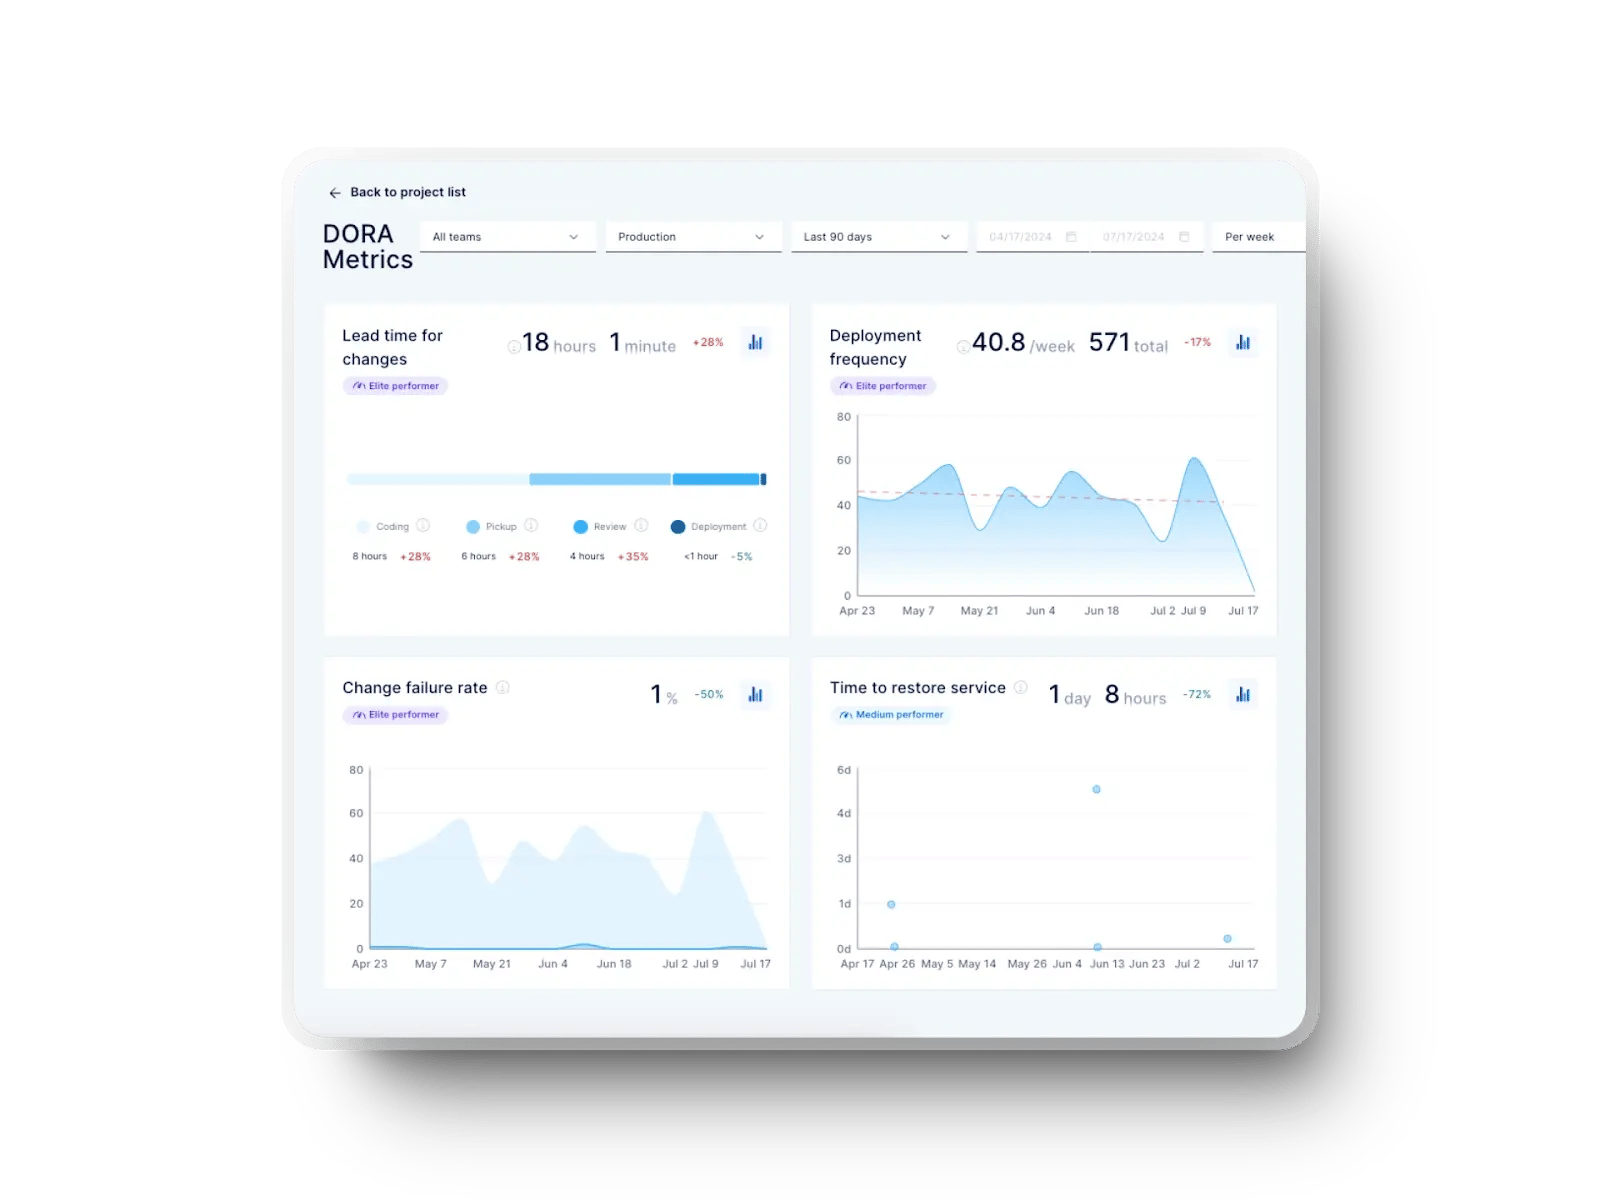
Apart from the DORA metrics, you also need to track how efficiently work flows through your system:


Product and quality metrics show you whether your engineering output translates into reliable customer value. They help you connect technical signals with business priorities such as retention, trust, and long-term revenue.
Here are the measures that matter most:
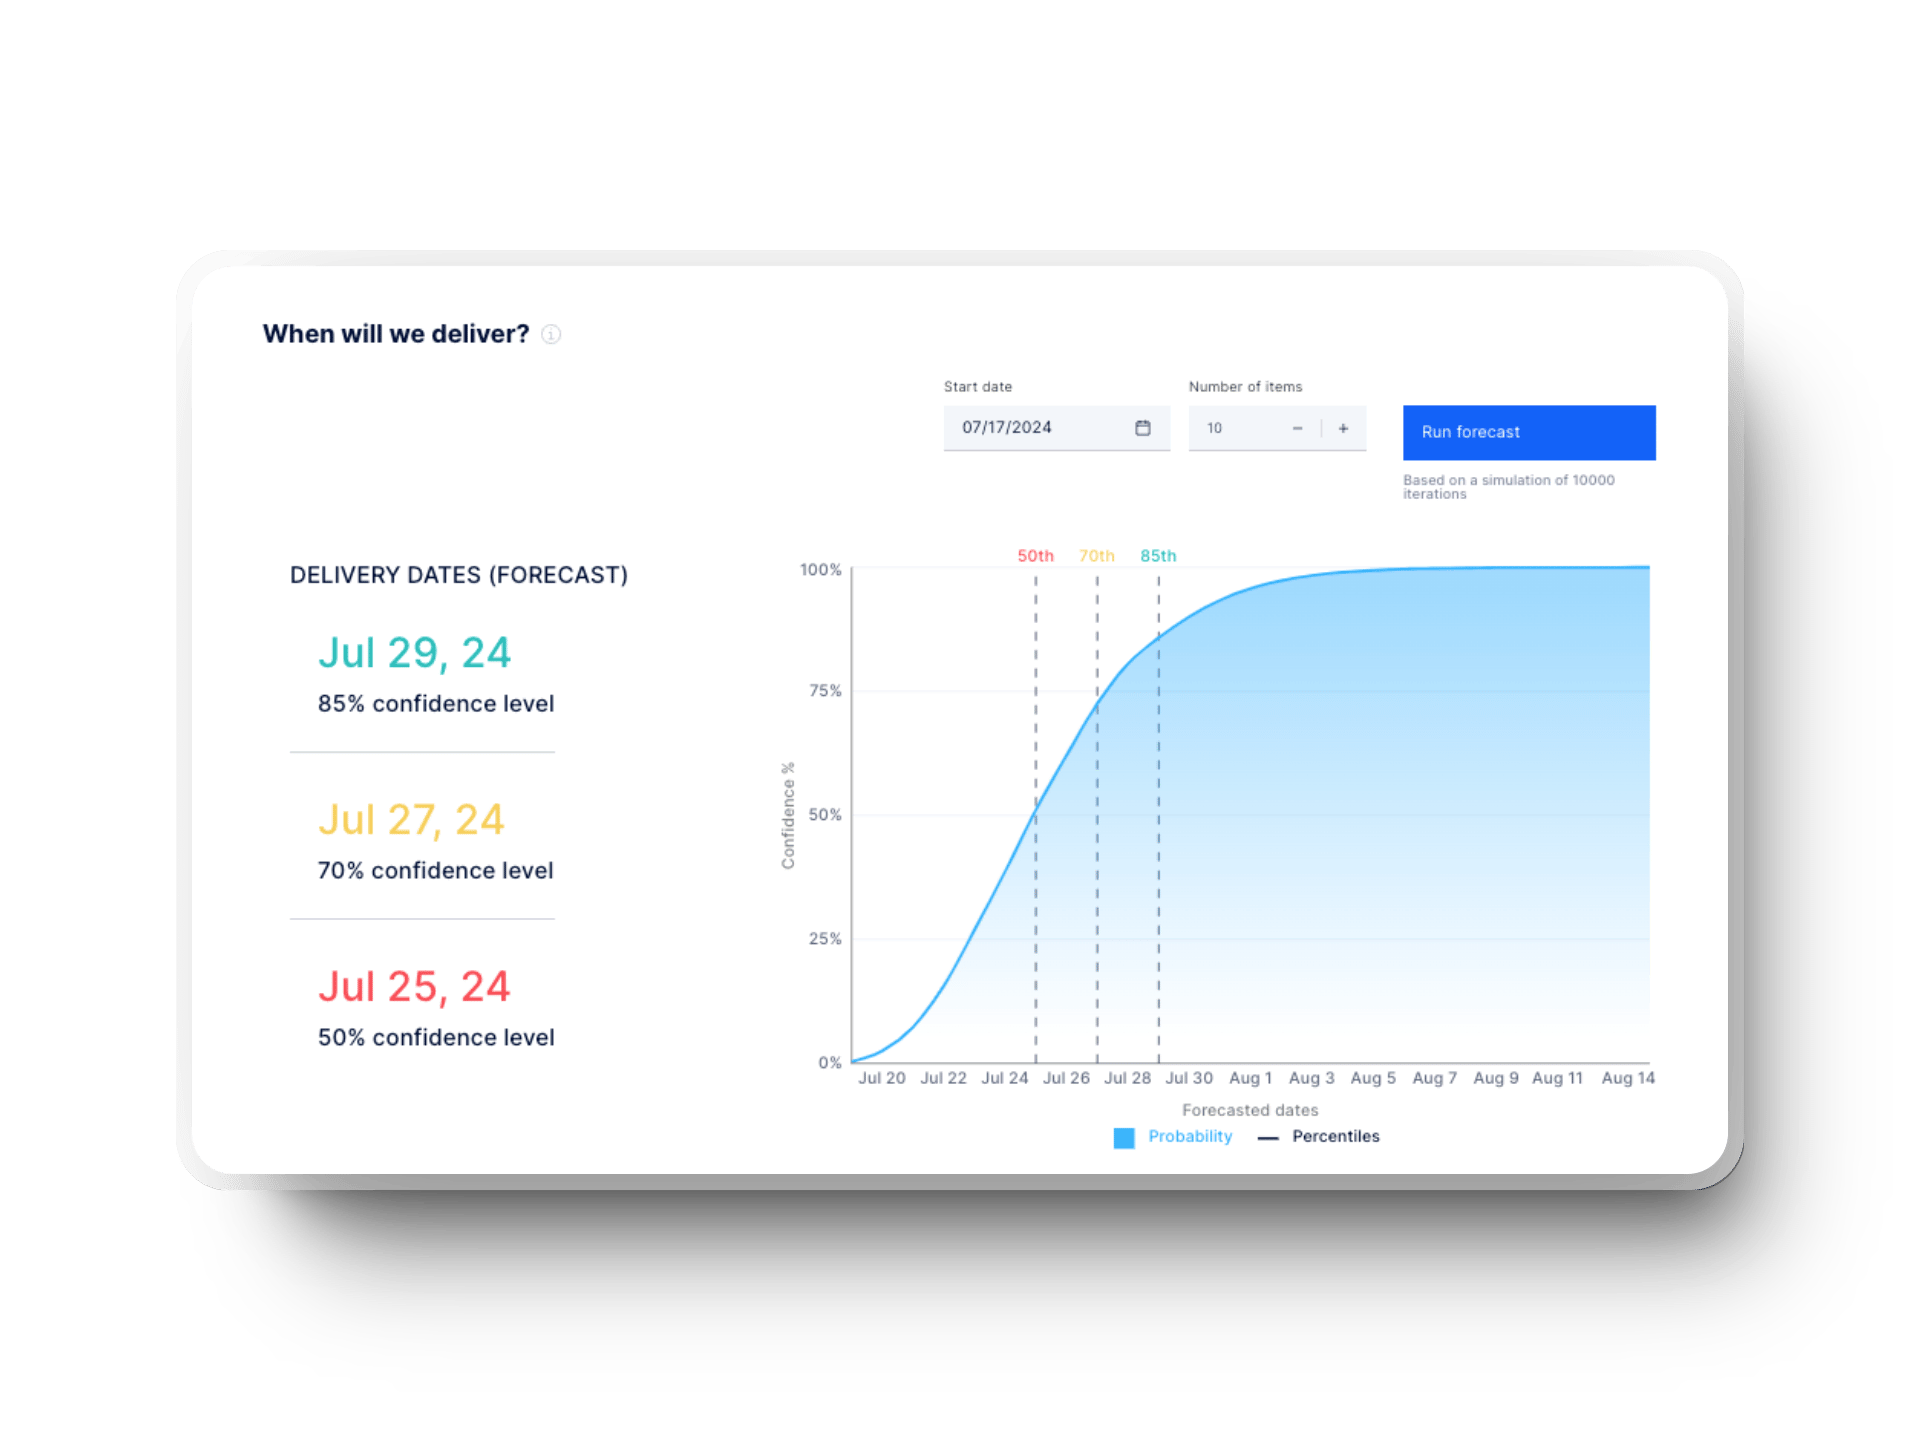
Project metrics show you whether your delivery plans align with business commitments. They bridge the gap between engineering execution and strategic delivery. Here are the ones that matter most:

Culture metrics show the human side of engineering. They reveal whether your teams are engaged, collaborative, and capable of sustaining delivery over time. Here are the measures worth tracking:


Choosing the right metrics should be about what actually drives your business forward. Here’s how you can build a metrics strategy that works in your context:
Or, you can use Axify. The platform already offers most of these important metrics in one view. This can save you from stitching dashboards together so you can focus on decisions instead of data collection.
Metrics only create value if they are applied with clarity and consistency. Without structure, you risk wasted effort, loss of trust, or dashboards that nobody uses. Here are the practices that help you turn numbers into meaningful business outcomes.
You need to define why you are tracking a metric and what decision it will support. Yet McKinsey’s 2023 survey found that only half of leaders say their organizations know what needs improving, which explains why so many dashboards lack impact. Without clear intent, metrics turn into noise instead of meaningful guidance.
When engineers help choose what gets measured, they are more likely to take ownership of the outcomes as a team.
And Gallup’s research shows that teams with higher engagement deliver 22% greater productivity.
Besides, involving developers in the process allows you to reduce resistance and build shared accountability.
Manual reporting drains time and creates doubts about accuracy. According to MetricsWatch, automated dashboards can save 8-16 hours per week and increase productivity by about 30%. This shows the cost of sticking with spreadsheets.
With Axify, you cut out that wasted effort entirely.
The platform automatically collects data from your existing tools, normalizes it, and presents delivery health in real time. Instead of debating numbers in leadership reviews, you spend your time discussing trade-offs, risks, and how to accelerate outcomes.
Metrics must be visible and usable by both teams and leadership. Yet Deloitte reported in 2024 that only 13% of organizations excel at transparency between leaders and employees, which shows how rare true visibility is. Clear visualizations bridge that gap and create alignment from daily standups all the way to board updates.
Data becomes valuable when it informs real conversations. Bring metrics into retros, quarterly planning, and leadership reviews. When metrics guide rituals, they stop being “extra reporting” and start shaping strategy.
Your organization will mature, and your metrics must adapt with it. Reviewing them regularly prevents stale data from guiding critical investment decisions. This practice keeps metrics aligned with changing priorities.
Numbers alone never tell the full story. Gallup found that 80% of employees who received meaningful feedback in the past week were fully engaged, which shows how strongly qualitative context shapes performance.
So, pairing quantitative results with surveys and feedback sessions allows you to balance hard data with cultural health. This approach prevents blind spots in leadership decisions.
Engineering metrics only have real value when they connect to outcomes that matter at the company level. Otherwise, they risk staying confined to dashboards without influencing strategy. Here's what you need to do to build that connection.
According to the SaaS Product Metrics Benchmark Report 2025, the average adoption rate for SaaS features is only 24.5%. This means most of what gets shipped isn’t widely used.
That’s why you need to link delivery activity with measurable business outcomes such as cost per feature, feature adoption, or usage relative to engineering effort. In other words, mapping work to value is how you make sure that your engineering efforts are invested in what customers actually want.
Improving flow efficiency or reducing change lead time is also about financial impact. Businesses implementing process improvements have been shown to cut operating costs by up to 30% within two years.
Tying metrics to cost reduction or revenue recognition makes the financial impact visible. This helps you demonstrate why engineering maturity is directly linked to profitability.
Engineering metrics cannot sit in isolation. They need to form the basis of joint planning sessions with product and business leaders.
McKinsey found that companies in the top 25% of technology maturity (which includes strong alignment across functions) grow revenue up to 35% faster and achieve 10% higher profit margins. This proves that using metrics as a shared language directly supports better prioritization and stronger business results.
Metrics also give finance leaders confidence that engineering spend is tied to measurable returns. Using investment profile metrics (how much time goes into new value vs. tech debt vs. keep-the-lights-on) shows you where resources are allocated and how trade-offs are made.
Axify consolidates this data into one source of truth. It also gives you evidence for board discussions, budget negotiations, and quarterly planning.
Executives want proof that engineering is a disciplined investment function. Deloitte’s 2024 research found that 86% of leaders see increased transparency as a driver of workforce trust. Sharing your metrics strategy openly (whether in board updates or QBRs) signals maturity and builds confidence that you are proactively managing delivery risk.
To build a metrics-driven culture, you need more than dashboards. Axify gives you a structured approach with features that connect delivery, quality, and culture. Here are our core capabilities.
Axify gives you full visibility from idea to deployment through Value Stream Mapping (VSM). Instead of seeing fragmented metrics in Jira or GitHub, you see the entire delivery system in one view. That means you can quantify how much time is spent waiting in queues versus delivering actual value. You can also see bottlenecks and opportunities along the way.

For an executive, this is critical because you can show the board why feature throughput is constrained. Delays may stem from backlog prioritization, code reviews, or release practices.
With this clarity, you can direct engineering investment where it actually accelerates business outcomes. That might mean hiring, process redesign, or automation. VSM turns engineering from a cost center into a measurable driver of growth.
Axify supports DORA, SPACE, and Flow Metrics to give you a standardized set of measures trusted by high-performing organizations. You don’t waste time deciding which framework to adopt, because the platform aligns directly with proven models. That consistency strengthens conversations with product and finance leaders who expect credible benchmarks.
Point-in-time metrics usually mislead. Axify points to trends over time, which show whether delivery speed, failure rates, or throughput are improving or declining. This context turns raw numbers into guidance you can act on in quarterly reviews and strategic planning.
Engineering performance isn’t just about speed. Axify provides a developer productivity assessment that examines your ways of working, product management, development practices and tools, as well as team culture and collaboration. This holistic view helps you balance fast delivery with long-term efficiency and operational resilience. The goal is to maintain high performance without falling into burnout cycles that quietly reduce productivity and retention over time.

Instead of static dashboards, Axify gives you real-time insights into delivery health. Metrics update automatically from Jira, GitHub, or Azure DevOps, which eliminates manual reporting. That means you can walk into board meetings with confidence that your data is current, consistent, and defensible.
Engineering metrics should not entail merely tracking activity. They should be about driving outcomes that matter for your business. When used well, metrics empower teams, align your organization, and prove the impact of engineering investments.
The truth is, you don’t need dozens of dashboards to get there. You need a focused set of metrics that grow with your maturity. So, try to start small, review continuously, and evolve as your needs expand. With the right approach, metrics will fuel your decision system and lead to better results.
Ready to see how Axify helps you put this into practice? Contact us today for a free demo!