Delivery Performance
6 minutes reading time


You track work in Jira Software, check burndown charts, and review sprint reports. But does any of this actually improve your team's work?
You’re often stuck with surface-level data that looks useful but doesn’t tell the whole story. Sure, you can see what got done, but why did things take longer than expected? Or where bottlenecks are slowing you down?
If you’re tired of staring at numbers that don’t lead to real improvements, you’re in the right place. Here, we'll break down several Agile metrics in Jira and show you how to turn raw data into actionable insights.
Let's get started!
Jira metrics are data points that help you track team performance and workflow efficiency. They measure everything from sprint progress to issue resolution times. This gives you a clearer picture of how work moves through your software development process.
But numbers alone won’t fix your bottlenecks or improve your delivery speed. You need the right key metrics to make sense of the data and drive meaningful improvements.
Jira ranks as the 11th most popular enterprise tool among top websites. But without the right approach, it’s easy to get lost in reports that don’t lead to real progress.
Tracking the right Agile metrics in Jira helps you keep work on track and spot slowdowns before they become more significant problems. Here are the key reports Jira provides to help you manage your workflow:
While these charts can be helpful for Scrum teams in specific scenarios, they focus on task movement rather than overall development process efficiency. You need a broader view beyond Jira’s built-in reports to improve team efficiency.
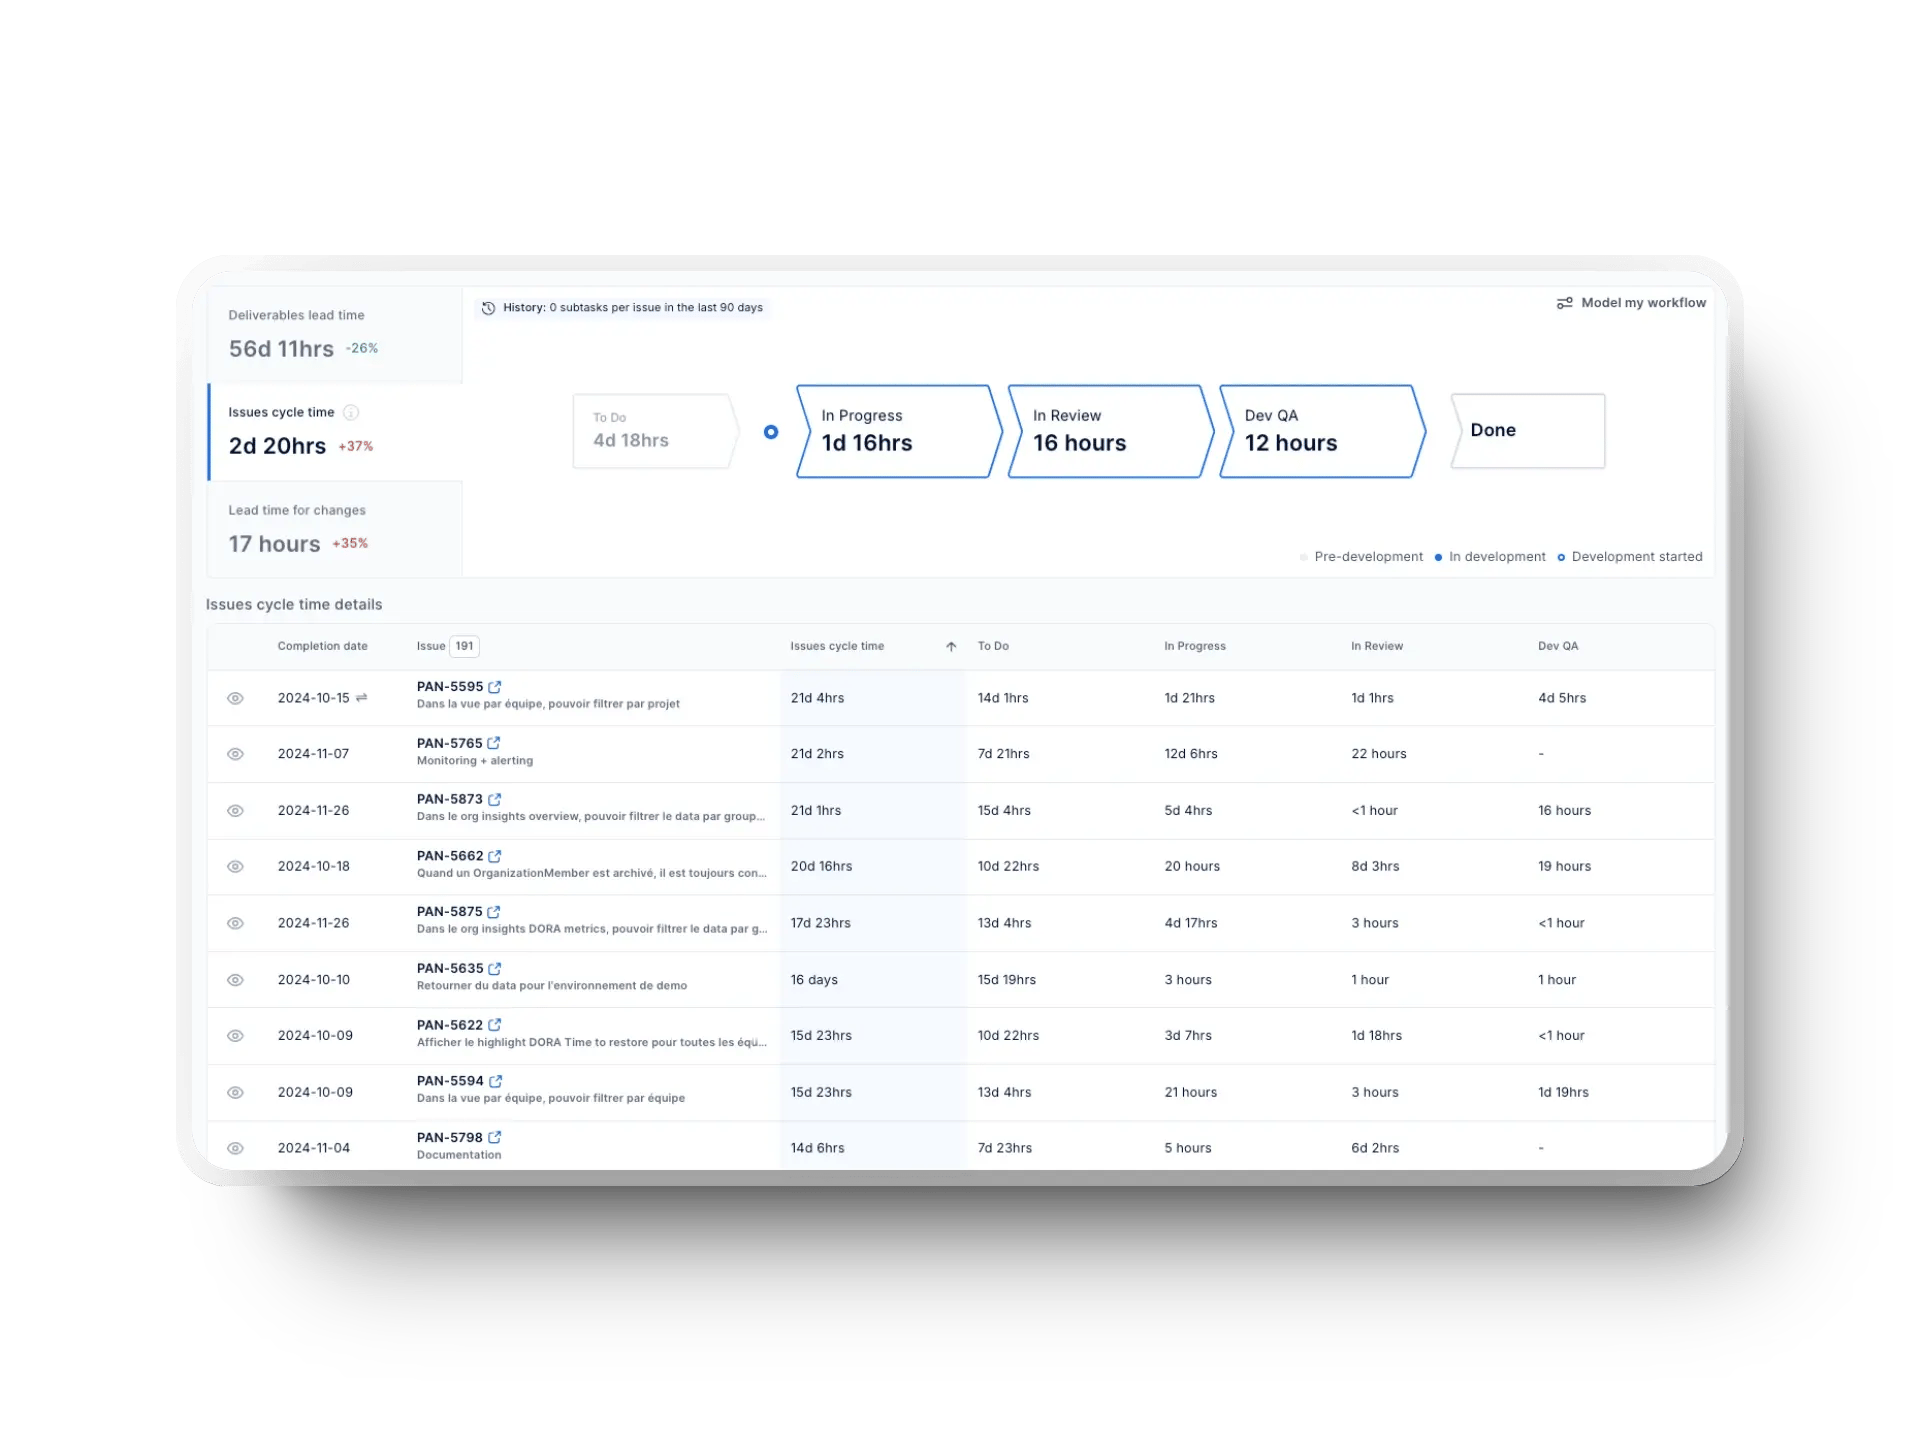
Jira’s reports help you focus on sprint tracking, but what if you need a bigger picture? Axify’s Value Stream Mapping offers more than sprint-based charts to show how work moves through your entire software development lifecycle – from coding to deployment.
Instead of just tracking tasks, you get a clear view of where time is spent and where delays slow your team down. Axify’s VSM allows you to:
Defects are inevitable, but how you track and fix them makes all the difference. Jira offers several relevant metrics to help you monitor defect trends and improve code quality over time. Here are the defect metrics in Jira:
Tracking these defect metrics helps you decide where to focus testing and process improvements. The goal isn’t just fewer bugs; it is faster fixes, better prevention, and higher-quality software.
Jira tracks defects, but Axify helps spot the more prominent issues affecting your development team. Instead of just counting bugs, Axify shows you high-level bottlenecks such as slow code reviews, long deployment times, and rising change failure rates. Thus, you get a complete picture of where work is stalling so you can take action before problems pile up.
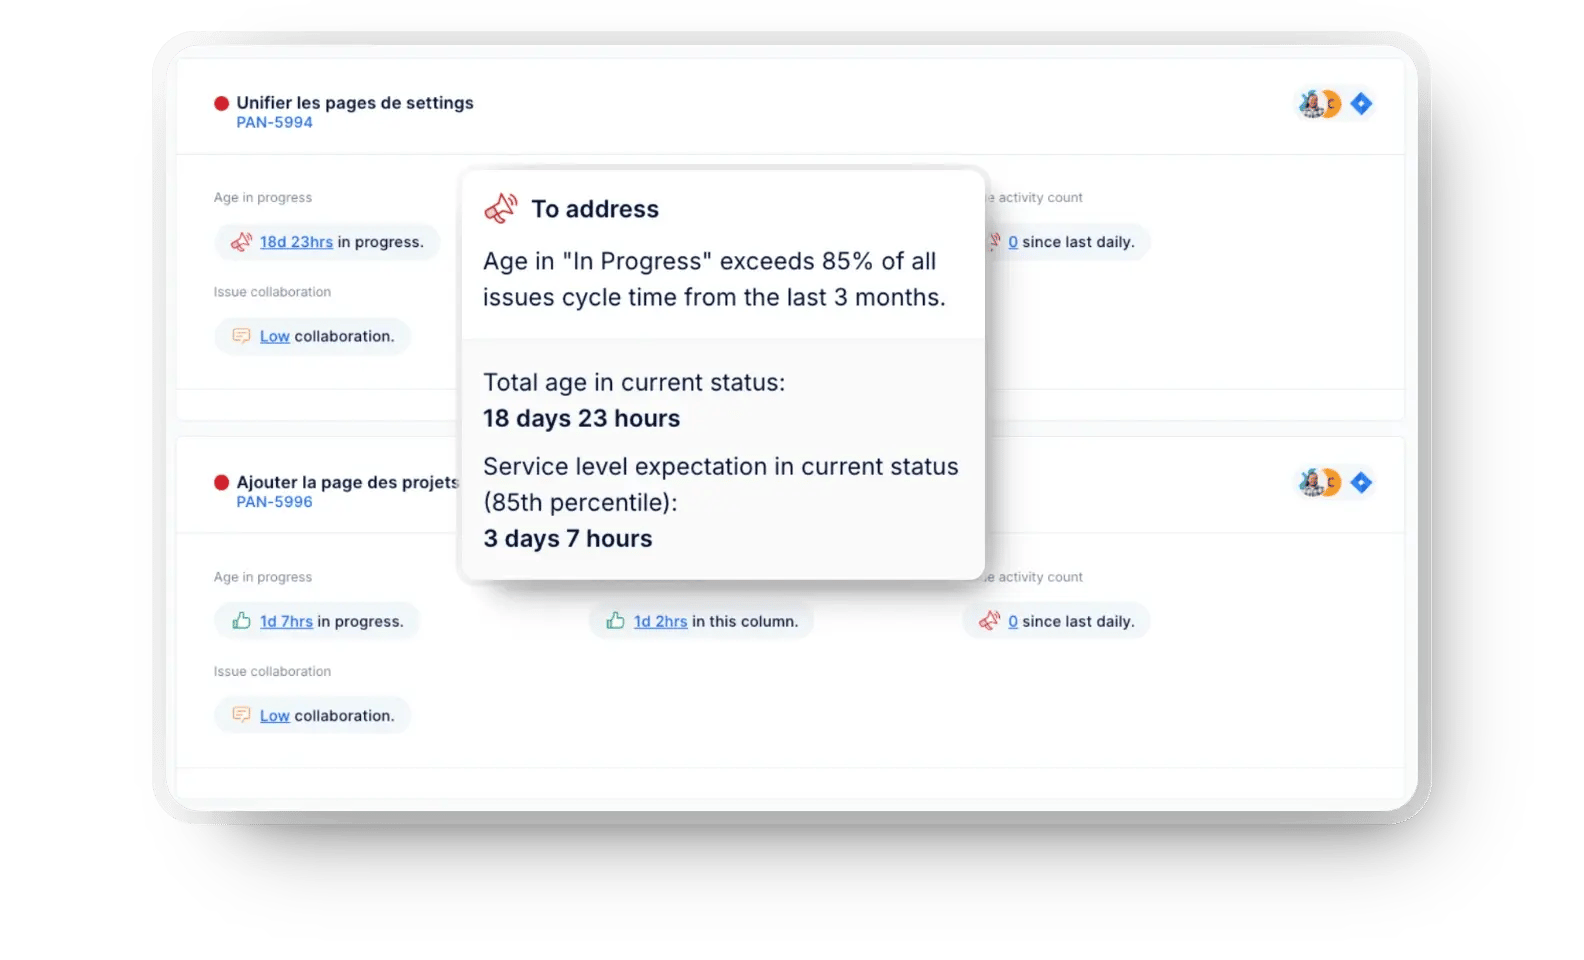
Axify’s Daily Digest allows you to focus on aging tasks and prioritize what needs attention most. While Jira provides basic backlog tracking, Axify gives you real-time data to keep work flowing and your team operating at its best without getting lost in spreadsheets and reports.
Jira helps you track quality improvements, but it has limitations. While it allows you to monitor defects, test execution reports, and issue resolution trends, it does not provide insight into software stability.
What’s missing?
Test coverage and deployment risk analysis are key factors in delivering high-quality code. Jira won’t show you if your testing is thorough enough or if deployments introduce risks. Without these insights, you might fix defects but still struggle with unstable releases.
If you want a complete view of project progress, you'll need more than Jira's built-in reports. A broader, data-driven approach gives you the whole picture.
Jira gives you some quality tracking, but Axify takes it further with DORA metrics to help you measure and improve your software delivery. These four key metrics give you real-time data on speed, stability, and reliability:

DORA metrics give engineering leaders real insights into team performance. They help identify process improvements and track stability.
For example, analyzing CFR and MTTR helps spot failures early and keep code stable. Deployment frequency and change lead time show how smoothly the team delivers. Together, these metrics reveal both code quality and delivery speed, helping teams ship better software faster.

Axify helps keep your team moving efficiently by allowing you to focus on continuous improvement. You must stay Agile and focus on improvement to build more reliable software.
Tracking project progress in Jira requires more than checking completed tasks. You need the right key performance indicators to determine whether your team is delivering as expected.
These metrics are used to estimate progress for your project in Jira:
Side note: We don’t advocate for story points as a definitive measure of productivity. However, for the sake of objectivity, we’re explaining their use in tracking sprint progress, as some teams still rely on them. More on that below.
Jira gives you numbers, but Axify helps you make sense of them. As we explained above, we don’t advocate for story points. So, instead of relying on them, Axify enables you to track the throughput of completed items to give you a clearer picture of actual work done.

You also get insights into your work in progress, lead time for changes, and an issue type time investment metric to see where time is spent and where work gets stuck.

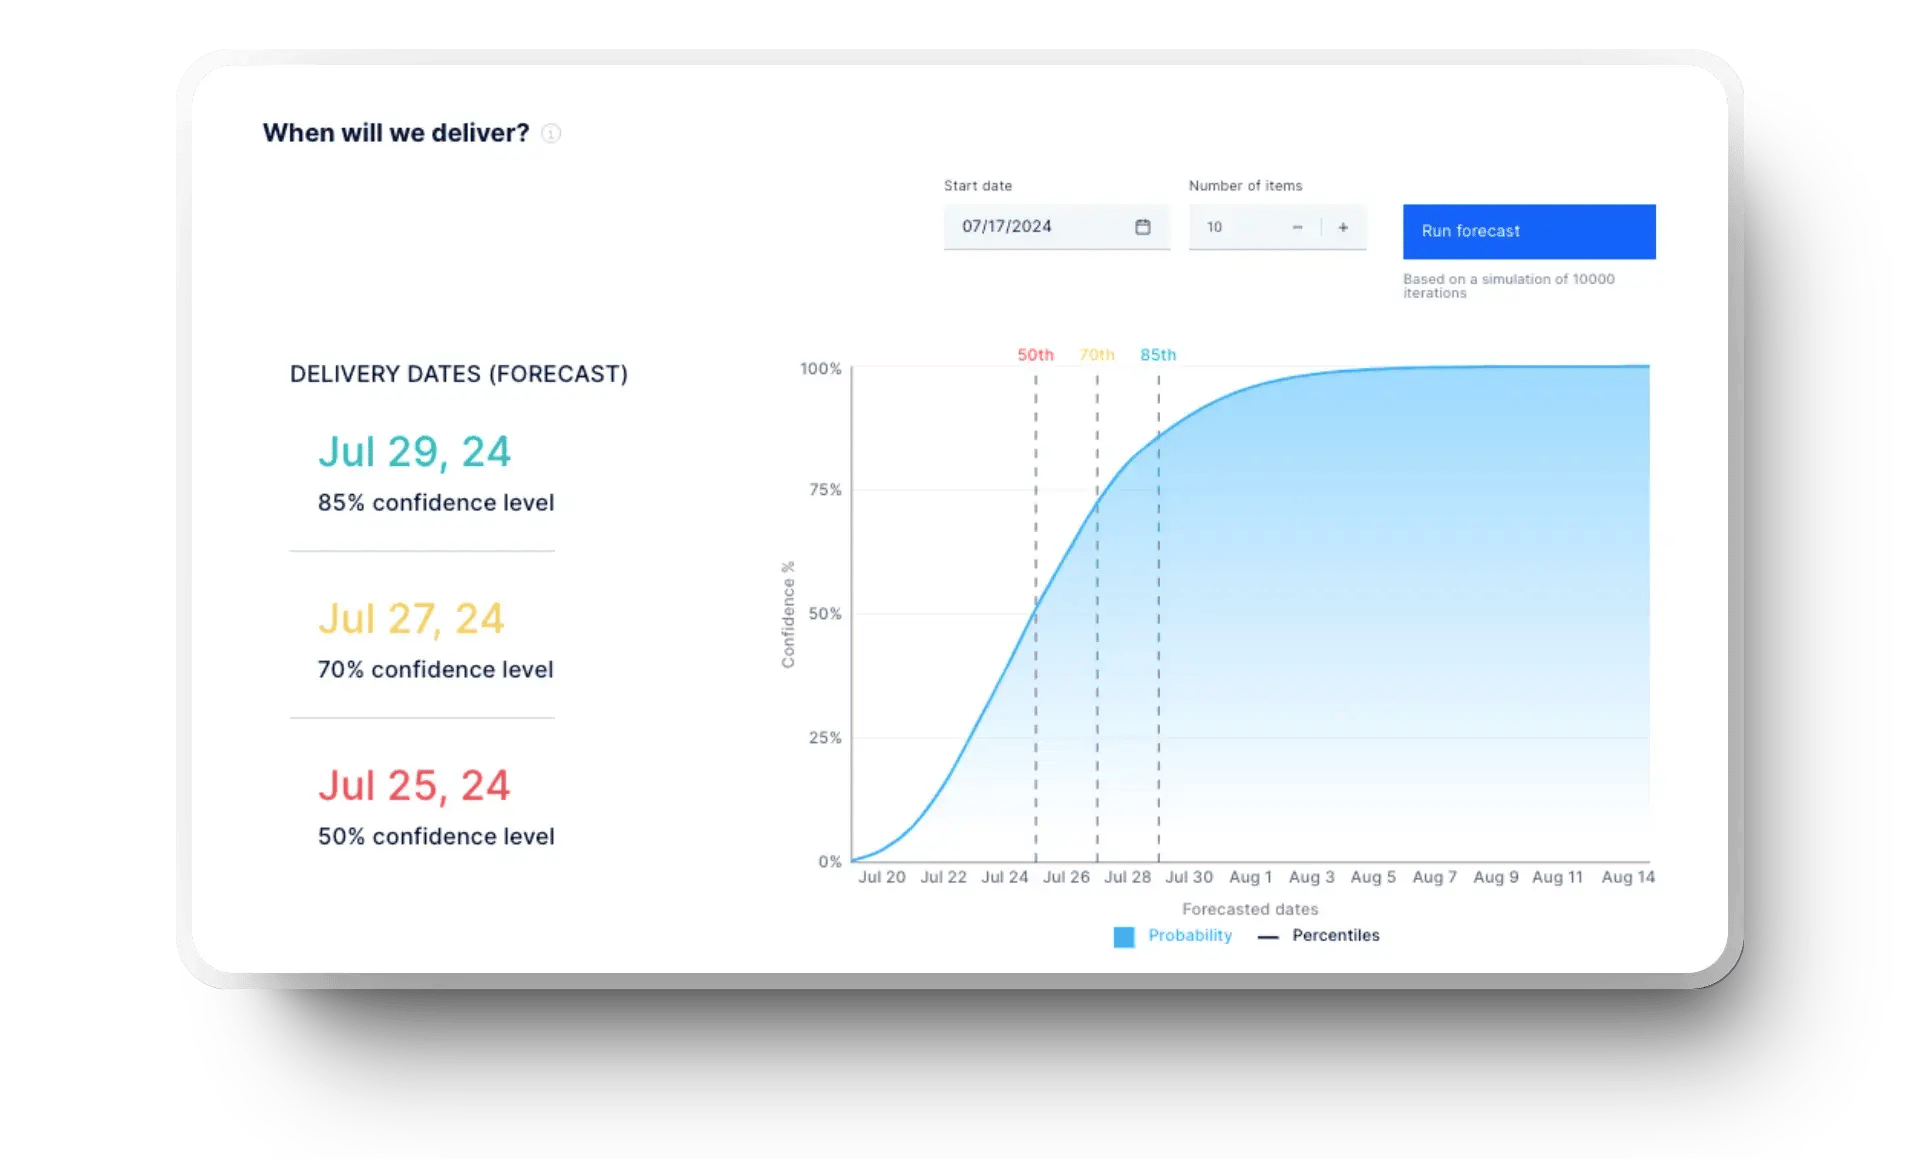
Need a better way to predict delivery dates? Axify uses Monte Carlo simulations to help you forecast project timelines based on accurate engineering metrics – no guesswork, just data-driven predictions. With real-time data, you can stop reacting to problems and start planning with confidence.
To get reporter metrics in Jira, you can filter reports by the reporter field to track issue submissions per team member. This helps you see who is creating work, resolving tasks, and how quickly they respond.
Jira provides reporting features that allow you to analyze:
These insights can help engineering managers like yourself identify workload distribution, track responsiveness, and spot issues with team collaboration. Instead of guessing who is overloaded or where delays happen, you get real-time data to support better team decisions.
Jira floods you with data, but Axify gives you real-time data that drives action. Instead of sifting through endless reports, you get an easy-to-read dashboard with views at the team, multi-team, and organizational levels.
Here's what Axify offers that's better than Jira:
In addition, we have engineering-specific integrations tailored for tracking DORA, flow, and SPACE metrics without the complexity of traditional project management tools like Jira.
Axify helps you track productivity trends without drowning you in unnecessary data.
Stop guessing and start making data-driven decisions. Book a demo today to see how Axify can transform the way your team tracks performance.
Metrics in Jira are data points that help you track progress, productivity, and efficiency within your projects. You can measure sprint progress, issue resolution times, and workflow bottlenecks using Jira's built-in reports.
You can measure performance in Jira by tracking Agile software development metrics such as velocity, cycle time, and change lead time. Jira’s reports allow you to filter by issue type, sprint, or team to help you analyze trends and make improvement plans.
Jira offers various analytics tools, including burndown charts, cumulative flow diagrams, and velocity reports. However, its analytics focus on task tracking rather than high-level business metrics, making it harder to get a complete picture of team culture and long-term performance trends.