DevOps
15 minutes reading time


Slow software deliveries frustrate your team and delay customer satisfaction. Many teams struggle with bottlenecks, inefficient handoffs, and poor visibility across the software delivery process.
That’s where a solid DevOps value stream makes all the difference, with complete visibility into activities that transform ideas into a finished product.
If you’re ready to tackle these challenges and maximize your software delivery efficiency, you’re in the right place. This guide explores how to map value streams, best practices, and other crucial details to help your team optimize workflow.
So, let’s begin!
In DevOps, a value stream represents the entire sequence of activities involved in delivering software as a product or a service to customers. This includes all steps, value-adding and non-value-adding, across the software development lifecycle (SDLC), from initial concept to production.
Value streams break down functional silos to create continuous value flow across teams. Instead of stop-start workflows, they connect development, testing, and deployment into a seamless pipeline. This cross-functional collaboration optimizes delivery speed, improves efficiency, and aligns teams around delivering customer value, not just completing tasks.
The CI/CD pipeline is a clear example of a value stream in DevOps. It captures how activities flow from ideation to delivering a functional product to end users.
During this flow, cross-functional teams—developers, testers, and operations—work together to ship high-quality software efficiently. Each stage contributes to delivering real user value, not just completing tasks.
The main stages include:
The following section will introduce a detailed template for creating your value stream map.
Value streams are essential for delivering value to customers sooner and more consistently, which is done by:
A Medium article sheds more light on how value streams benefit the entire system:
Value stream maps are built on three essential pillars: information, product, and time ladder. As Team Asana explains, “A value map may not be helpful if you’re trying to solve a problem that has no relation to information, product, or time flow.”
Each factor plays a critical role in visualizing how work moves through the software delivery process:
For effective value stream management, follow these steps outlined by the experts at Axify:
The first task is to decide which value stream you want to map. Is there a specific product, service, or process that could benefit from streamlining, like your deployment pipeline or backlog refinement? Focus on areas slowing things down or where even small improvements could make a noticeable difference.
Once you’ve chosen your value stream, it’s time to bring the right people together, such as:
Having everyone in the same room—or at least looking at the same dashboard—makes it easier to connect the dots, build alignment, and ensure every team knows how their work fits into the bigger picture. Plus, it opens up valuable lines of communication to uncover pain points you might not have noticed before.
With your team assembled, the next step is to break the value stream into manageable pieces. Consider dividing the process into 5 to 15 key blocks, each representing a step that delivers value.
For every step, document what happens and who’s responsible. You must also track key metrics like:
Flow metrics provide insights into how efficiently work moves through your value stream. They measure delivery speed, throughput, and quality to help teams identify barriers and improve processes.

Key flow metrics include:


%20in%20Axify.webp?width=1920&height=1440&name=work%20in%20progress%20(WIP)%20in%20Axify.webp)
![]()
DORA (DevOps Research and Assessment) metrics are industry benchmarks that assess the performance of DevOps teams.
These include:


The % Complete/Accurate metric measures the proportion of work passed between stages without requiring rework or corrections. It’s an indicator of process quality and handoff efficiency.
For example, if 80% of tasks move from testing to deployment without issues, the %C/A for that stage is 80%. A low %C/A suggests poor quality or unclear requirements, which can lead to inefficiencies and delays.
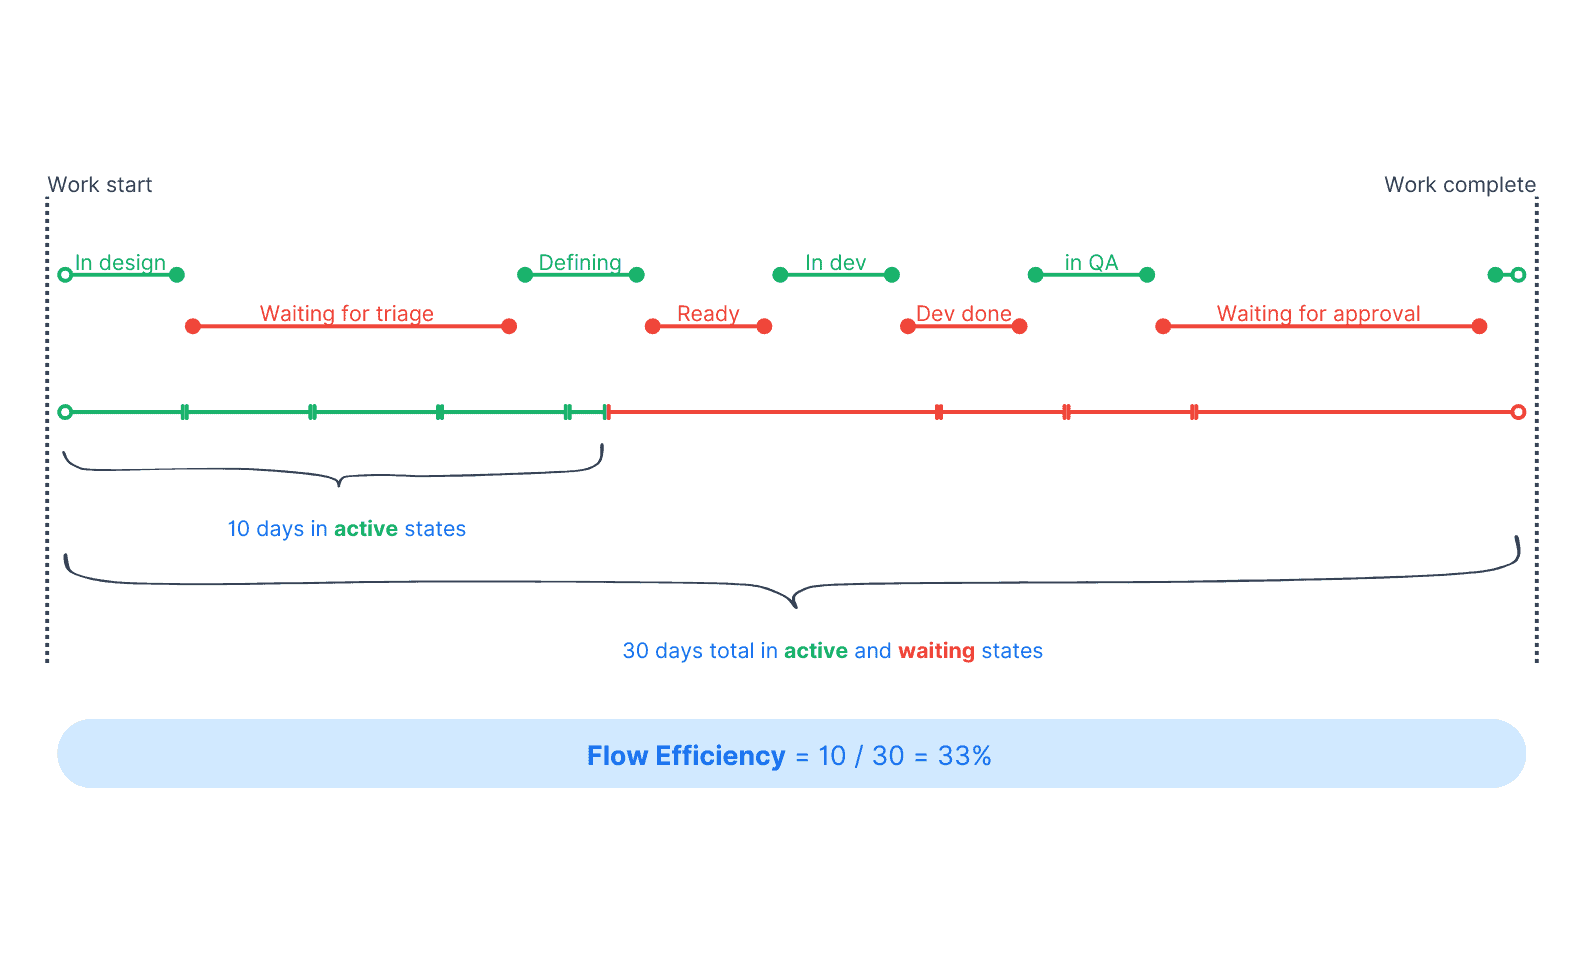
Value-added time is the amount of active time you spend on tasks that directly contribute to delivering value to the customer. It excludes waiting periods, unnecessary steps, or any activity that doesn’t enhance the end product.
Once the current state map is complete, analyze it to identify inefficiencies and waste.
First, analyze how quality issues accumulate across different stages. Instead of viewing problems in isolation, you see the cumulative impact.
For example, let’s say each step in a six-stage process has a 90% success rate (meaning 10% of work items have defects). Since there are six stages, the probability of an item passing through all stages without defects is:
Pfinal = Pn stage
Pfinal = 0.906 = 0.5314
By the end of the process, only about 53% of the work will have passed through without encountering any quality issues.
This highlights why early-stage improvements compound and why a strong quality focus at every step is essential.
So, the next thing to do is look for bottlenecks, redundant steps, or delays in the workflow. For instance, long review times could delay deployments, and frequent handoffs between teams might create unnecessary idle time.
To address these issues, consider streamlining the review process by automating code reviews or setting clear timelines for feedback. In addition, reducing the number of handoffs between teams can minimize idle time.
This might involve cross-training team members to enhance flexibility and collaboration across the development value stream.
After analyzing the current state of your value stream, the next step is to envision a future state that eliminates inefficiencies and improves flow. However, optimizing every part of the process at once isn’t practical—value streams are interdependent systems, and improving one area in isolation might not enhance overall performance.
Instead, take a systematic approach:
To guide your team in designing an improved value stream, ask:
By following this constraint-first approach, you optimize for value delivery, not just process tweaks—ensuring real, measurable improvements rather than just moving inefficiencies around.
Want to streamline your value stream mapping? Use our customizable template as a starting point to visualize and optimize your processes effortlessly!

Templates can be helpful, but why settle for a static document when you can visualize your entire development cycle in real-time?
Axify’s Value Stream Mapping (VSM) tool takes the guesswork out of process optimization by giving you a clear, data-driven view of how work flows through your team, from planning to delivery.
Why choose it?
Some key strategies to implement effective value stream mapping efforts include:
Don’t get caught up chasing perfection. Value stream maps are meant to provide clarity, not exact precision. Instead of stressing over whether a step takes 15 minutes or an hour, focus on the bigger picture.
For instance, if the next step has a 4-day delay, that’s where your attention should go. The real issue lies in these major bottlenecks rather than minor differences in touch time.
Prioritize identifying areas where inefficiencies or poor quality disrupt the flow of your entire value stream. The key is to use rough estimates. They’re more than enough to highlight the main problems, and you can then refine the details as you iterate over time.
Metrics are the backbone of effective value stream mapping. Every step in your development value stream should connect to measurable outcomes that reveal whether it’s running efficiently or causing delays.
These numbers also help you uncover where things are slowing down or where waste is building up in the process. For example, tracking how long it takes for a pull request to move from submission to approval can reveal delays in code review. If reviews consistently take days due to resource constraints or unclear criteria, it’s a clear sign of a bottleneck.
Addressing these delays ensures smooth team handoffs and keeps your development value stream flowing efficiently.
Value stream maps shouldn’t be a one-and-done exercise. Treat them as living documents that evolve as your software development process grows. Your development, product, and security teams will encounter new challenges as projects progress, so your map should reflect those changes. Regularly review new stream improvement opportunities and update your processes accordingly. This iterative approach is key to aligning with your business strategy and achieving continuous improvement.
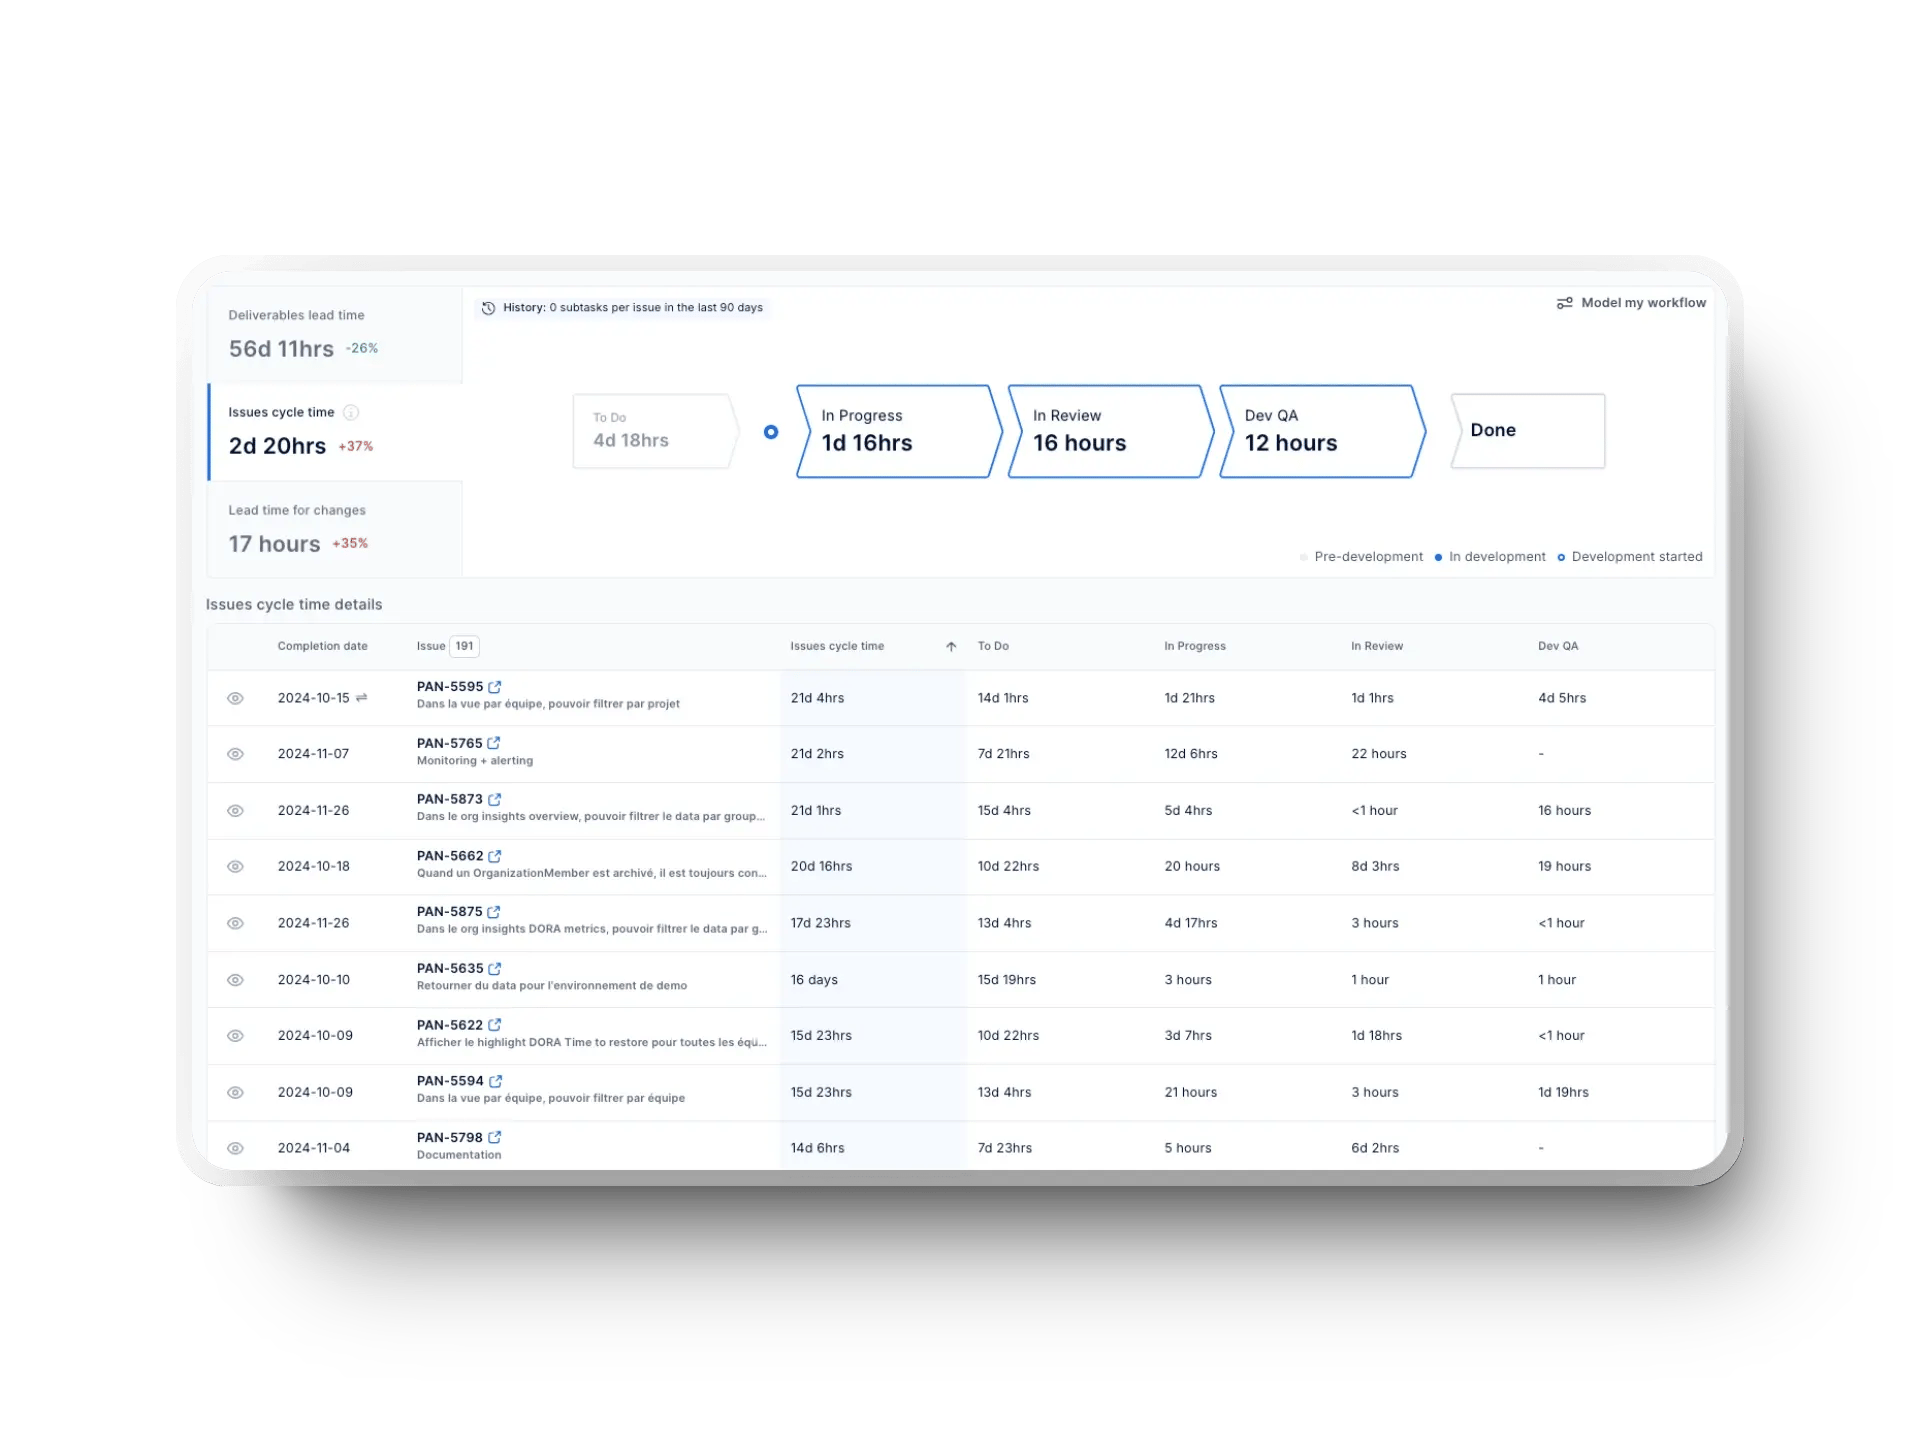
Tracking and optimizing value streams manually can quickly become overwhelming, especially when managing complex workflows and metrics. That’s where tools like Axify come in with a more thoughtful, streamlined way to monitor metrics and enhance your development value stream.
For tracking and continuous improvement, it offers dashboards like:
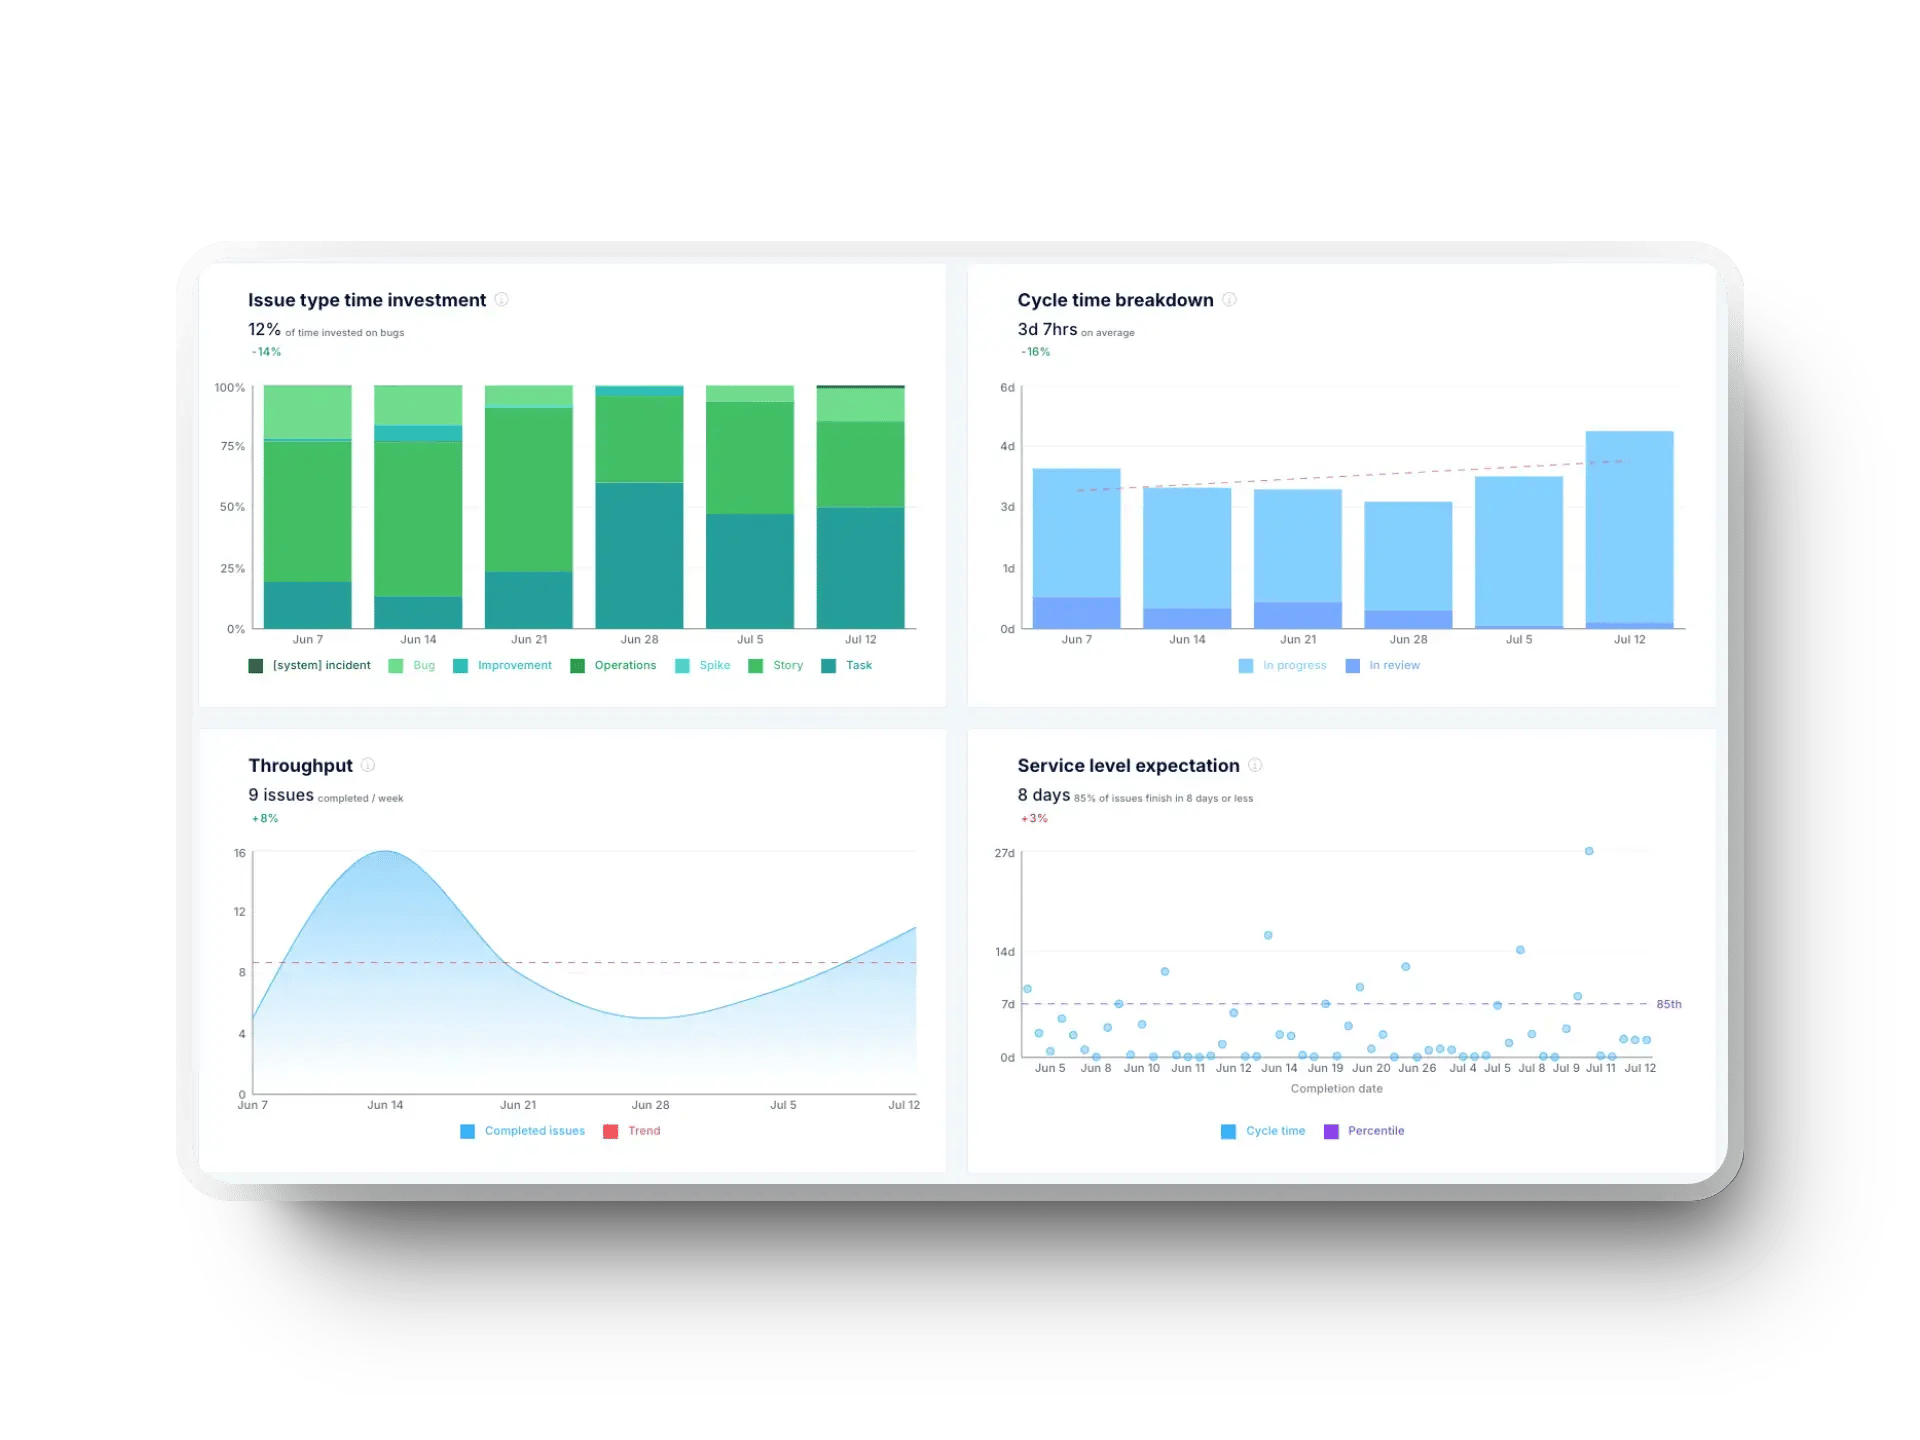
With a focus on aligning development activities to corporate goals, the software engineering metrics dashboard delivers clear resource allocation insights while tracking engineering metrics. This approach keeps your teams focused, efficient, and committed to continuous improvement.
This dashboard comprehensively tracks DORA metrics, giving your team a clear view of trends, bottlenecks, and successes. Whether you're presenting to stakeholders or reviewing progress internally, Axify makes it easy to monitor performance and identify areas for improvement.
Of course, you can use the Value Stream Mapping feature to visualize your entire workflow with detailed maps.
Optimizing your value stream isn’t just about drawing out workflows; it’s about finding inefficiencies, eliminating wasted time, and ensuring that every step in your software delivery process brings value.
Axify supports you through this journey with real-time tracking, intuitive dashboards, and seamless integration with tools like Jira and GitLab. From operational to digital value streams, it empowers your team to make smarter decisions, improve collaboration, and deliver high-quality software faster.
Ready to see the difference? Book a demo with Axify today!
