Git Analytics tools offer insights into developer activity, pull request trends, and repository health, but their effectiveness depends on how they’re used.
The question is, are they really measuring engineering efficiency or just tracking surface-level metrics?
Relying too heavily on Git-based metrics without context can result in misleading insights and even incentivize the wrong behaviors.
This article is for you if you’re ready to examine Git Analytics tools critically and separate valuable insights from misleading metrics. We’ll discuss where these tools add value, where they fall short, and how to focus on metrics that genuinely improve engineering efficiency.
Let’s begin.
What Is Git Analytics?
Git Analytics refers to a category of analytics tools that extract, process, and analyze developer activity based on Git metadata, including:
- Commits
- Pull requests
- Code changes
- Review comments
These tools focus on what can be measured rather than what should be measured to honestly assess developer productivity, code quality, and team efficiency. This distinction is critical; just because a metric can be tracked doesn’t mean it provides meaningful insights.
For example, a low rework rate usually signals well-planned code, but it could also mean a lack of iteration and experimentation.
Many engineering organizations adopt Git Analytics tools to optimize developer productivity and reduce engineering inefficiencies, yet the effectiveness of these insights remains mixed.
Git Analytics Benefits – Are They Really That Useful?
Git Analytics tools promise data-driven analysis of software development processes. Tracking development metrics helps engineering leaders and product teams identify inefficiencies. Solving these issues enables you to improve code review processes and optimize efficiency.
But how useful are these tools in practice?
Let’s look at what they claim to do and where their limitations lie.
Valid Use Cases
With Git Analytics tools, your team can pinpoint bottlenecks in the development pipeline by analyzing key metrics such as:
- Pull request pickup times
- Review comments per pull request
- Merge rates
Example: If pull request review times are consistently long, this may indicate a development workflow issue that must be addressed, such as overloaded senior developers or inefficient review processes.
High Activity ≠ High Productivity
One of the most significant drawbacks of Git Analytics is the assumption that high activity means high productivity.
You may look at Git metrics as indicators of developer performance. But these numbers rarely tell the whole story regarding how value is flowing. For example:
- Many lines of code could be unnecessary bloat instead of well-structured, efficient solutions.
- Someone pushing tons of small commits per day isn’t necessarily making meaningful progress.
- Too many pull requests merged could mean rushed reviews, and technical debt is piling up.
Note: Without proper context, Git metrics can easily be misinterpreted, leading to micromanagement, misguided performance tracking, and unhealthy developer rewards that prioritize activity over meaningful contributions.
Best Git Metrics to Track – And What to Avoid
Let’s break down the key Git Analytics metrics worth tracking and the ones that might do more harm than good.
Good Git Metrics (More Context-Driven and Useful)
The following metrics can help your dev teams improve performance while keeping code quality, collaboration, and product impact in focus:
1. Cycle Time
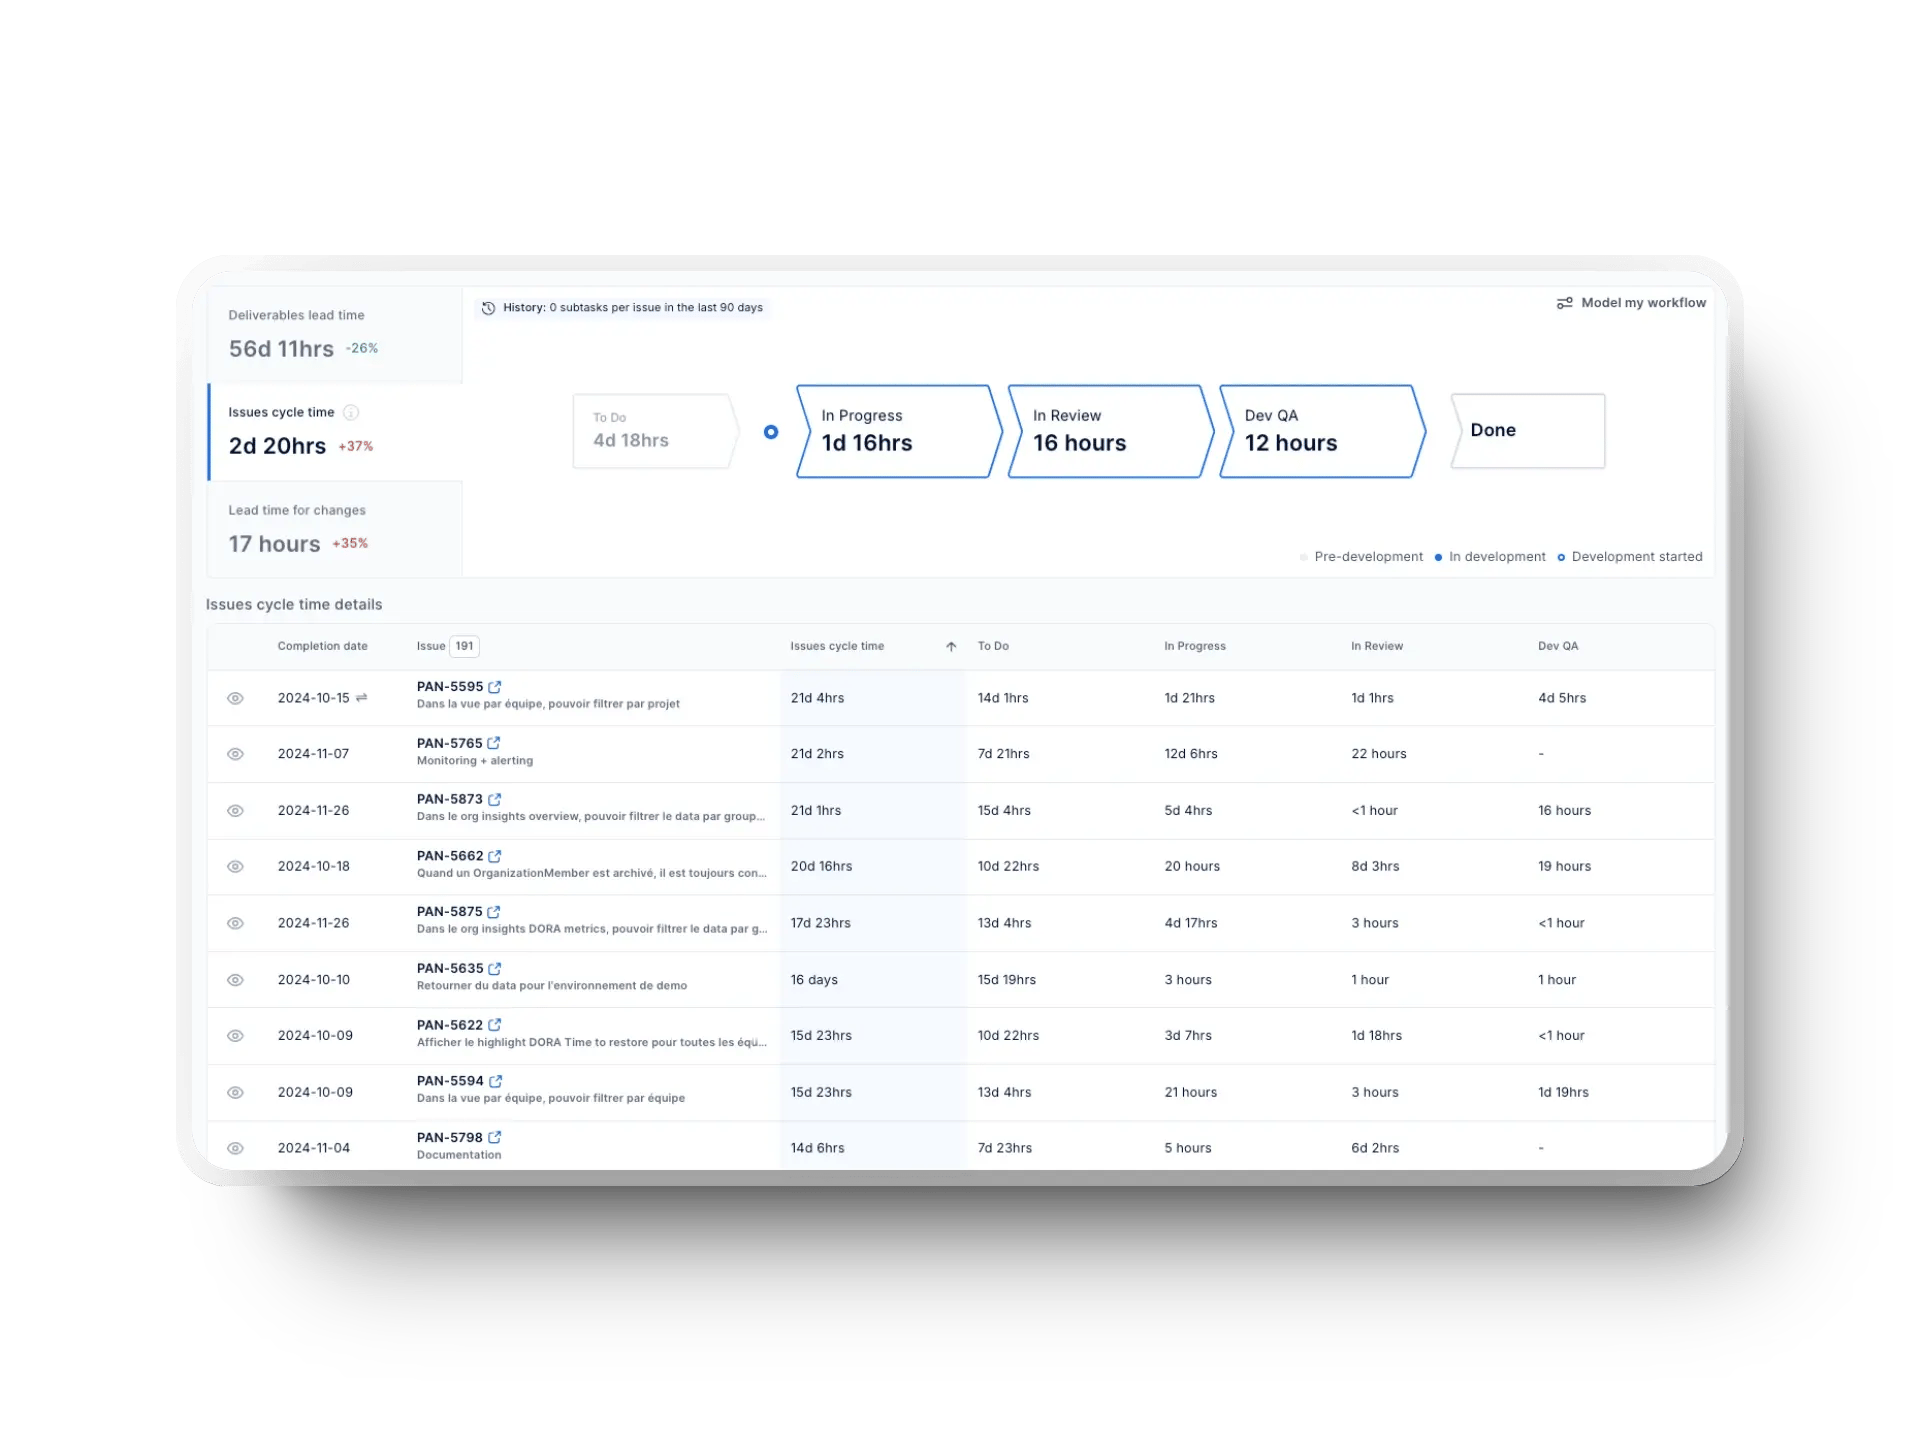
Cycle time tracks the duration from when work begins on a task to when it's completed. It is a crucial metric for understanding bottlenecks, but its value depends on the context of the development process. Combined with process analysis, cycle time identifies patterns your team can analyze. By breaking down each stage of the development pipeline, you can gain actionable insights into software development processes.
For example, a spike in cycle time for bug fixes could suggest deeper technical debt rather than isolated issues. Or inconsistent cycle times across sprints might point to fluctuating workload distribution or unclear requirements.

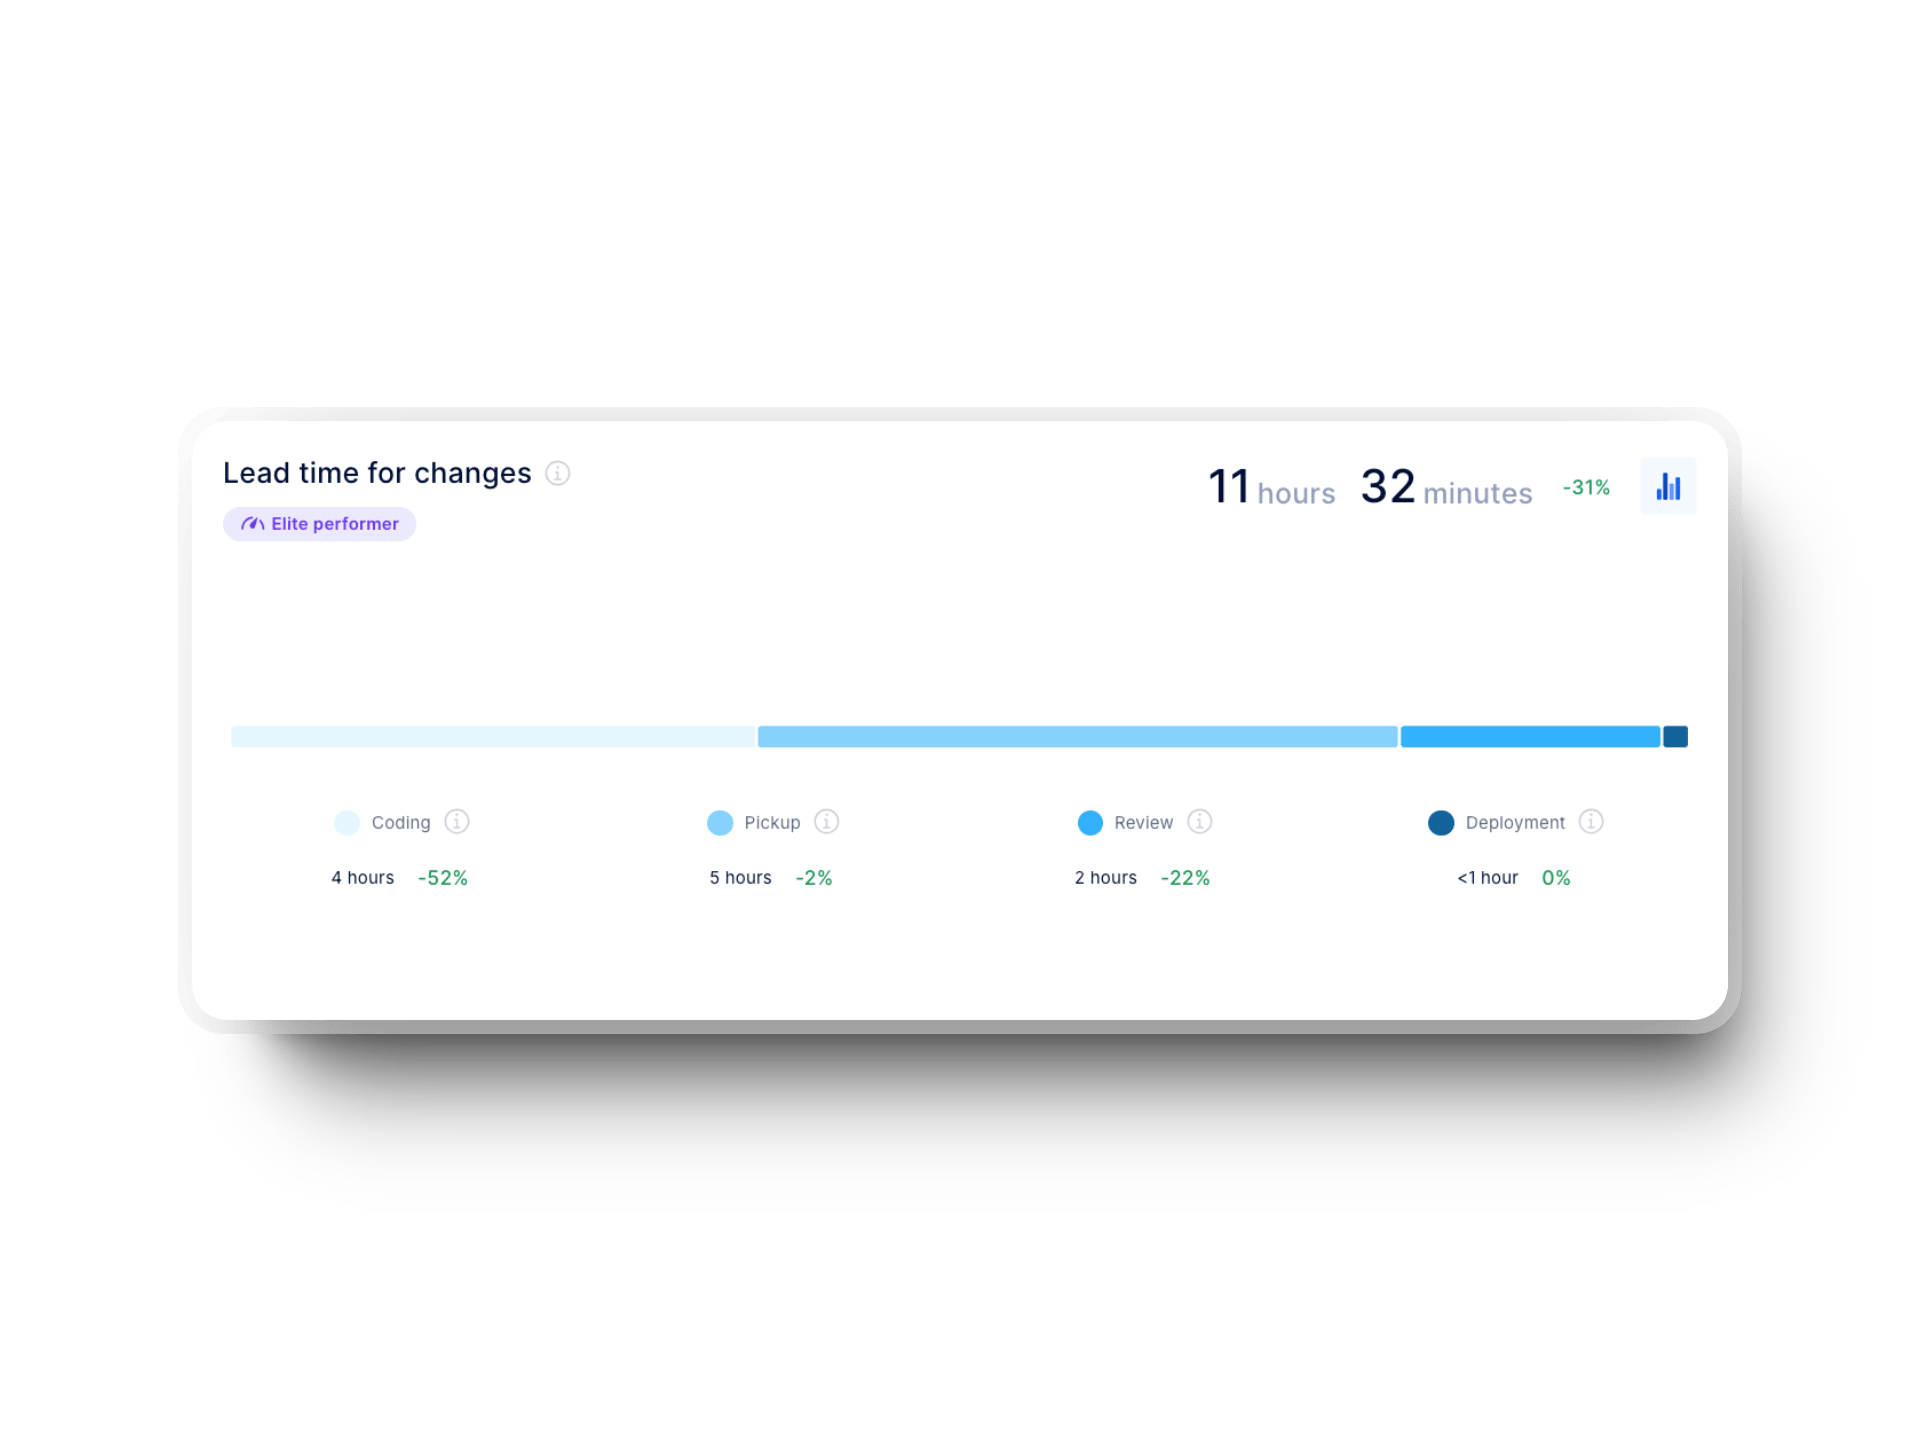
2. Lead Time For Changes
It is a DORA metric that measures how long it takes for a code change to go from the first commit in the development environment to being successfully deployed in production. This metric helps you track the speed of your delivery pipeline while ensuring that code quality remains high.
With lead time for changes, your team can track whether you’re achieving faster code delivery cycles while maintaining a high bar for code quality or whether improvements are needed.
3. Investment Distribution
Investment distribution is a valuable metric that can assist your team in balancing time spent on feature development, refactoring, and maintenance work. It is essential for avoiding technical debt accumulation. Moreover, combining it with commit history and rework rates provides a complete picture of where your engineering team is spending their efforts.

4. Work in Progress (WIP) Limits
Too much work in progress can slow your team down. Thus, setting WIP limits is crucial so developers can focus on single tasks to reduce context switching and increase code review efficiency. If you’re unsure how to set good WIP limits for your team, a good rule of thumb is the number of team members -/+ 1.
%20in%20Axify.webp?width=1920&height=1440&name=work%20in%20progress%20(WIP)%20in%20Axify.webp)
Misleading Git Metrics (and Why They’re Problematic)
Some Git metrics may seem helpful initially, but can encourage bad practices without proper context. They include:
1. Code Churn
Code churn refers to the percentage of code rewritten, modified, or deleted shortly after being committed. It typically indicates code instability or frequent rework within a development cycle.
However, not all churn is bad—some level of rework is natural during active iteration, particularly when teams refine new features or address feedback from code reviews.
Remember: While Agile encourages iterations, most iterations should ideally happen before code is merged, rather than through excessive rework. In well-structured development cycles, necessary iterations should be managed through feature flags, branching strategies, and pre-merge reviews rather than post-commit changes.
That said, instead of assuming all churn is negative, evaluate its cause: is it due to poor planning, unclear requirements, rushed pull requests, or essential refactoring? Healthy development workflows should minimize unnecessary churn by prioritizing well-defined tasks, thorough code reviews, and clear communication.
2. Commits Per Developer
This metric rewards quantity over quality, leading to a culture where developers push frequent, low-impact commits to appear productive. Rather than emphasizing daily commits, evaluate the merging of pull requests, review comments, and actual contributions to meaningful product increments.
3. Lines of Code Written (LoC)
More lines of code don’t mean better code quality. It could mean inefficient implementations. So, your focus should be on code readability, maintainability, and refactor rates rather than increasing the number of LoCs.
4. "Impact" Scores Based on Code Volume
Any metric that tries to quantify developer impact based on the amount of code written or changed is flawed. Remember, the best developers typically write fewer, higher-quality lines of code that require less rework.
How to Implement Git Analytics Without Misusing It
Git Analytics tools can be compelling, but only if used correctly. We have shared some key tips to use them effectively:
1. Track Team-Wide Trends, Not Individuals
Tracking productivity metrics at an individual level can create a toxic engineering culture in which developers feel pressured to manipulate the system rather than focus on meaningful contributions.
Instead, focus on team-wide patterns that reveal bottlenecks, inefficiencies, and collaboration gaps. We advise tracking engineering effectiveness using DORA metrics, flow metrics, and the SPACE framework. This will give you a holistic view of how work moves through the system.
Besides, Axify’s Value Stream Mapping (VSM) tool reveals areas of value loss that impact efficiency and delivery speed. It also gives solid improvement suggestions so you won’t have to micromanage individual contributors (e.g., monitor commits per developer).
2. Balance Git Metrics with Qualitative Developer Feedback
Git Analytics tools measure what’s quantifiable but don’t capture why things are happening. Take a high merge rate as an example. It might suggest fast development, but it could also mean superficial code reviews, pressure to close pull requests quickly, or a lack of thorough quality checks. All this leads to increased technical debt.
Therefore, we advise you always to gather input from developers. Git metrics alone can’t reveal whether code review efficiency—for example—is genuinely improving or if frequent rewrites are occurring due to unclear product requirements.
3. Let Teams Own Their Data
When Git-based analytics are used as a top-down surveillance tool, they create resistance rather than engagement. For example, if senior developers are the only ones interpreting Git Analytics data, junior developers may feel disconnected from development workflow improvements.
A better approach is to let every team analyze their trends by tracking Git-based metrics like pickup times, merge rates, and repository integration issues. While these provide a surface-level view of developer activity, they can lack the full context needed to drive meaningful improvements.
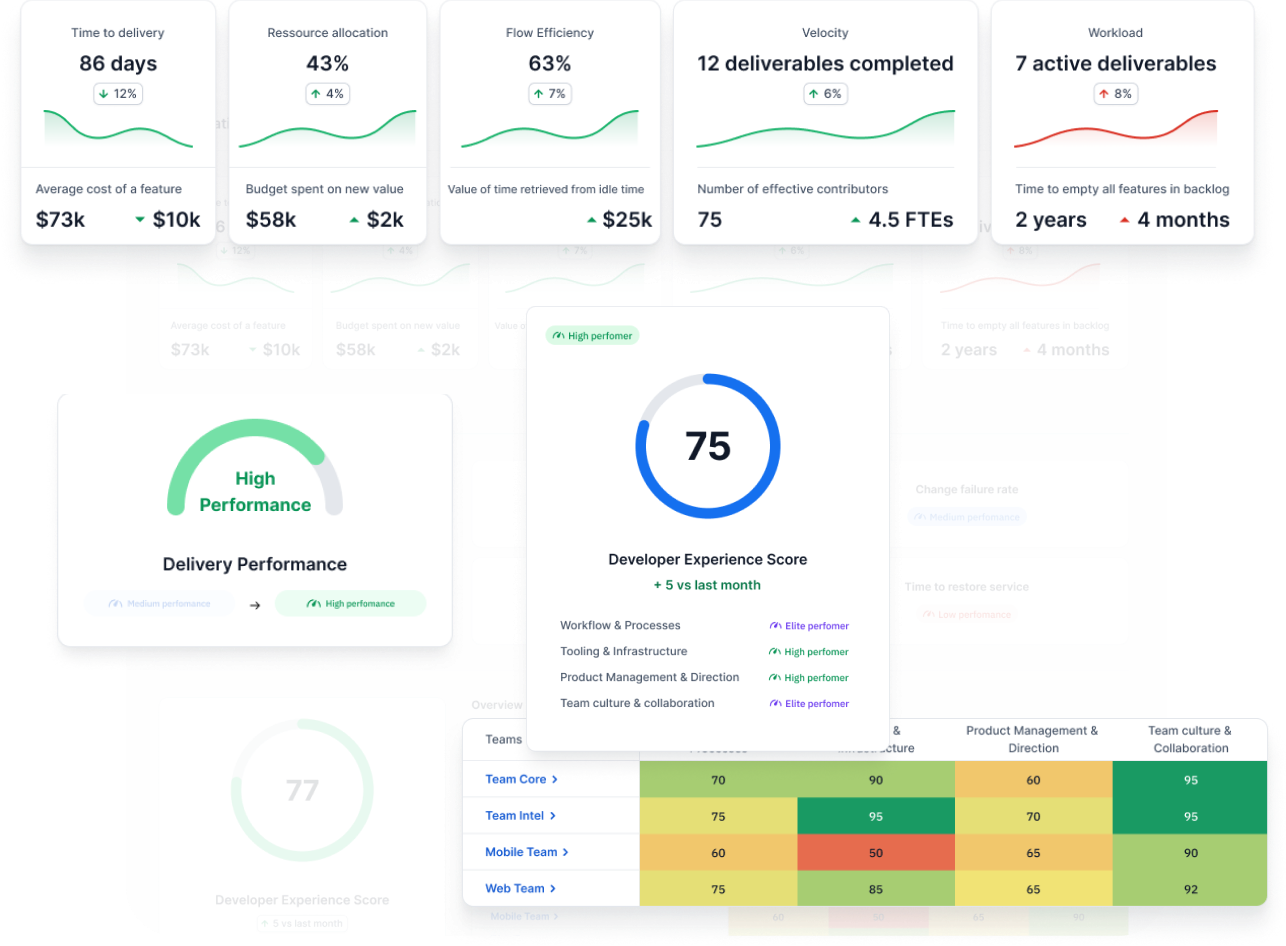
Even better, you can use Axify for team-level visibility. Axify has three views: team, group of teams, and organizational level. Plus, it reveals deeper workflow patterns so you can move beyond basic Git metrics and focus on optimizing actual software delivery performance.
4. Emphasize Conversations over Dashboards
Real improvements come from discussions, not just data points on a dashboard. While Git Analytics tools provide valuable insights into development processes, relying solely on numbers without team conversations can lead to misguided decisions.
If cycle times are increasing, don’t jump to conclusions. Instead, discuss with your team to identify the root cause of delays and make informed, actionable decisions.
Pro tip: Axify’s Software Delivery Forecasting tool can help you organize meaningful discussions around resource allocation, risks, and delivery estimates.
Best Alternatives to Git Analytics: What Metrics Actually Matter?
Git reporting tools are excellent for tracking development workflows but mainly focus on raw activity metrics, which don’t always reflect your team's efficiency.
So, what should you really focus on?
Let’s look at better alternatives that provide practical insights:
1. DORA Metrics
If you’re serious about tracking engineering efficiency, DORA (DevOps Research and Assessment) metrics are far better than generic Git Analytics tools. They measure how well your team delivers software to production, providing a clearer picture of development efficiency without encouraging counterproductive behaviors.
They include:
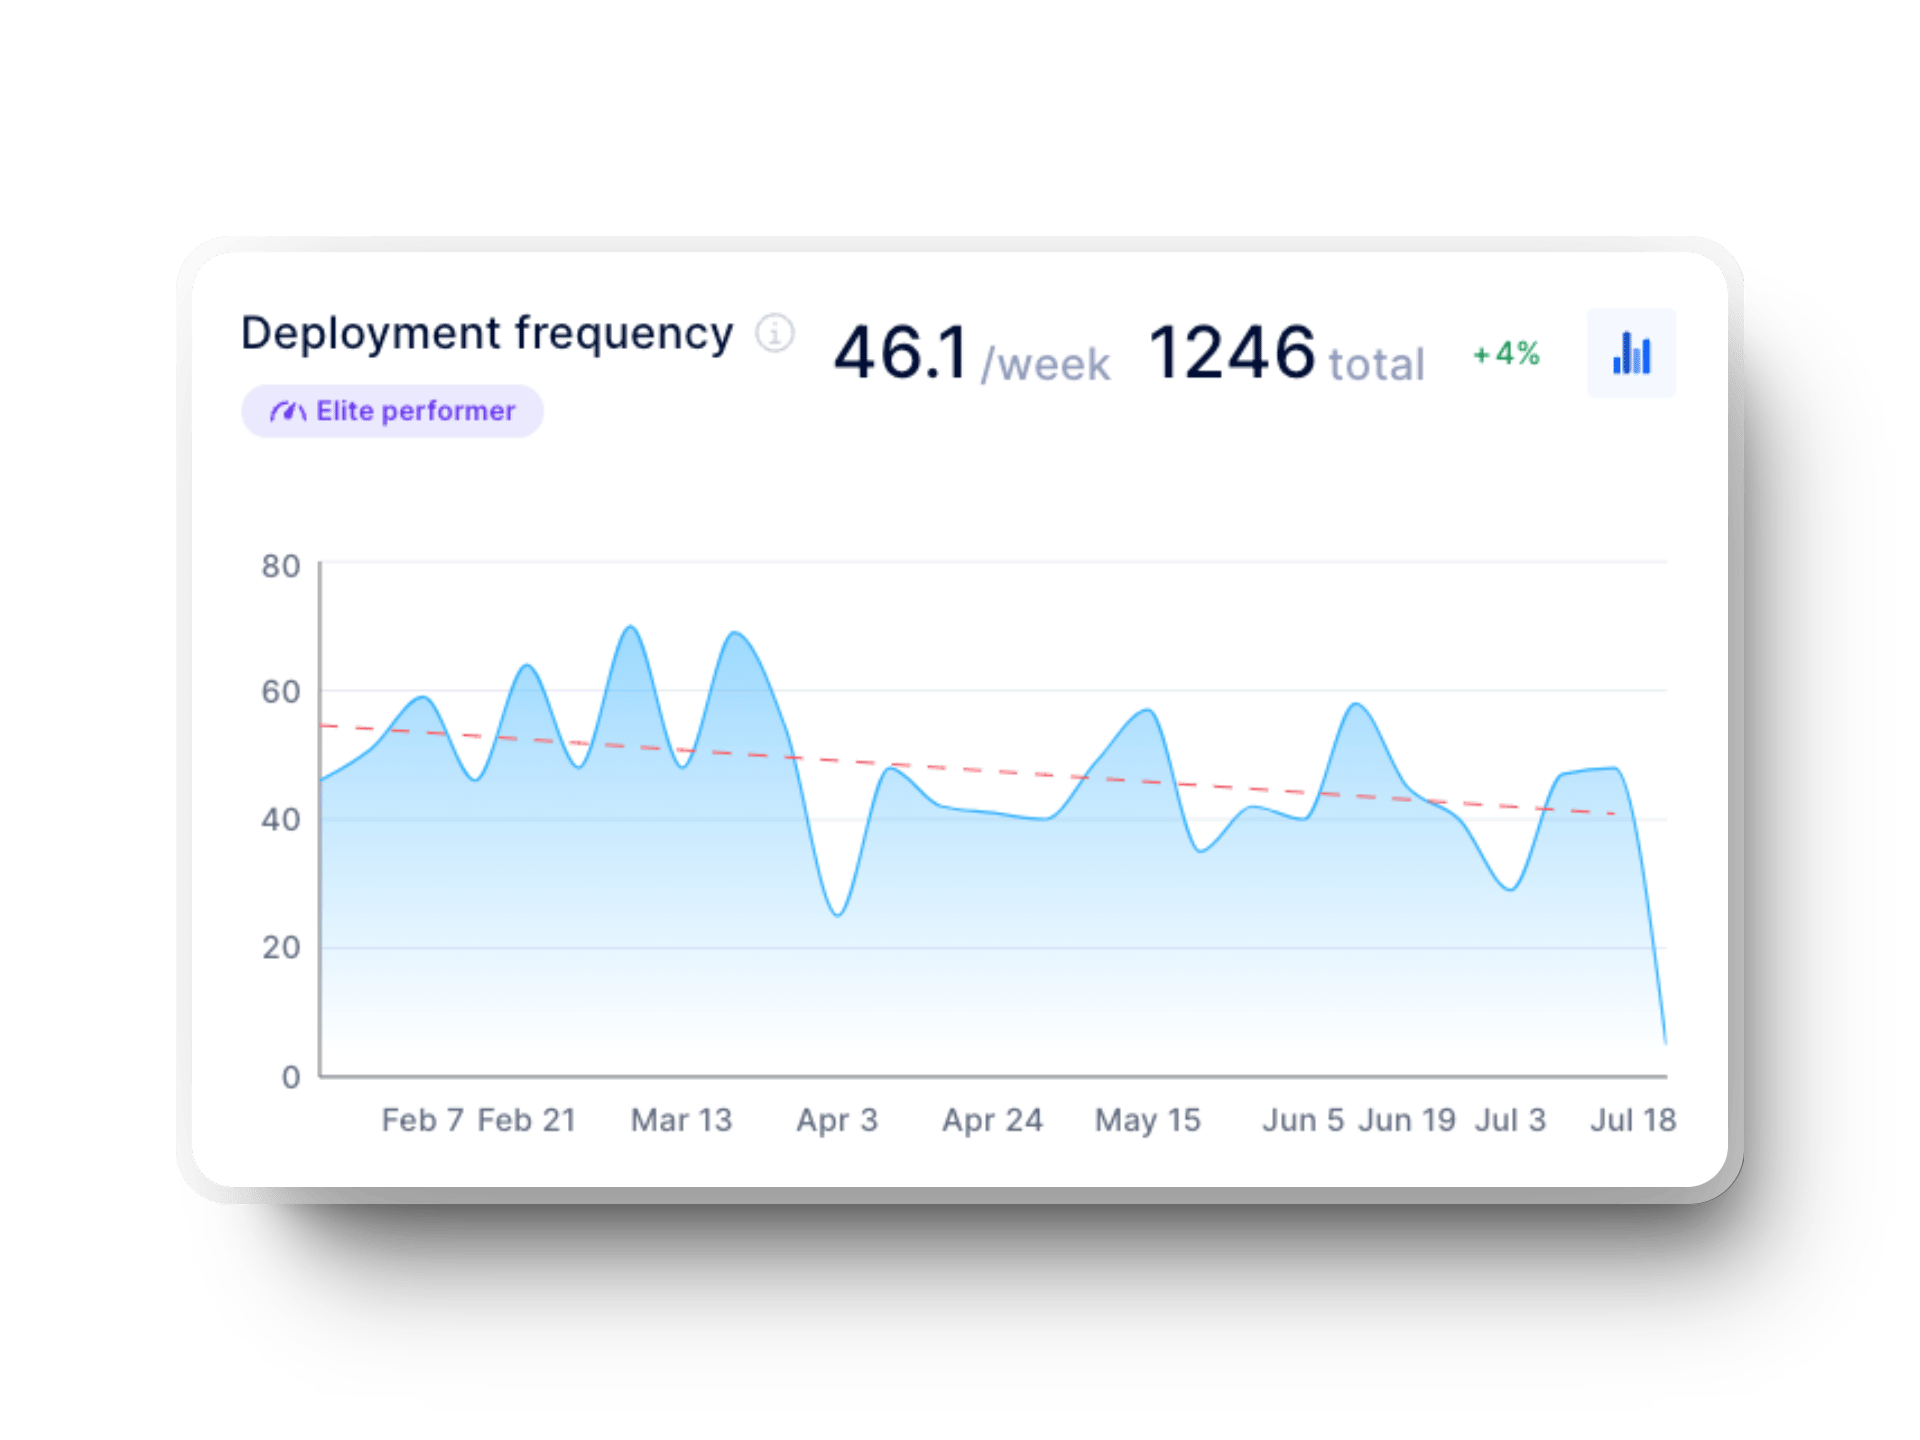
- Deployment frequency displays how often your team pushes code to production. High-performing teams deploy frequently to keep release cycles small and manageable.
- Lead time for changes tracks the time for a change commit to move through the development pipeline and reach production. It highlights your team’s development workflows and delivery speed.

- Failed deployment recovery time reflects how quickly your team resolves incidents. Aim for a low recovery time, which indicates strong operational resilience and efficient debugging workflows.
%20in%20axify%20for%20software%20development%20teams.webp?width=1920&height=1440&name=time%20to%20restore%20service%20(dora%20metrics)%20in%20axify%20for%20software%20development%20teams.webp)
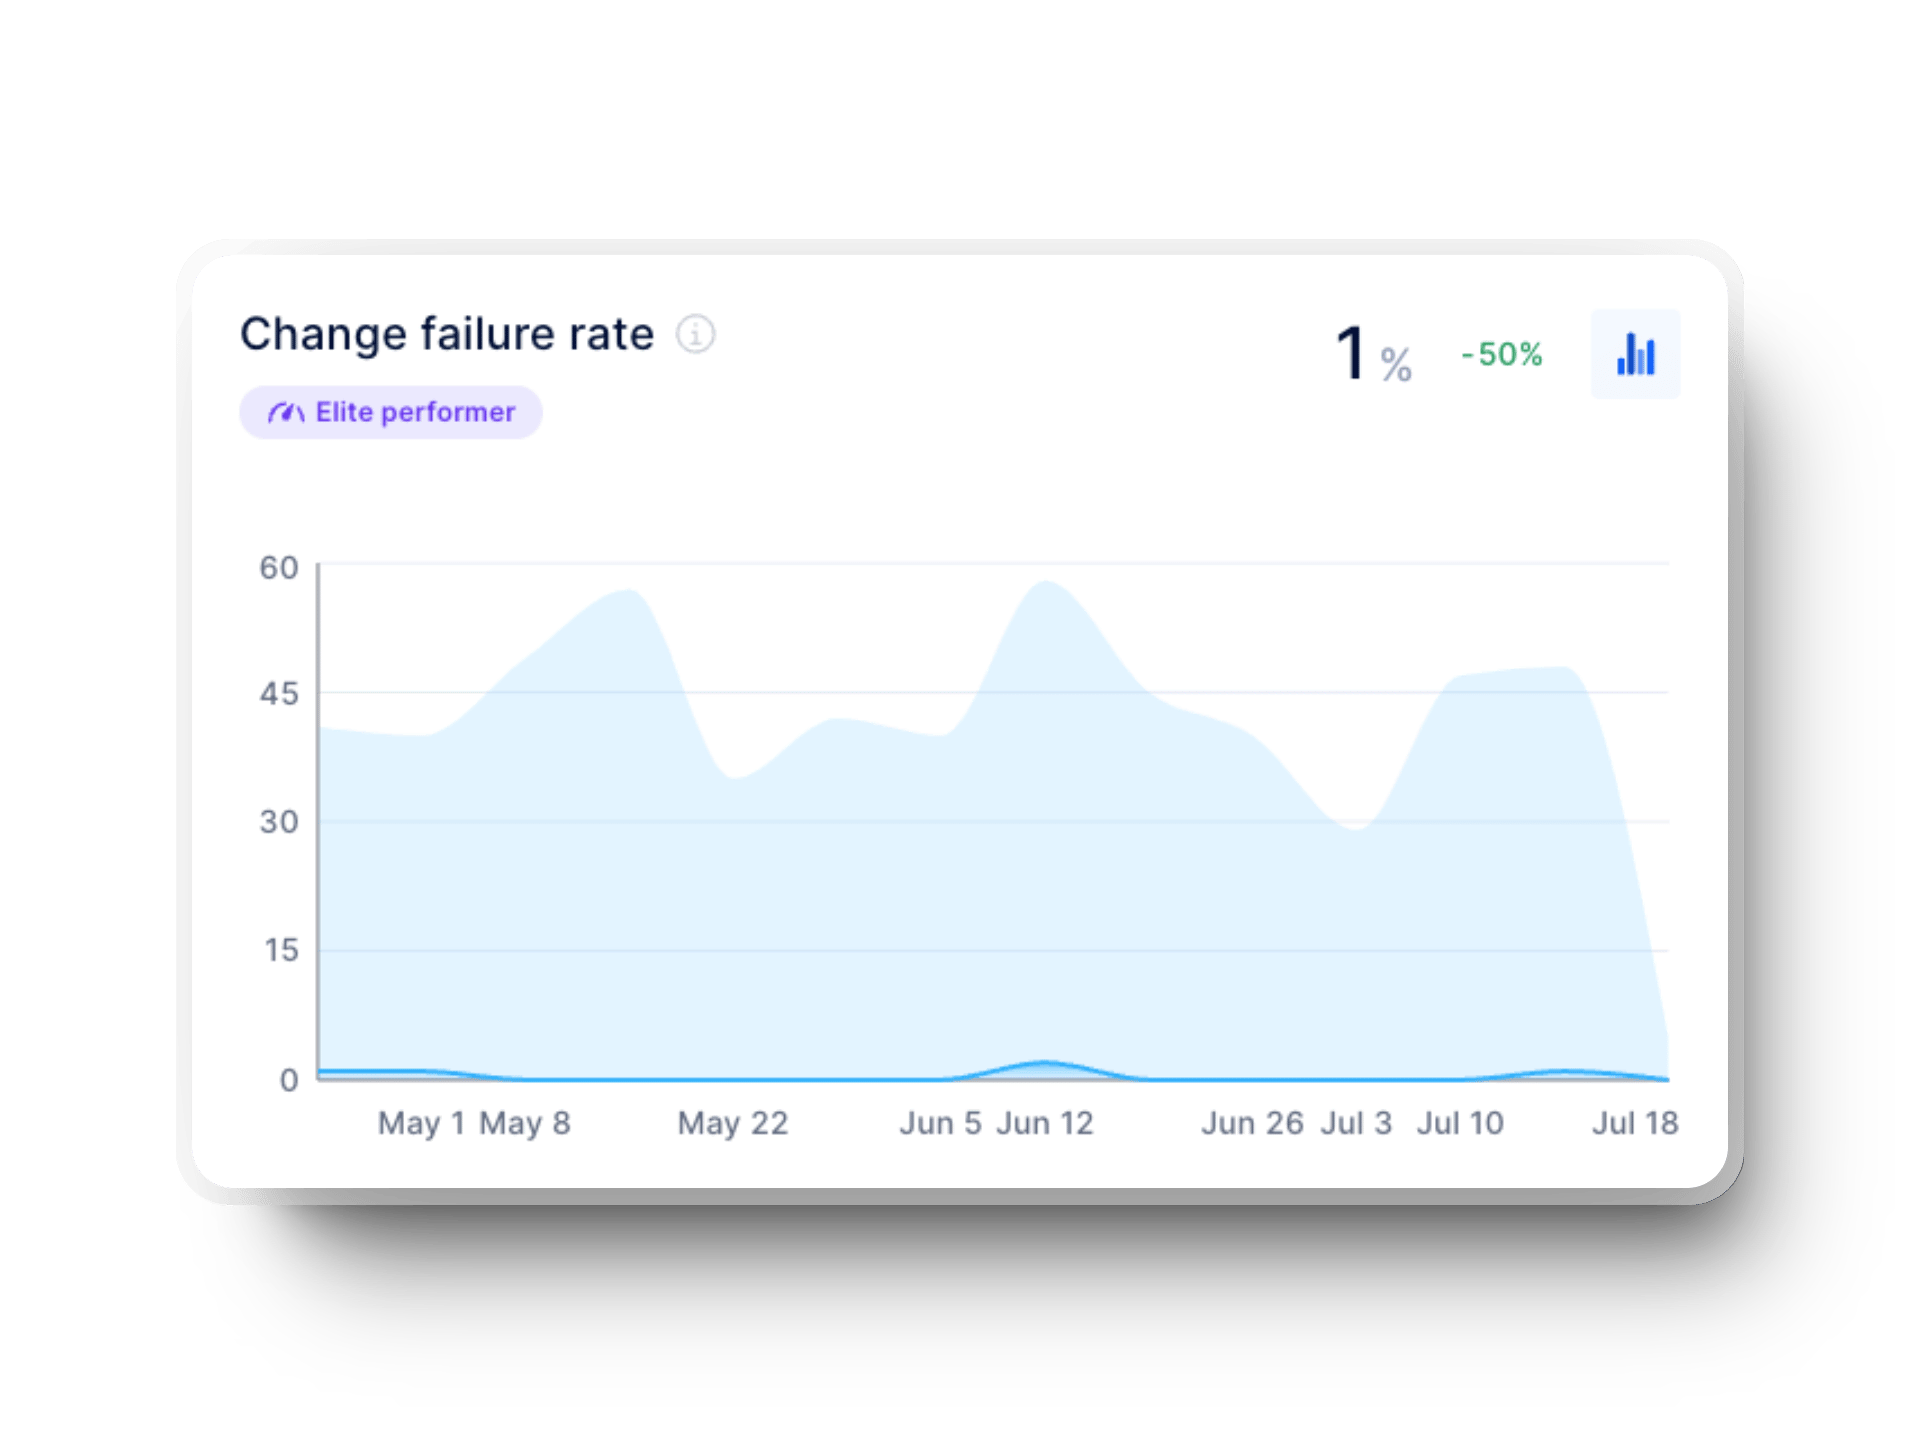
- Change failure rate shows the percentage of deployments that break and need fixing. A high change failure rate means something is wrong in your workflows, and you need to address the underlying issue. This could be rushed code reviews, unstable releases, or underlying technical debt.
2. SPACE Framework
Experienced engineers know that true productivity isn’t about writing more code. It’s about delivering impact, and that’s where the SPACE framework comes in.

This holistic approach considers multiple dimensions of developer effectiveness, including:
- Satisfaction and well-being: This dimension focuses on how engaged, motivated, and healthy developers feel. A positive work environment contributes to long-term productivity and retention.
- Performance: Evaluates how effectively a development team delivers high-quality software with minimal rework. A team that consistently produces stable, well-tested code demonstrates strong performance.
- Activity: Tracking development activities helps determine whether the work done actually contributes to meaningful progress. Simply measuring output without considering impact can lead to misleading conclusions. Instead, track pull request frequency, speed, and merge time to track workflow efficiency.
- Collaboration and communication: This dimension evaluates how effectively teams communicate, share knowledge, and collaborate to reach shared objectives. Metrics such as the frequency of cross-team discussions, pair programming sessions, and team perceptions of knowledge sharing show you good (or bad) collaboration efficiency. Even tracking the number of workflow interruptions can help assess team productivity.
- Efficiency and flow: Metrics in this dimension assess whether teams can move work smoothly through the development pipeline or if they frequently encounter bottlenecks. Identifying delays in the process allows you to optimize workflows and improve overall efficiency. Cycle time and deployment frequency are good examples of efficiency and flow metrics.
Insider tip: If you genuinely want to understand developer productivity, don’t rely on a single metric. Instead, track at least three metrics from three different SPACE framework dimensions to understand the context.
3. Flow Metrics
If your goal is to track development workflow efficiency without falling into the trap of micromanaging developers, flow metrics are a strong replacement for standard Git repository report tools. They show you how work moves through your pipeline and where things get stuck:
Here’s what to track:
- Flow time (Cycle time): It measures how long it takes for your software team to complete a task, from when work begins to when it’s finished. If you observe high cycle times, the problem could lie in long pull request approvals, deployment delays, etc.
- Flow velocity (Throughput): Measures the number of work items completed in a given period. It helps teams assess how much work they deliver over time.
- Flow efficiency: The ratio of active work time to total cycle time. A higher flow efficiency means less time is wasted in queues or waiting states.
- Flow load (Work in progress or WIP): Represents the number of active work items in progress. Keeping WIP manageable prevents bottlenecks and improves delivery speed.
- Flow distribution (Issue type time investment): Shows how time is allocated across different types of work (e.g., features, bugs, improvements, maintenance, etc.). Tracking this helps you balance priorities effectively.
It is interesting to note that flow metrics sometimes have proxies in other frameworks. For example, the image below explains how this applies in Axify:

Best Git Analytics Tools – If You Still Want One
Git Analytics tools can offer valuable insights, but it's essential to recognize their limitations. Not all of these tools delve into meaningful engineering metrics. Some merely provide basic data.
However, if you are seeking basic Git repository reporting to monitor activity within your repositories, several options are available, such as:
1. GitHub Insights
If your team works within GitHub, GitHub Insights is a solid option for monitoring repository health and team contributions. It provides detailed analytics on commits, pull request activity, and issue tracking, which helps you understand development velocity and constraints.
2. GitLab Analytics
We also suggest using GitLab Analytics as it provides more than just basic Git repository report tools. It gives detailed reports on merge request patterns and commit frequency, which is helpful if your team focuses on continuous integration and delivery (CI/CD).
3. Bitbucket Reports
For teams working within the Atlassian ecosystem, Bitbucket Reports is a natural choice for Git repository analytics. With seamless Jira integration, it offers insights into commit history, pull request activity, and other repository-based analytics to bridge the gap between engineering and project management.
4. Gitea Statistics
When a simple, self-hosted Git analytics solution is the priority, Gitea Statistics delivers basic repository insights without the overhead of cloud-based platforms. Although it lacks the advanced features of GitHub Insights or GitLab Analytics, it still covers crucial metrics and repository trends.
5. Azure DevOps Repo Analytics
If your team runs on Azure DevOps, its Repo Analytics feature is useful for getting detailed insights into repository activity, pull request efficiency, and team contributions. Since it integrates directly with Microsoft’s CI/CD pipelines, it’s a solid choice for enterprise software teams looking to optimize workflows and track development trends effectively.
Do You Really Need a Git Repo Report Tool?
If all you’re looking for is a Git repository report tool, platforms like GitHub, GitLab, and Bitbucket already have built-in reporting features that cover the basics. But let’s be honest; raw Git metrics alone won’t tell much about developer productivity, code review efficiency, or engineering inefficiencies.
To truly optimize software delivery, your focus should be on metrics that matter. That’s where Axify comes in! It emphasizes flow and real-world value delivery instead of commit stats.
Some of its essential features include:
- DORA metrics dashboard displays lead time for changes, deployment frequency, time to restore service, and change failure rate to optimize release cycles, reduce downtime, and enhance overall reliability.

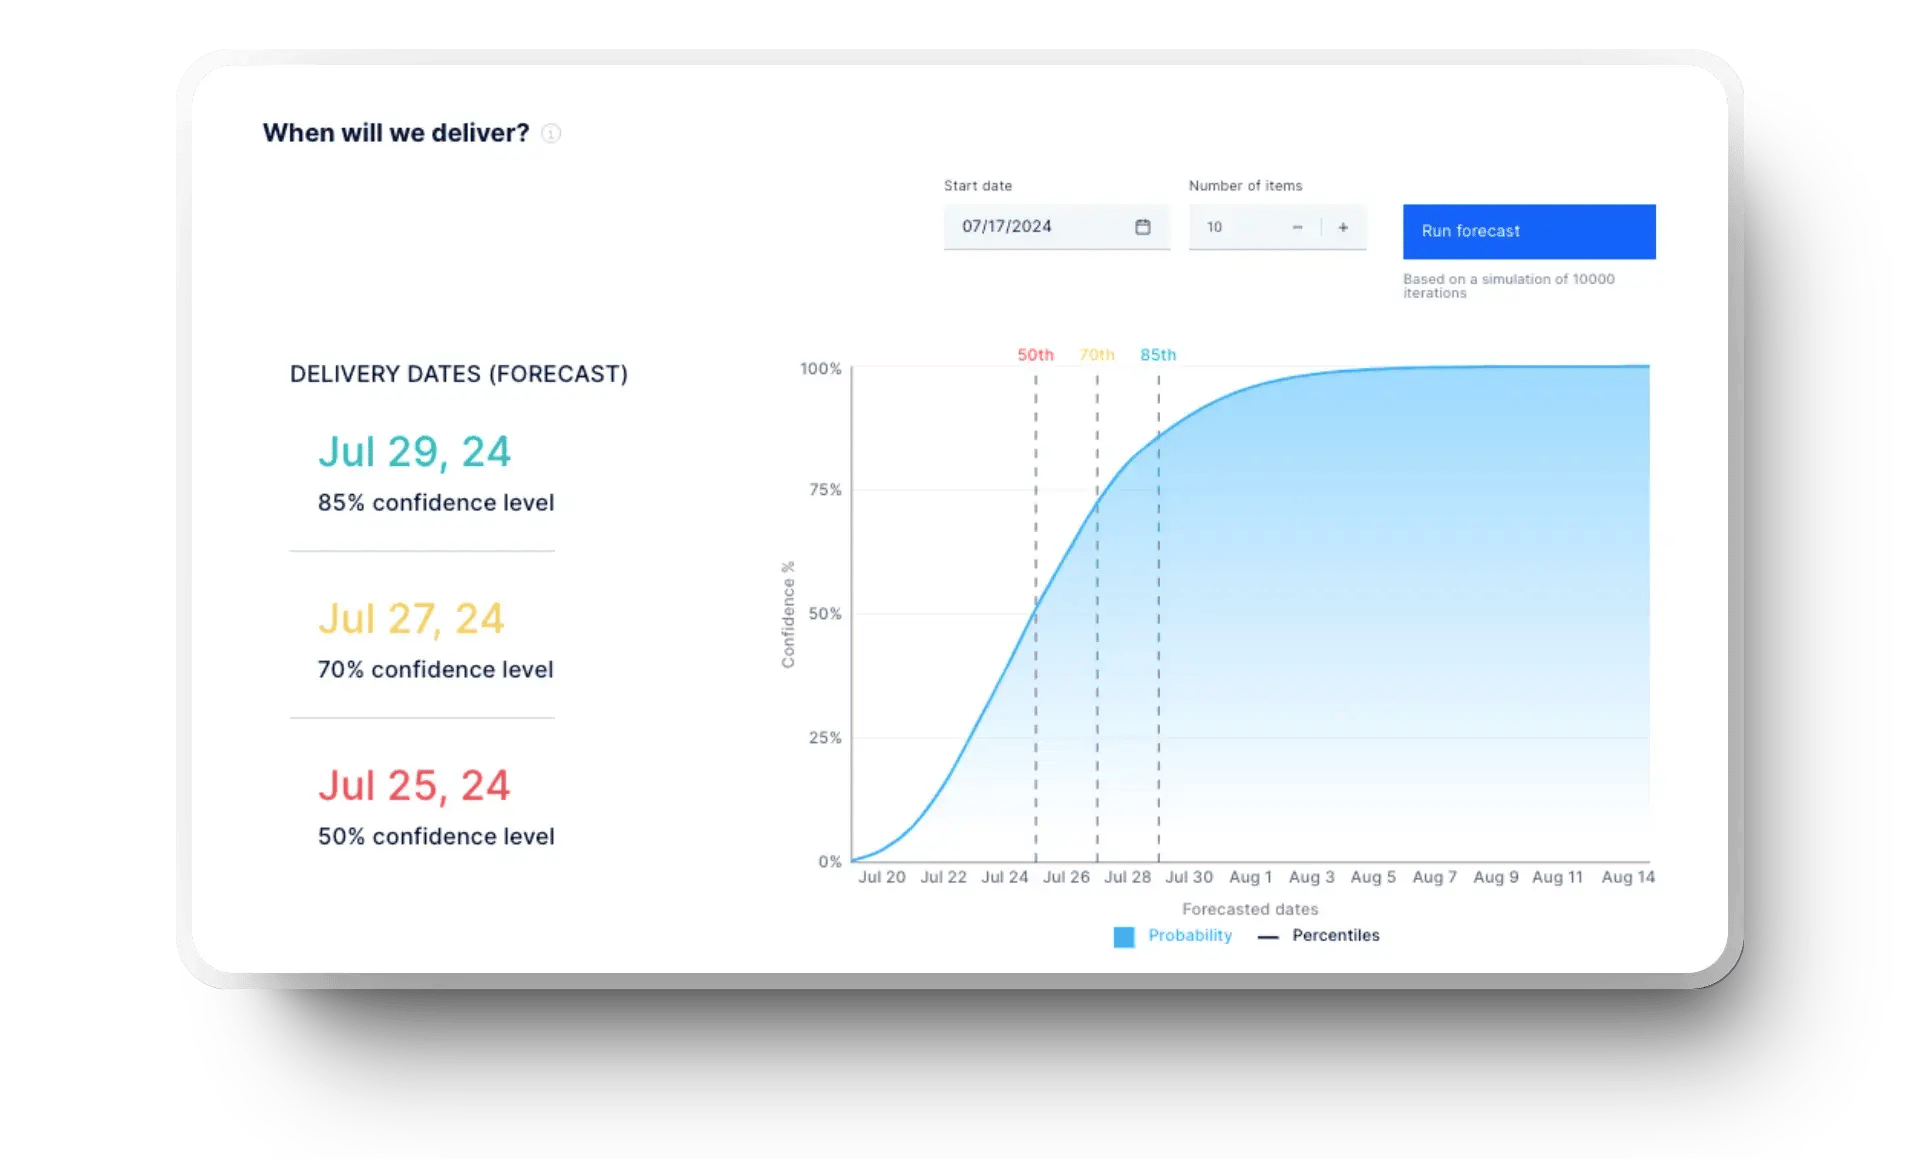
- Software delivery forecasting predicts delivery timelines based on historical insights to help you avoid last-minute surprises.
- Daily Digest Tool flags high-risk issues, slow-moving pull requests, and team blockers to make daily standups more productive.

- Value Stream Mapping (VSM) visually represents your entire development process, allowing your teams to quickly identify bottlenecks and resolve them promptly.

Conclusion: Focus on Value, Not Just Activity
At the end of the day, metrics should work for your team, not the other way around. Tracking commits per developer or pull request sizes might seem productive on paper, but they don’t reveal if your team is shipping better software faster.
Instead of getting lost in Git repo report tools, focus on outcome-driven metrics like cycle time, flow metrics, and DORA metrics that actually improve workflows and code quality.
Want to track the right metrics for your software development lifecycle? Axify has you covered! Book a demo now.
FAQ
What is Git analytics?
Git analytics refers to analytics tools that extract and analyze data from Git repositories to track developer activity, code quality, and team efficiency. These tools help measure software development workflows by evaluating commits, pull requests, review times, and repository health.
What are the metrics of Git?
Git metrics include pull request cycle time, review comments per pull request, merge rate, commit frequency, and rework rates.
What is Git Insights?
Git Insights is an analytics tool that provides data-driven reports on code review efficiency, repository activity, and development trends. It helps teams assess productivity and identify potential workflow bottlenecks within their Git repositories.
How to get data from Git?
Git repository data can be extracted using Git commands, Git reporting tools, or analytics platforms like GitHub Insights, GitLab Analytics, and Bitbucket Reports. These tools offer dashboards and reports that visualize developer activity, commit history, and repository performance.
What are the tests for Git?
Git-related tests ensure code quality, repository integrity, and smooth development workflows. Common tests include pre-commit hooks, static code analysis, automated CI/CD checks, and branch consistency checks. These tests help detect errors early and maintain a stable codebase.


.png?width=60&name=About%20Us%20-%20Axify%20(2).png)


