Delivery Performance
9 minutes reading time

.webp?width=1200&name=Axify%20blogue%20header%20(8).webp)
Why do some engineering teams struggle with slow deployments, unpredictable releases, and constant firefighting while others ship high-quality software smoothly and efficiently?
The difference isn’t just skill; it’s how they use data to drive decisions.
A data-driven engineering approach helps them improve software quality by tracking key performance indicators, analyzing real-time trends, and using predictive insights.
Are you curious about how data can improve your engineering processes? This guide explains useful metrics, actionable steps, and how to build a data-driven culture across the SDLC.
So, let’s begin.
Data-driven engineering is the practice of using key metrics and continuous feedback loops to get valuable insights. This helps you optimize software development even in complex systems.
Basically, engineering leaders need to make informed decisions based on data rather than intuition, which results in:
There are some fundamental differences between traditional and data-driven engineering approaches, which we have outlined below:
Traditional teams measure efficiency anecdotally, which makes it hard to pinpoint what’s working and what’s not. Consider a manager saying, “It feels like we’re moving faster.” But how fast?
Data-driven engineering removes this guesswork by letting you monitor metrics like DORA, flow, and SPACE metrics (e.g., PR review time, handoffs, or coding time). These give you clear, objective data on workflow performance.
In a traditional setup, bottlenecks become visible only when they become major issues, such as a last-minute deployment failure or a surge in bug reports.
Data-driven engineering flips the script using cycle time breakdowns, WIP, throughput, PR analytics, and more, to detect inefficiencies before they disrupt progress.
We encourage you to practice Value Stream Management to avoid bottlenecks and streamline your workflow.
Leaders struggle to justify decisions in poorly understood traditional engineering cultures. In many such setups, there is no tangible proof to support their reasoning.
A data-driven approach, however, relies on clear numbers that make it easier to communicate value to executives.
In conventional workflows, code quality is evaluated after failures happen, usually based on customer complaints or outages. This slows down innovation and increases technical debt.
A data-driven engineering process prevents this by continuously tracking software quality metrics. These include change failure rates, bug frequency, rework metrics, etc. The point is to spot trends and defects and solve them. That way, you can maintain quality before release.
Traditional performance metrics focus on individual productivity, such as the number of lines of code (LOC) a developer writes or the number of tasks they complete.
However, data-driven engineering shifts the focus to engineering productivity in the context of team effectiveness and collaboration. Instead of just rewarding output, you should continuously optimize system performance and overall team health.
However, you need to align your development efforts with business outcomes. Research shows that you can see 40% higher organizational performance if you prioritize user impact than those who don’t.
You also have to be smart about your tools. For example, using a public cloud increases infrastructure flexibility by 22%, which correlates with a 30% increase in organizational performance.
Tracking key engineering metrics is how you can move beyond individual output and drive sustainable productivity while improving overall business impact. That brings us to the next point.
Let’s dive into why data-driven engineering isn’t just useful; it's a game-changer:
With KPIs and accurate models, you can stay strategic with business goals and stakeholder expectations. Instead of making calls based on intuition, you can point to real data.
Say your team wants to upgrade its engineering infrastructure. Rather than pitching it as a "needed improvement" to executives, you can use a predictive model to prove how it boosts system performance and reduces failure rate to secure their buy-in.
Data-driven engineering allows you to move beyond gut feelings and make decisions by using:
Example: Code repositories sometimes accumulate inefficiencies that slow down development. Guesswork won’t reveal these bottlenecks, but analyzing code churn (how often code is rewritten), review time (delays in approvals), and process metrics (like cycle time) can pinpoint friction points. For instance, high code churn in specific files may signal unclear requirements or poor code quality, while long review times can indicate overloaded reviewers or inefficient workflows.
Bottlenecks in coding, PR reviews, and deployment pipelines drag projects down. A data-centric approach cuts through this by exposing inefficiencies with process metrics focused on operational efficiency, like:
With these insights, you can tackle issues early to maintain low failure rates.
Without data, it’s common for your team to misallocate time, budget, or workforce on low-impact tasks. A data-driven approach addresses resource allocation by highlighting where your efforts deliver the most value.
For instance, if data shows your engineers spend excessive time on manual testing, shifting resources to automated testing frameworks can free them up for more complex problem-solving.
You can also use this Value Stream Mapping tool to identify bottlenecks and areas where automation—or other solutions—can make the most impact.
Developers thrive when they’re coding, not stuck in meetings or dealing with repetitive tasks that add zero value. With data-driven engineering, you can clear this clutter by automating low-impact work.
With features like cloud computing and AI techniques, your teams can spend less time on manual overhead, like reviewing logs, and more time solving real engineering problems.
According to McKinsey, software development has two main loops:
Maximizing inner loop time increases productivity and developer satisfaction. Investing in better tooling and automation for the outer loop helps developers focus on building products rather than tedious processes.
When it comes to data-driven engineering, there are a few metrics that really make a difference, including:
Waiting until something breaks isn’t a strategy. Traditional engineering relies on lagging indicators, like post-mortem incident reports, that highlight problems only after they happen.
Meanwhile, a data-driven approach focuses on leading metrics, which provide real-time feedback to prevent issues beforehand. Consider cycle time, deployment frequency, and flow efficiency: these foresee bottlenecks and risks instead of just analyzing past failures.
Frameworks like DORA and Flow bring in many valuable metrics for data-driven engineering, such as:
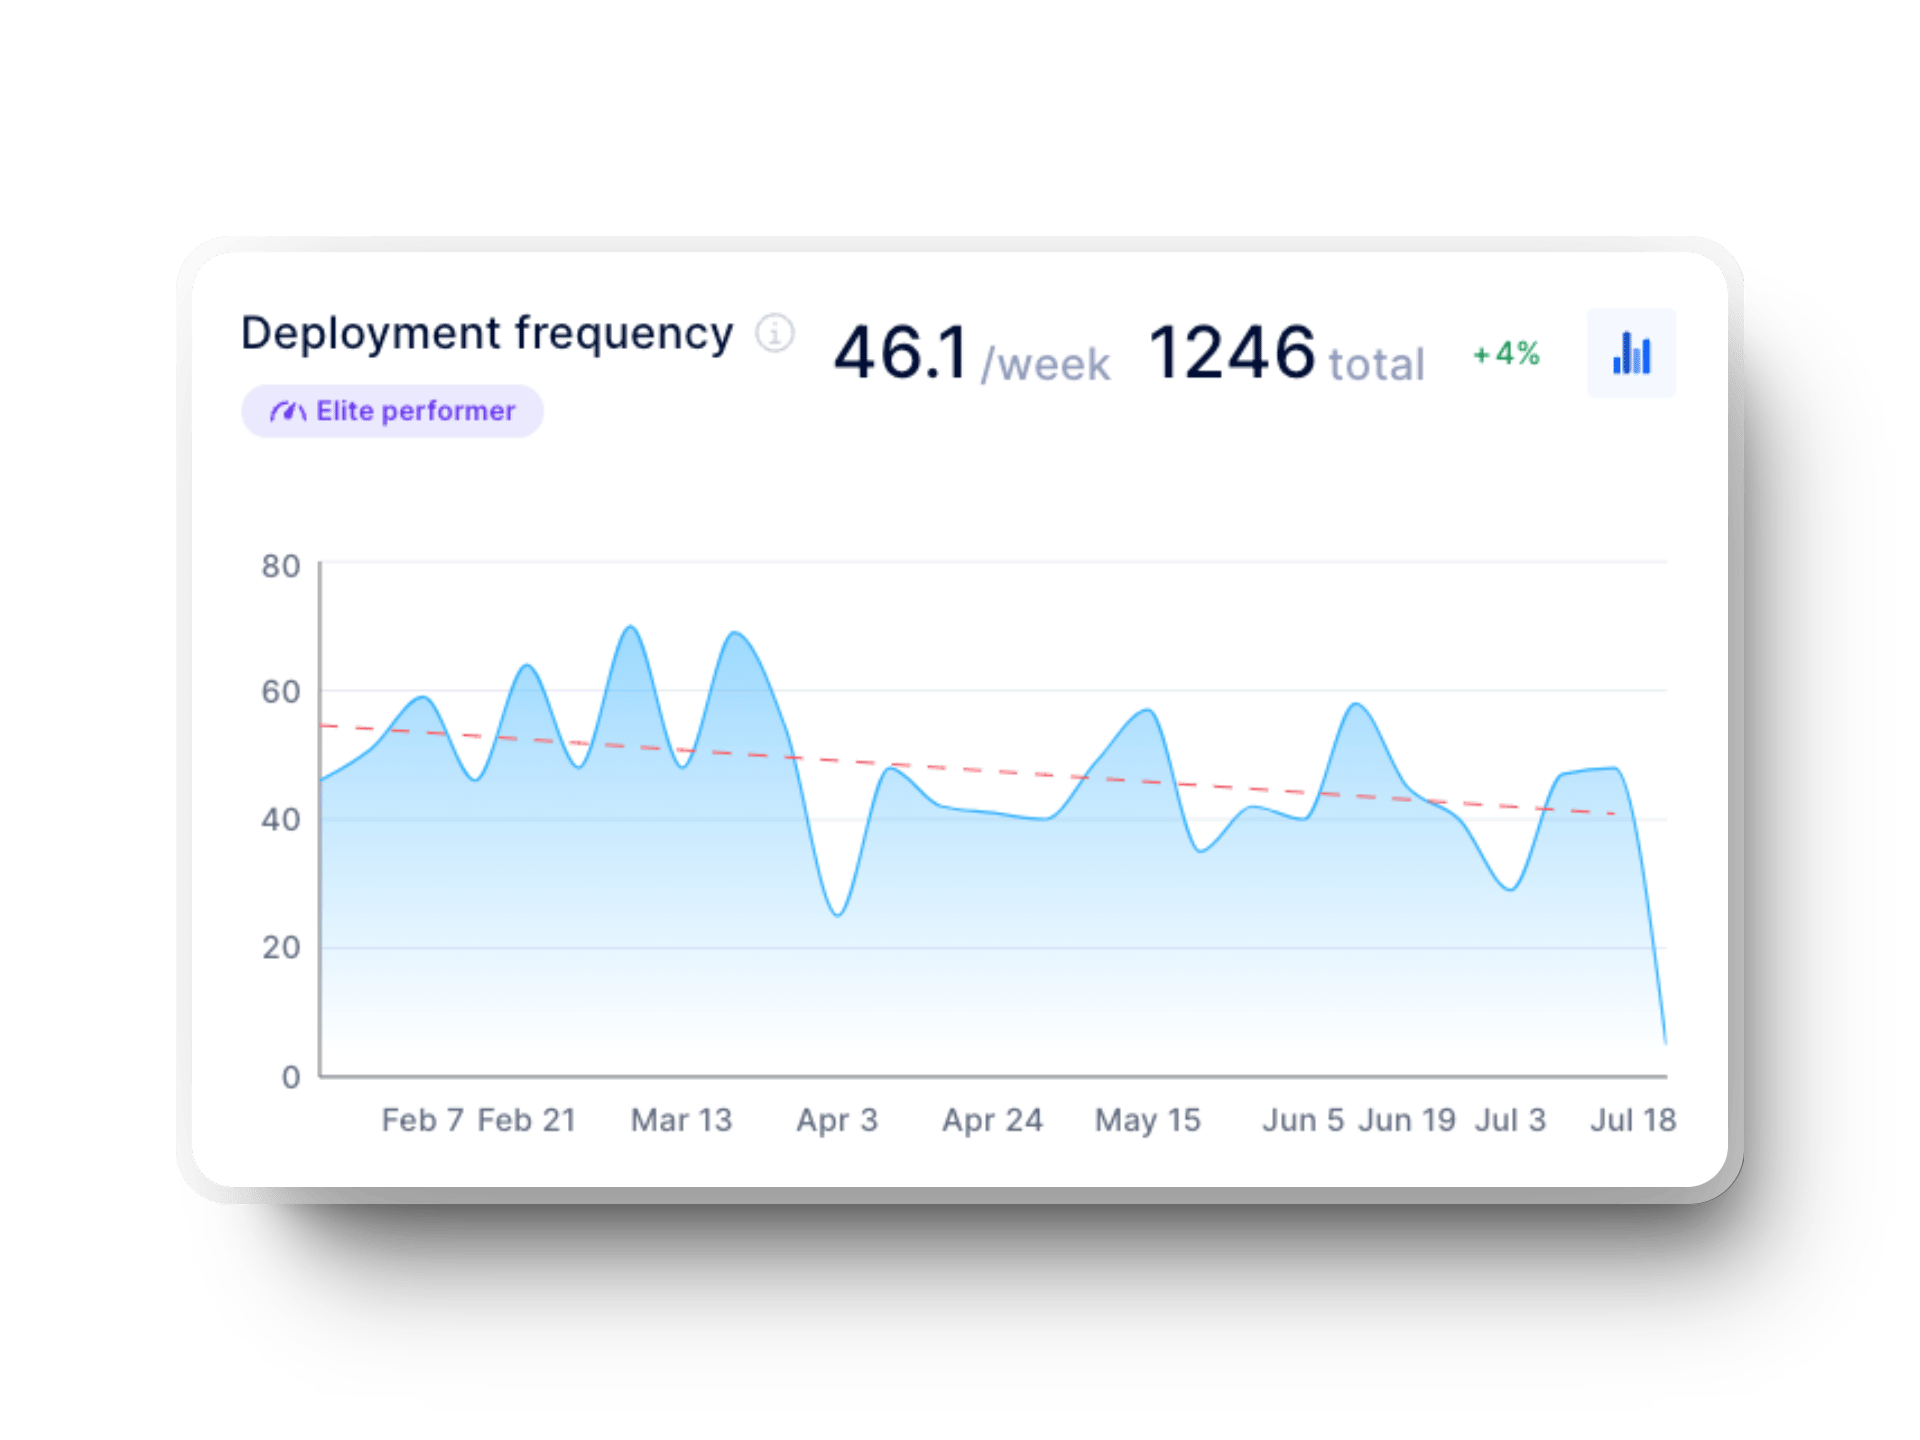
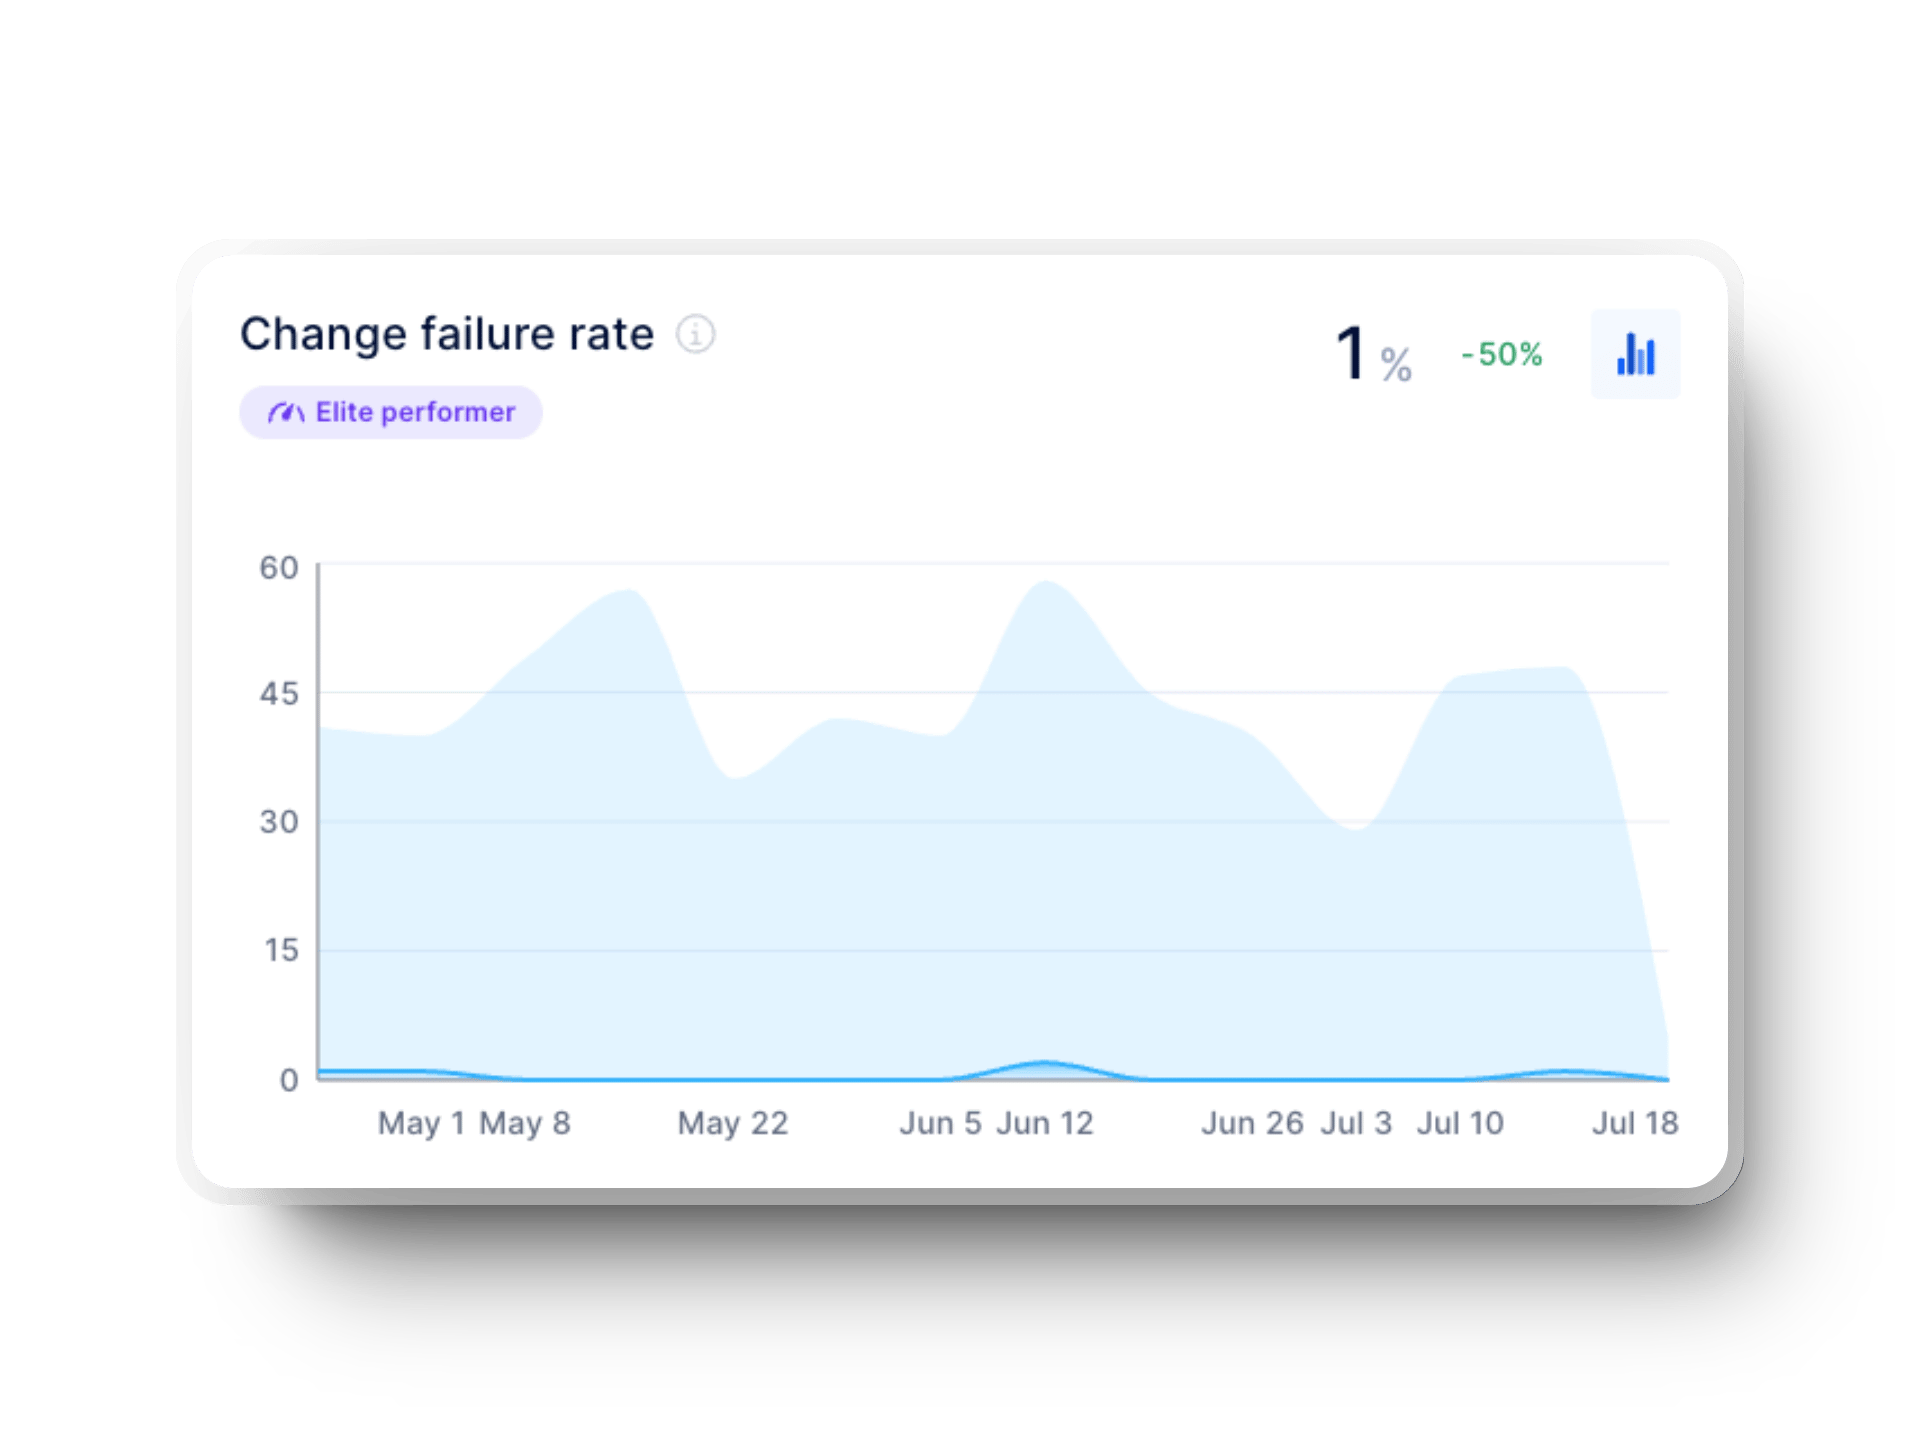
DORA (DevOps Research and Assessment) metrics help answer the question: "Is our deployment process efficient, or are we constantly firefighting?". They include:

%20in%20axify%20for%20software%20development%20teams.webp?width=1920&height=1440&name=time%20to%20restore%20service%20(dora%20metrics)%20in%20axify%20for%20software%20development%20teams.webp)

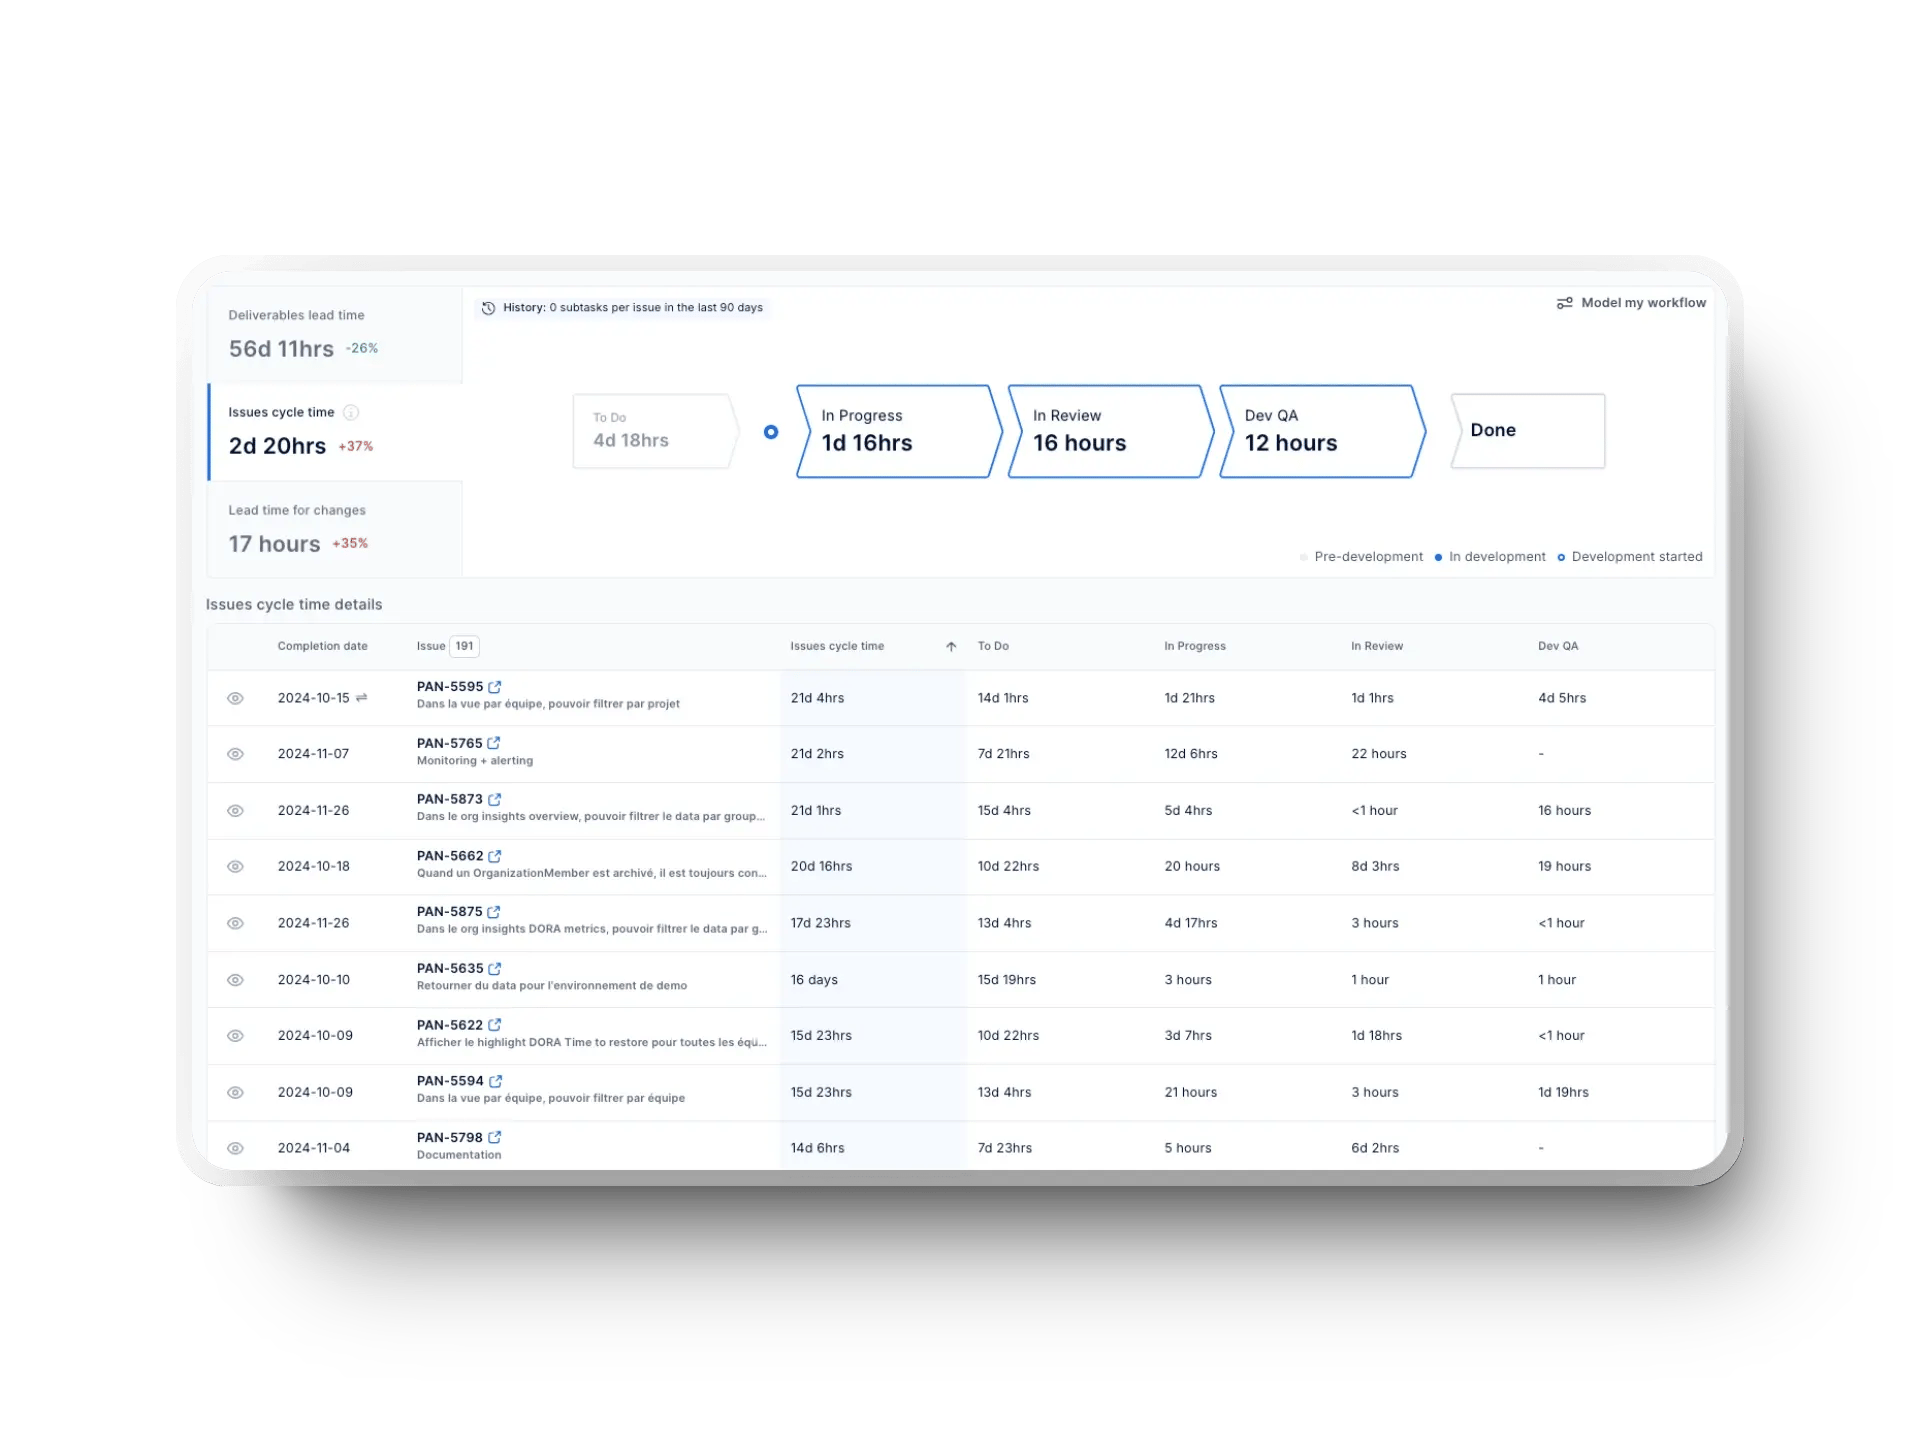
Flow metrics are value-driven and tell how smoothly work moves through the pipeline. If deployments are slow, these metrics help you figure out why:

%20in%20Axify.webp?width=1920&height=1440&name=work%20in%20progress%20(WIP)%20in%20Axify.webp)
While we’ve explored the key metrics to track for data-driven engineering, it's equally important to understand some common pitfalls to avoid, like:

One of the biggest traps in data-driven engineering is working on changes that don’t make a real impact. Let’s say your automated tests run in 20 hours, and you get it down to 18. If your whole release process still drags due to a 46-day bottleneck in code reviews or infrastructure provisioning, that two-hour gain won’t matter.
Simply put, your focus should be on improvements that deliver a clear return and truly accelerate your delivery cycle.
Metrics are only useful when they’re connected to your goals. Without that alignment, you risk pursuing the wrong priorities. For example, increasing deployment frequency might look like progress, but if those releases aren’t stable or don’t improve customer satisfaction, they’re not driving real value.
This means that every metric you track should guide efforts that directly align with your business objectives, whether improving reliability or enhancing user experience.
Axify helps you track objectives to measure your team's progress against corporate objectives.
![]()
Zeroing in on one metric leads to bad decisions. For instance, your team’s PR review time drops, and it feels like a win as the code is moving faster to deployment. But if quality suffers, those gains come with more bugs and regressions.
The solution? As the SPACE framework advises, step back and use multiple metrics across multiple dimensions. We advise you to avoid trade-offs and ensure progress in one area doesn’t cause setbacks elsewhere. In this specific example above, you can also track metrics like change failure rate and post-release issues.
Trying to optimize everything at once?
Tracking too many KPIs is a surefire way to slow your team down. It can lead to endless tweaking instead of actually shipping software. Take software delivery, for example; overhauling it overnight may look impressive, but it’s virtually impossible. Small changes done consistently add more value than doing everything at once.
The smarter approach is to focus on metrics that genuinely drive business value and let the others take a backseat.
When you rely on developer productivity metrics, such as PRs merged per week, to assess individuals, you create a fear-driven atmosphere instead of a growth-focused culture. For example, if developers know they’re being judged by the lines of code they write, they might produce bloated, inefficient code just to meet the target.
A better strategy is to shift the focus to team-wide trends and collaboration-driven metrics like DORA metrics, which give a big-picture view of engineering efficiency.
Relying on metrics alone can lead to assumptions that miss the real issues. For example, high cycle time might seem like slow work by your team, but the cause could be unclear requirements or outdated tools.
The right way is to combine qualitative feedback from engineers with quantitative insights to uncover true bottlenecks.
The correct approach to using engineering metrics involves these steps:
Data-driven engineering allows you to power your entire software development lifecycle with data and turn insights into action at every step. This is how:
Teams that rely on gut instinct for sprint planning often miss deadlines and have overloaded engineers. Instead, they should use historical throughput data and cycle time trends to estimate sprint capacity based on actual performance, not arbitrary targets.
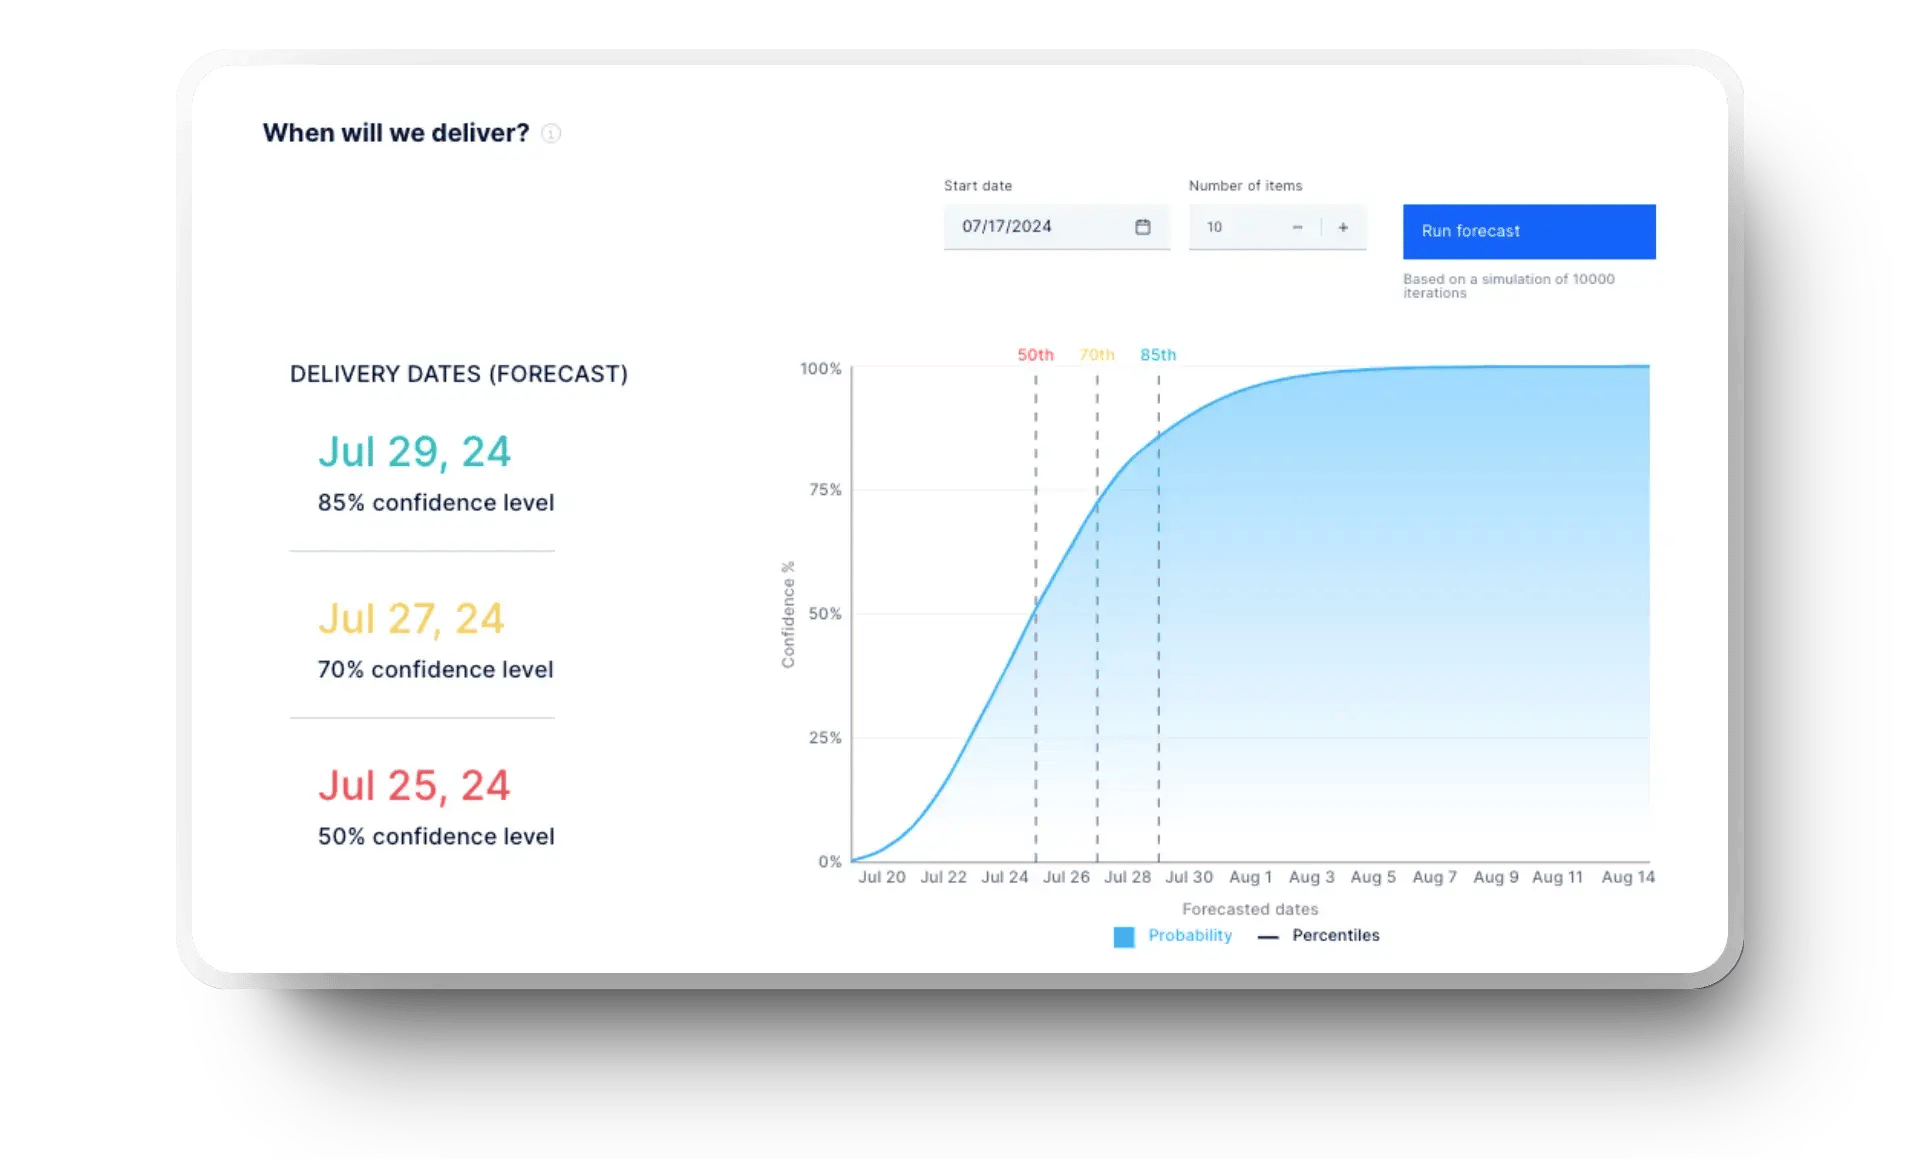
Insider tip: To streamline this, you can use tools like Axify’s software delivery forecasting, which leverages data and analysis of past trends to predict software delivery dates.
Furthermore, track task completion trends to prevent workload imbalances. And when planning features, prioritize customer feedback and recurring defect data. This way, you’ll ship features on time with higher impact and improved software quality while maintaining team well-being.
In the development phase, you can reduce rework by monitoring change failure rates and rework trends, which help spot high-risk features and stories early. For example, if a feature constantly rolls back, it’s a sign of missing tests or unstable dependencies. Identifying these issues sooner leads to fewer late-night fixes and smoother deployments.
Data-driven engineering also helps pinpoint bottlenecks in PR cycle time, which leads to better collaboration. If reviews keep stalling, chances are reviewers are overloaded, feedback is unclear, or the process is too slow. You can fix these gaps to achieve faster merges and minimize frustration for everyone.
Nothing slows down momentum like a dragging PR review process. When approvals take forever, it’s usually not just about the code; it’s unclear feedback or inefficient workflows that are getting in the way. You can track PR review time trends to spot what’s causing the holdup and fix it before it affects progress.
Then there’s the merge stage. If pull requests linger without getting merged, something’s off. It could be messy branching strategies, manual validation steps, or a lack of automation. Tracking merge times is the game-changer here, as it helps smooth out the process and keep updates flowing without compromising code quality.
Shipping code isn’t about getting it out the door; you must focus on delivering stable, high-quality updates without disruptions. Deployment frequency is a key metric for this as it can spot patterns in the release cycles, so updates go out consistently rather than in unpredictable bursts.
Assessing the lead time for changes is equally important. With this data-driven metric, you can quickly identify slowdowns in testing and approvals and fine-tune your CI/CD pipelines. Analyzing the change failure rate is also needed to identify weak points in validation or testing processes, which helps prevent unstable code from ever reaching production.
Gathering real-time incident data allows your teams to quickly detect issues and shorten recovery times after failed deployments. Moreover, tracking customer-reported bugs and performance regressions post-deployment provides valuable insight into customers' experiences. This lets you prioritize fixes that have the greatest impact on end-users.
Finally, looking at failed deployment trends over time allows you to identify recurring patterns. With this information, you can adjust release strategies, tighten validation processes, and ultimately ship more stable, high-quality updates.
Wondering how to build a data-driven engineering culture? We have some clear steps to help you get there:
Using a data-driven approach in engineering comes with some challenges, but don’t worry, we’ve got practical fixes to tackle them:
Adopting a data-driven culture in your software workflow? Axify offers a range of features to help:
Make data work for you. Begin your journey with Axify today by booking a demo!
