Software Development
9 minutes reading time

-1.webp?width=1200&name=Axify%20blogue%20header%20(6)-1.webp)
You’re running an engineering team, and you need to know what’s working and what’s slowing you down. Tracking the right software engineering KPIs helps you improve your team's performance, reduce failure rates, and make better decisions.
In this guide, you’ll learn exactly which KPIs matter and how to use them effectively. Let's get started!
Key performance indicators in engineering are measurable metrics that help you track your team’s efficiency, code quality, and overall progress. These metrics show where your development process is working and where it needs improvement.
Focusing on the right KPIs allows you to make smarter decisions that support your team, align with your business objectives, and drive continuous improvement in your engineering efforts.
Tracking the right KPIs in engineering helps you understand your team’s progress and make informed decisions about workflow improvements. These are the main types of KPIs you should focus on:
You track KPIs to measure team performance, improve quality, and align your efforts with broader business objectives using these meaningful insights.
Understanding why KPIs matter in software engineering helps you move beyond tracking output and focus on real impact.
Here’s how KPIs support your team:
Tracking the right KPIs helps you make better decisions, improve efficiency, and align development efforts with your business objectives. While many metrics are available, some provide more actionable value than others.
Here, we’ll focus on key KPIs that impact software development projects, product stability, and team productivity.
Deployment Frequency measures how frequently your team pushes code to a production environment. High frequency means faster feedback, lower risk per release, and a smoother software development lifecycle.
A high DF means teams ship small, iterative changes to reduce deployment risk and improve product quality. On the other hand, a low DF means larger releases become riskier, slow down time to market, and increase merge conflicts.
Here's how to improve your deployment frequency:
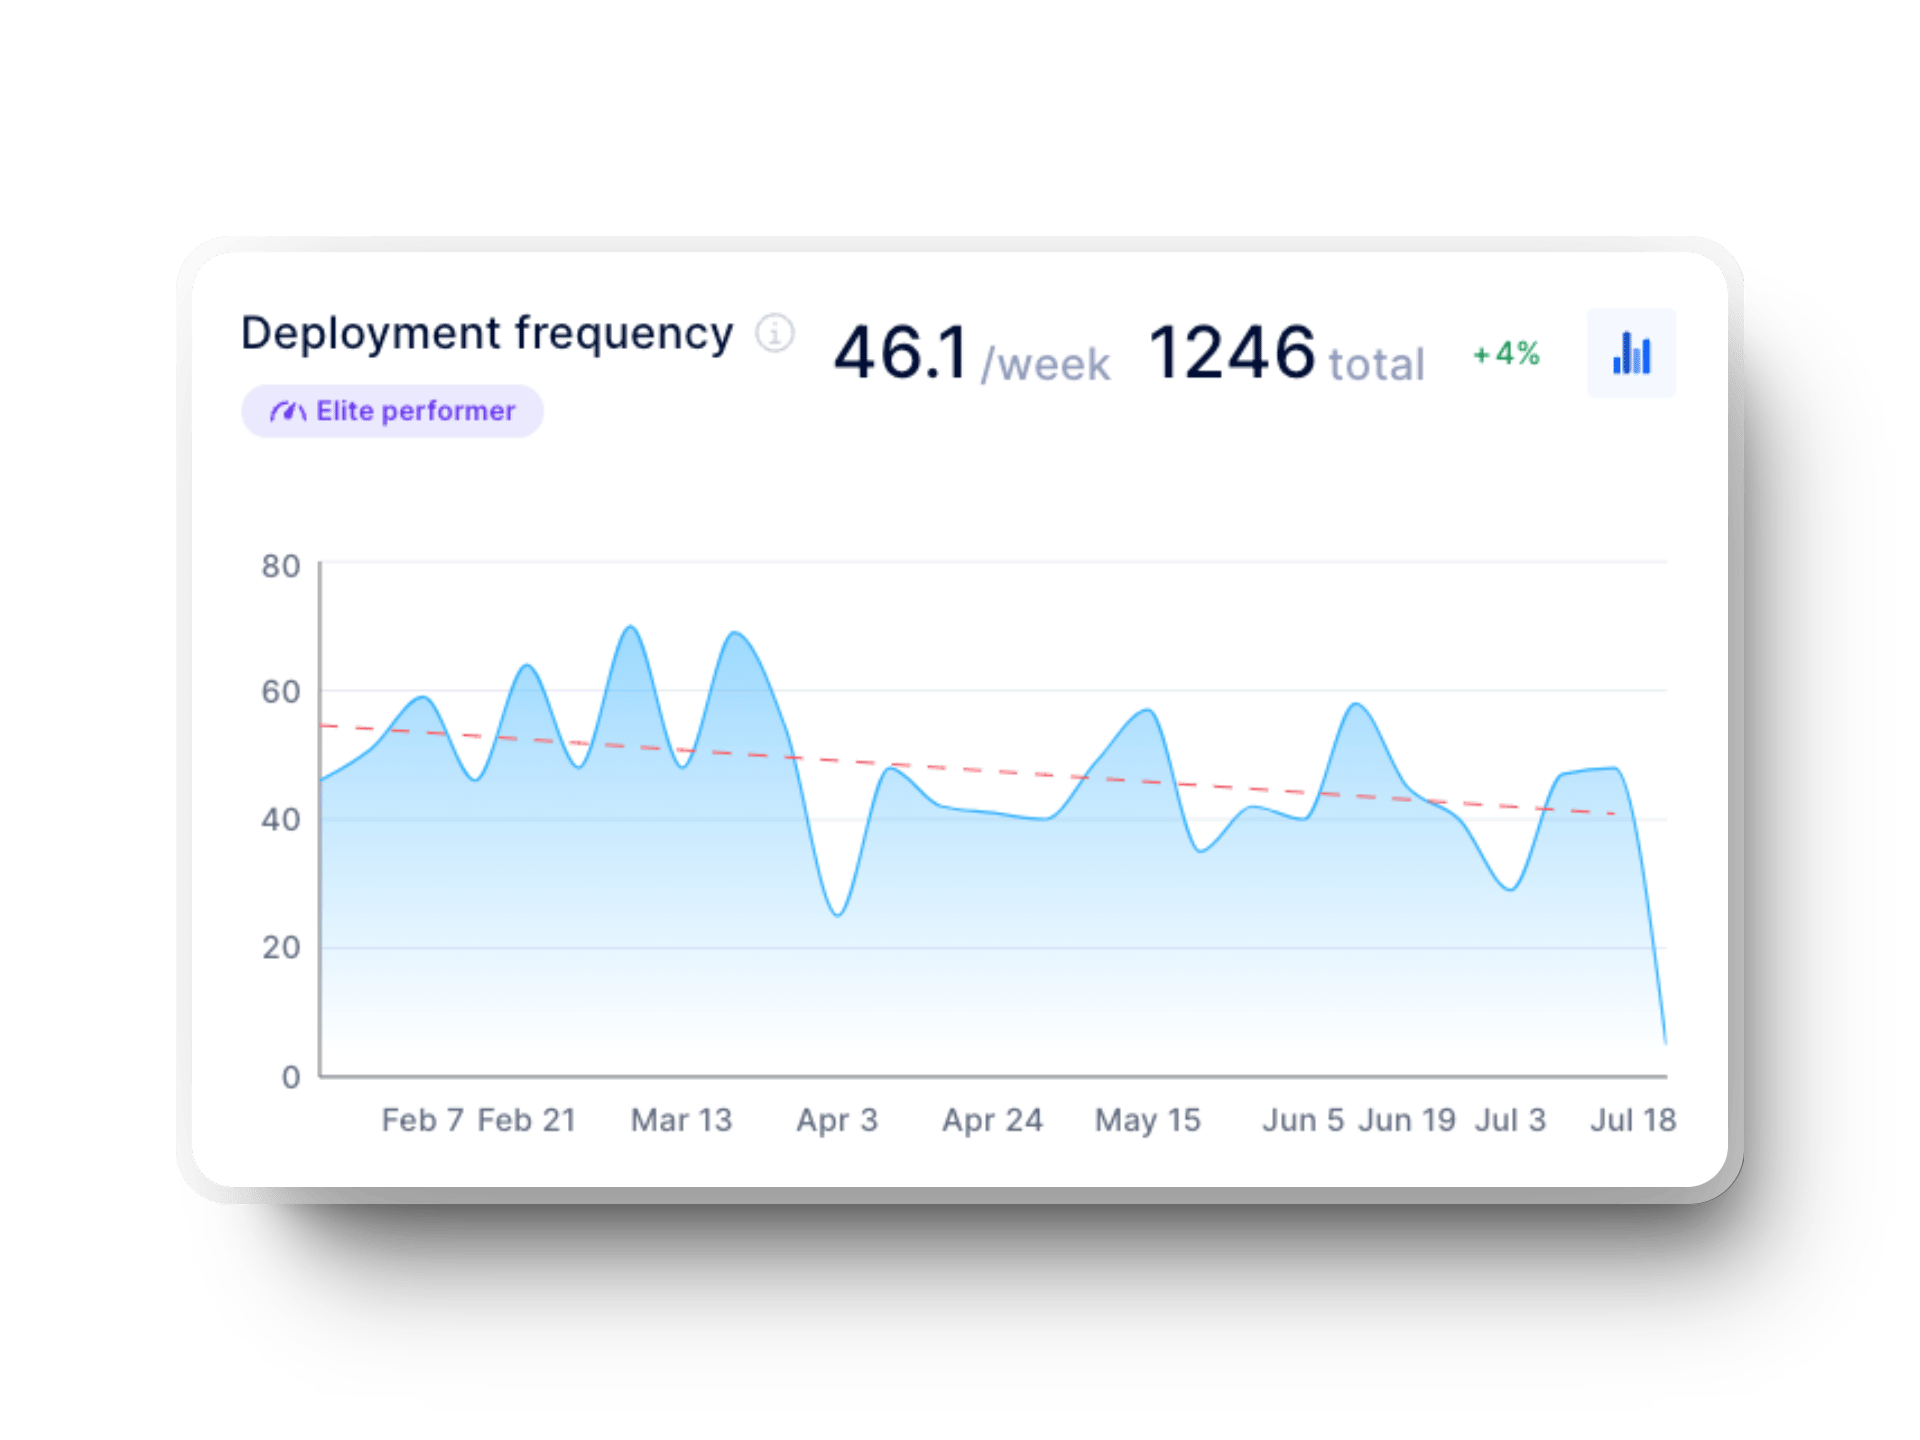
According to DORA research, high-performing teams deploy multiple times daily, while low-performing teams release less than once every six months. Axify helps you track deployment trends and spot areas for improvement.
Lead Time for Changes measures the time between a change commit and its deployment. It reflects how quickly your team solves changes and, thus, turns ideas into shipped features.
Low LTC means faster iteration cycles, quick bug fixes, and better responsiveness to customer needs. However, high LTC means long delays, slow innovation, and increased engineering costs.
Here's how you can improve lead time for changes:

DORA categorizes elite performers as having an LTC of under a day, while low performers take more time. Monitoring and improving this metric ensures a faster development cycle and more predictable releases.
Change Failure Rate measures the percentage of deployments that lead to failures needing rollback, patches, or fixes. It’s a critical metric that reflects the stability of your releases and the efficiency of your deployment process.
A low CFR means your team consistently delivers stable, high-quality updates without major issues. This means strong testing, well-managed deployments, and effective change management. A high CFR, however, signals potential weaknesses in testing, rushed releases, or complex deployments. This leads to more downtime, rework, and frustrated users.
Here's how to reduce your change failure rate:
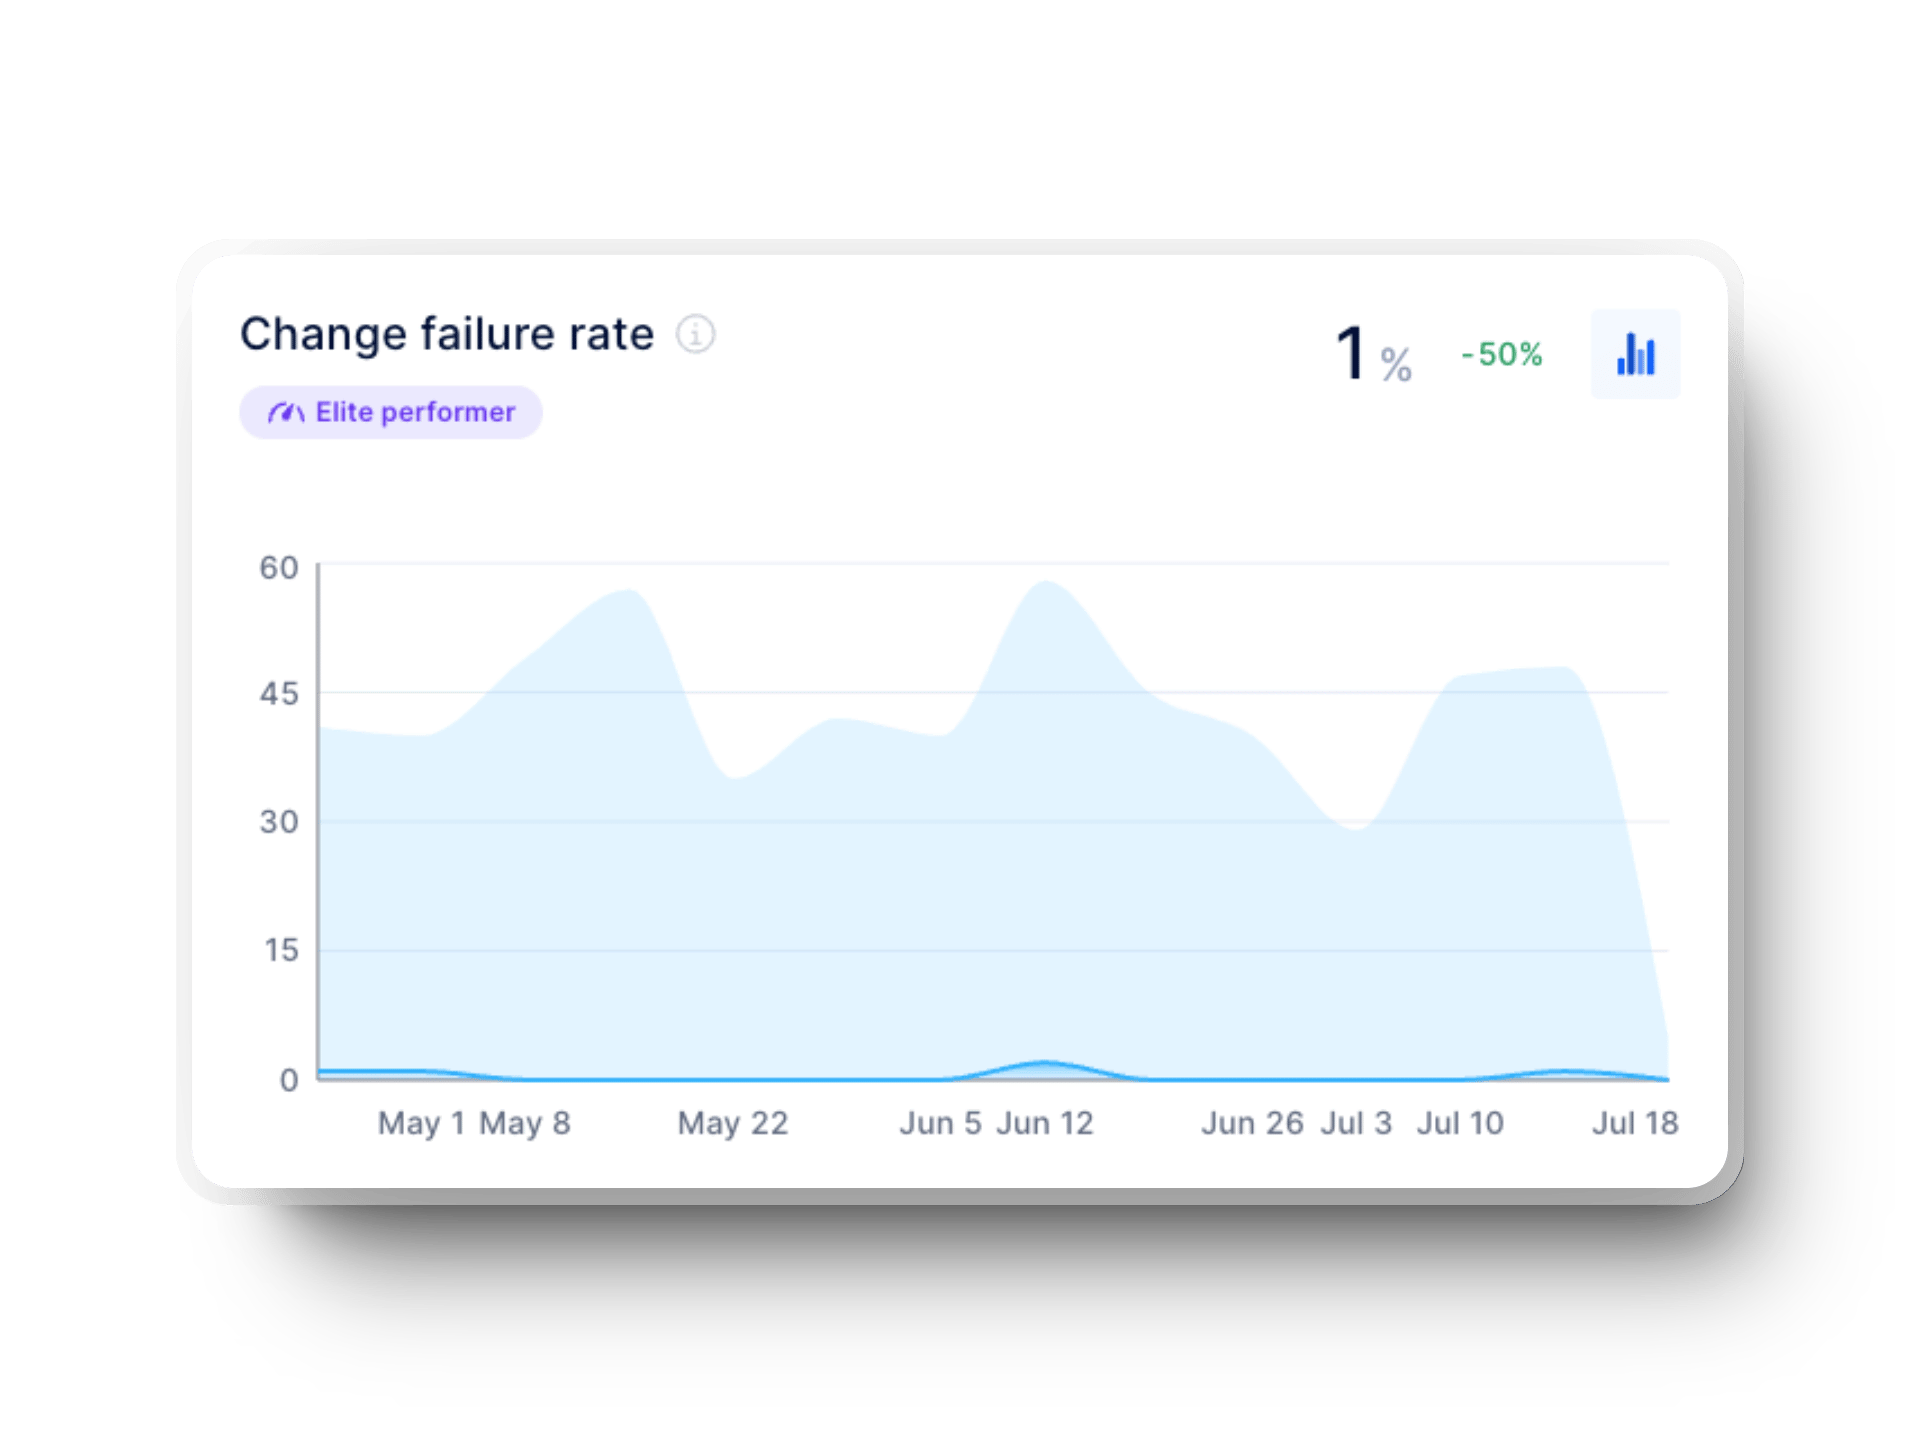
DORA categorizes elite performers with a CFR under 5%, while low performers struggle with rates around 40%. Keeping CFR low helps maintain user satisfaction, reduces firefighting, and ensures a smoother software development lifecycle.
Mean Time to Recovery (MTTR), now known as Failed Deployment Recovery Time, tracks how quickly your team can restore service after a failed deployment. It directly impacts your system's reliability, customer experience, and business continuity.
A short recovery time means your team has strong monitoring, well-documented response plans, and efficient rollback procedures. A long recovery time suggests bottlenecks in debugging, poor incident response strategies, or overly complex system dependencies.
Here's how you can improve MTTR:
Elite teams recover in under an hour, while low performers take a week or more. Faster recovery times lead to fewer disruptions, higher user satisfaction, and greater confidence in your engineering organization’s ability to deliver reliable software.
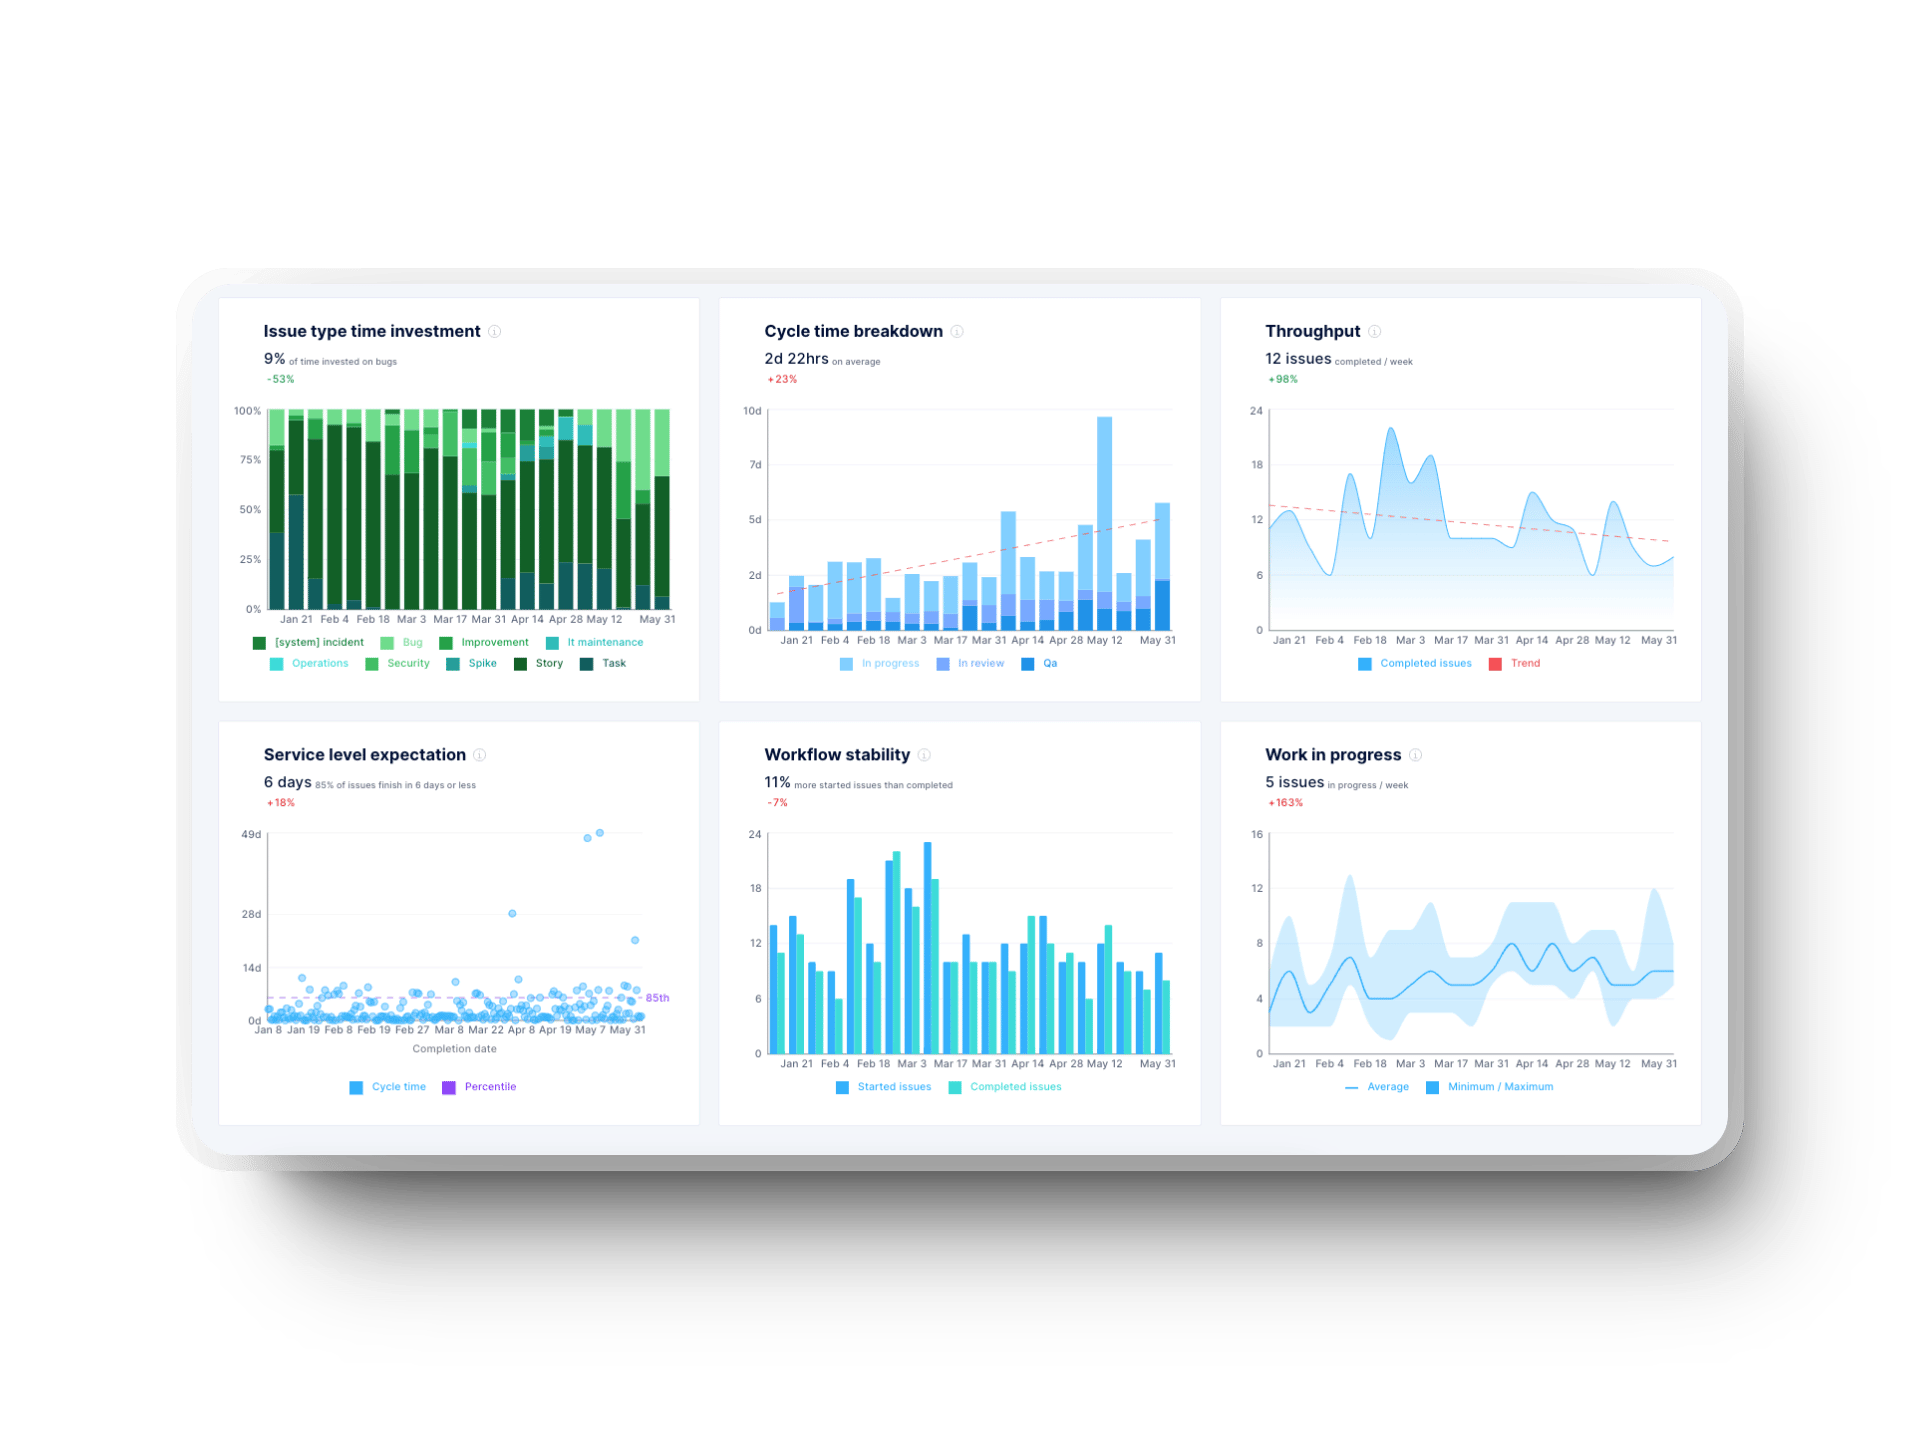
Throughput measures how many work items your team completes in a given period. It reflects the speed and efficiency of your development process. According to Little’s Law, throughput equals the ratio of work in progress to cycle time.
A high throughput suggests your team is rapidly deploying features, bug fixes, or improvements. This typically indicates strong collaboration, automation, and a well-structured workflow. A low throughput, on the other hand, points to inefficiencies, bottlenecks, or slow approval processes that prevent steady progress.
Here's how you can improve throughput:

As we said above, DORA’s benchmarks show high performers deploy multiple times per day, while low performers release updates less than once a month. Improving throughput ensures timely interventions and a steady flow of value to your users.
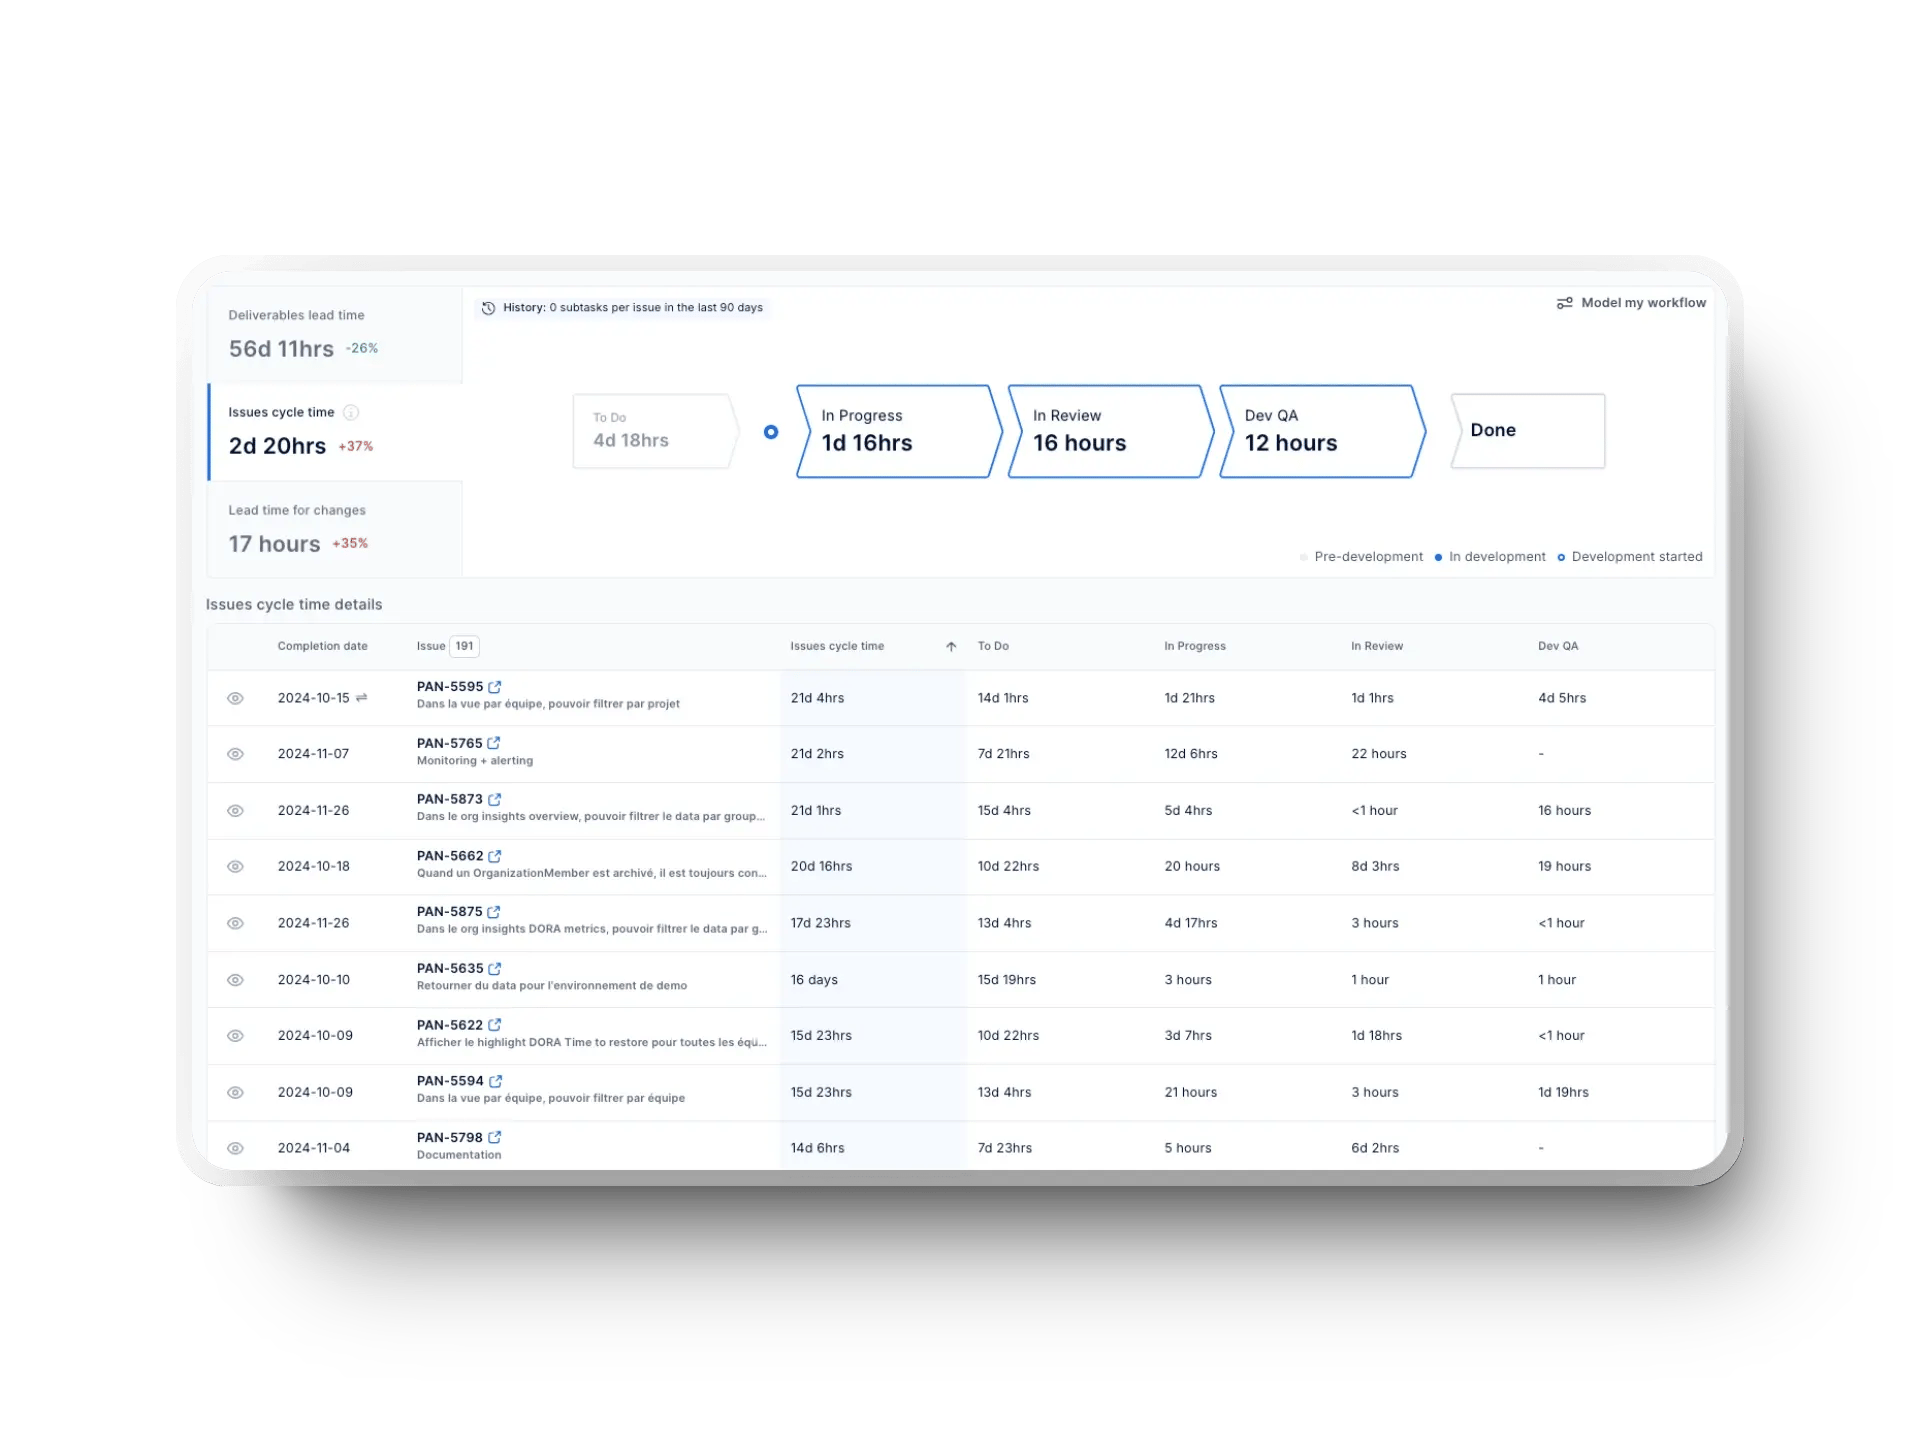
Cycle time tracks how long it takes to complete a task, from the moment work begins to deployment. It’s a crucial metric for measuring development speed and efficiency.
A short cycle time means your team moves quickly, resolves tasks, and ships updates without unnecessary delays. This improves responsiveness to customer needs and reduces costs.
However, a long cycle time signals bottlenecks such as slow reviews, excessive approvals, or resource constraints. These lead to project delays and reduced agility.
Here's how you can reduce cycle time:

One study places the median cycle time across organizations at 83 hours, with top performers completing tasks under 58 hours. We have a different perspective—analyze cycle time trends for your teams and ensure you’re not increasing them unjustifiably.
Monitoring and improving this metric (in the context of the other flow metrics) helps your team meet realistic goals and ship updates at a steady pace.
Flow efficiency measures how much of your total process time is spent on actual work. A low percentage means tasks spend too much time stuck in queues, while a high percentage means work flows smoothly through your pipeline.
Low flow efficiency suggests frequent bottlenecks, delays in approvals, or slow handoffs between teams. This can lead to missed deadlines and frustrated developers. High flow efficiency means your team keeps work moving with minimal delays, but pushing efficiency too high can overburden your team.
Here's how you can improve flow efficiency:
Some sources claim a healthy flow efficiency range is 15-40%, though elite teams go over 40%. We consider the percentage less important; what you need is a steady or rising trend. Tracking and improving this metric ensures your work moves predictably, helps you meet realistic goals, and keeps teams productive.
Work in progress tracks the number of active tasks your team handles at any given time. Keeping WIP under control ensures your work moves forward without overwhelming your developers.
A low WIP means your team focuses on a few tasks at a time, which leads to faster completions and better quality. However, a WIP that is too low can lead to idle time. A high WIP typically leads to context switching, slow progress, and bottlenecks that stretch out timelines.
Here's how you can manage WIP effectively:
%20in%20Axify.webp?width=1920&height=1440&name=work%20in%20progress%20(WIP)%20in%20Axify.webp)
A good rule of thumb is to set WIP limits to -/+ 1 of your team size. For example, a five-person team should aim for a WIP of 4-6 tasks. Keeping WIP in check helps you maintain a steady software project workflow and keeps your team efficient without burnout.
Issue Type Time Investment, aka flow distribution, measures how much time your team spends on different types of work, such as new features, bug fixes, and maintenance. Understanding this breakdown helps you balance innovation with stability.
Spending too much time on new features may indicate a strong focus on growth, but neglecting maintenance can lead to technical debt and performance issues. On the other hand, excessive time spent on keeping the lights on (KTLO) suggests that past development decisions might be causing ongoing problems and slowing down future projects.
Here's how you can improve your time investment:

Some sources claim that developers spend as little as 10% of their time coding, the rest going to meetings, building reports, gathering knowledge, administrative tasks, and more.
We’re not saying some tasks should be more important than others in your team. The point is to decide for yourself based on accurate data. Tracking this metric allows you to make data-driven decisions on where to allocate resources for better efficiency and developer satisfaction.
Velocity measures how fast your team completes work in a sprint. Tracking this helps you predict timelines, set realistic goals, and manage stakeholder expectations.
A consistent velocity means your team delivers at a steady pace, which makes planning more predictable. However, fluctuating velocity can signal overcommitment, unexpected roadblocks, or shifting priorities, making it harder to plan accurately.
Here's how you can improve velocity:
Velocity varies across dev teams depending on project complexity and team experience. Instead of comparing to industry benchmarks, you should track your own trends over time. A steady, predictable velocity is more valuable than a high but inconsistent one.
Code review time measures how long it takes to approve a pull request (PR) after submission. This includes the time reviewers take to provide feedback, request changes, and approve the PR. Keeping reviews quick but effective helps your team maintain momentum without sacrificing code quality.
Fast code reviews speed up development but can miss critical issues if rushed. On the other hand, long review times slow progress, frustrate developers, and increase context-switching.
Here's how you can improve your code review time:
-1.webp?width=1920&height=634&name=pull%20requests%20cycle%20time%20breakdown%20graph%20in%20axify%20%20(1)-1.webp)
Improving this metric leads to better resource utilization and faster releases.
PR Merge Time tracks how long a pull request stays open before merging into the main branch. The goal is to merge efficiently without compromising quality.
A fast merge time means quick approvals and frequent deployments, but merging too fast can lead to missed issues. A long merge time suggests bottlenecks such as overloaded reviewers, unclear priorities, or large PRs that take too long to review.
Here's how you can reduce PR merge time:
Reducing merge time improves day-to-day operations and keeps your team moving forward.
Data suggests the median pull request (PR) merges in 3.5 hours, but for the median developer, it takes 9 hours, likely due to prolific contributors merging faster and some PRs bypassing review. 37% of PRs merge within an hour, with 34% of those skipping reviews. Reviewed PRs take significantly longer—10 hours on average. The long tail skews the mean, with the average PR merging in 47 hours. More reviews naturally increase merge time.
This metric tracks how frequently work gets passed between people before completion. Too many handoffs slow development, introduce miscommunication, and increase potential failures due to lost context.
A high number of handoffs means tasks bounce between engineers, which leads to delays and inefficiencies. A low number of handoffs helps maintain continuity, reduces cycle time, and improves product quality.
Here's how you can minimize handoffs:
Research shows that with each handoff, 50% of knowledge is lost. By the second handoff, only 25% of the original context remains, and the risk of errors increases. Keeping handoffs to a minimum leads to smoother workflows and better organizational objectives.
Not all key performance indicators in engineering give you meaningful insights. Some metrics look helpful but don’t truly reflect productivity or software quality. Instead of focusing on quantifiable metrics that don’t drive real improvement, you should track KPIs that align with your strategic goals. Here are a few to avoid:
At Axify, we work closely with managers who sit in the middle of strategy and execution. You’re expected to ship consistently, unblock your team, and prove progress, all without micromanaging. That’s why you need to turn that data into actionable insights. That means putting KPIs in front of the right people at the right time and using them to fuel continuous delivery, not micromanagement.
Here’s how Engineering Managers and Tech Leads can make KPIs part of their workflow:
%20equivalent.webp?width=1920&height=1080&name=Axify%20CIO%20dashboard%20translating%20added%20velocity%20into%20full-time%20employee%20(FTE)%20equivalent.webp)
If you're overseeing multiple teams, your focus is bigger than individual sprints. You care about aligning tech strategy with the company’s direction. From what we’ve seen at Axify, the best engineering leaders use key performance indicators to:
You’re the bridge between product and engineering. From what we’ve seen at Axify, your job is 90% coordination and 10% chasing down updates you shouldn’t have to. KPIs help flip that ratio. KPIs help you coordinate without getting lost in the details. Here are the most practical ways product operations professionals can use engineering KPIs to improve coordination and delivery flow:
Your job depends on knowing what’s possible and when. Engineering KPIs give you a reality check and help you plan better. These are the key ways product managers can use engineering KPIs to plan more effectively and stay aligned with their teams:
Tracking key metrics is essential, but misusing them can hurt your team’s progress. You should avoid these common mistakes to make KPIs more effective:
Tracking performance KPIs shouldn’t feel like a guessing game. Axify’s engineering metrics dashboard offers a clear, real-time view of your team’s efficiency, delivery speed, trends, and potential bottlenecks—all in one place.
Here’s how you can use it to improve your software development process:
Axify helps engineering leaders make smarter decisions without the hassle of manual tracking. With integrations for GitHub, Jira, Slack, and more, your data stays updated automatically.
Tracking KPIs for engineering teams is easier when you have the right tools. Axify offers a complete set of features designed to give engineering managers a clear view of performance, bottlenecks, and progress toward organizational goals.
Here are some of the powerful tools available in Axify:
With Axify, you get real-time insights into your engineering processes: no more manual tracking or disconnected data.
Book a demo today and see how Axify can help your team streamline workflows, improve collaboration, and make data-driven decisions for better software delivery.


