DORA Metrics
16 minutes reading time


Updated for 2025: This guide now includes AI-related engineering metrics and the latest DORA benchmarks.
You're on the right page if you're looking for the best DORA metrics tools.
After we share our five-step framework, which includes metrics measurement, developer friendliness, integrations, and more, we'll analyze six top contenders.
Feel free to use it if you're doing your own shortlist.
Here's a sneak peek:
|
Tool |
Metrics measurement |
Developer friendliness |
Integrations |
Data reliability and performance |
Support and resources |
Average score |
|
Axify |
5 |
5 |
4.5 |
5 |
4.75 |
4.85 |
|
LinearB |
5 |
4 |
4 |
4 |
4.5 |
4.3 |
|
Swarmia |
5 |
4.5 |
4 |
4.5 |
4 |
4.4 |
|
Jellyfish |
5 |
4 |
3.5 |
4.7 |
3 |
4 |
|
Allstacks |
5 |
4 |
4.5 |
4.7 |
4 |
4.4 |
|
Sleuth |
5 |
4 |
4.5 |
4.5 |
4 |
4.4 |
Insider tip: Use Axify if you want a tool that combines DORA software metrics with unique features like Developer Productivity Measurement, VSM, and AI Performance Comparison. We offer actionable insights beyond standard metrics, improving your performance and team dynamics.

DevOps Research and Assessment (DORA) metrics are performance indicators for multidisciplinary teams (i.e., development and operations teams). You can use them to gain valuable insights into your software development lifecycle.
Following DORA metrics allows engineering teams, software leaders, and other stakeholders to make data-driven decisions based on team performance. The end goal, of course, is to improve operational efficiency and, as a result, customer retention and satisfaction.
Insider tip: At Axify, we advise our customers to consider operational efficiency in the context of team dynamics. Use the metrics below not to place blame but to find actionable insights that help the entire team.
![]()
Deployment frequency measures the number of times a team successfully releases to production over a given period. Frequent deployments indicate a smooth and efficient deployment process, which can lead to faster feedback and improvement cycles.
Pro tip: One key advantage is that our tool detects deployments from multiple sources. This way, you get comprehensive tracking even if teams ship through different tools or workflows.

Lead time for changes measures the period it takes for a committed code change to reach production. Shorter lead times indicate a more efficient development process because teams respond quickly to changes and feedback. That improves user and developer experience.

Change failure rate measures the percentage of deployments causing failures in production requiring remediation (e.g., hotfix, rollback, patch). This metric shows whether you have good code quality and a reliable deployment process. Also, a lower change failure rate suggests better code and processes, which lead to higher customer satisfaction.
Pro tip: Axify can help you there because it associates an incident with its last deployment.

This metric measures the time it takes for a team to recover from a production failure and restore service to users. It helps you understand the effectiveness of incident management and response workflows. Faster recovery times are better because they enhance operational performance and minimize customer impact.
%20in%20axify%20for%20software%20development%20teams.webp?width=851&height=638&name=time%20to%20restore%20service%20(dora%20metrics)%20in%20axify%20for%20software%20development%20teams.webp)
As you can see, all the metrics above have their own measurement challenges. Getting an accurate read on your current situation can be difficult because of factors like inconsistent data, variability in how metrics are defined across teams, or gaps in your toolchain integration. These challenges can lead to incomplete insights and skewed results, making it harder to drive meaningful improvements.
You must select the right tool to build a comprehensive DORA metrics dashboard and avoid these mistakes.
From our experience at Axify, we encourage you to consider the following criteria to make an informed choice.
Pro tip: We’ll show you how we use these criteria in the next section, where we analyze 13 top DORA software metrics tools.
A good tool should cover all essential metrics and provide actionable insights to accurately measure your team's DevOps performance. Here are some questions to help assess a tool's metrics measurement capabilities:
A developer-friendly tool ensures your team adopts and uses it effectively. Consider the following questions:
The tool should offer flexible integrations to fit seamlessly into your existing workflows. Here are some questions to consider:
Consider how reliable the tool is for syncing data and performance. Here are key questions to evaluate.
Reliable support and a tight user community can significantly impact your experience with the tool. Here's what to look for:
Remember: Asking the right questions lets you choose a DORA metrics tool that supports your team’s goals, enhances your development process, and ultimately contributes to delivering high-quality software. At Axify, we advise our clients to prioritize tools that align with their specific needs and foster a culture of continuous improvement.
AI and automation add a new layer to how you understand engineering performance. These tools change how code is written, reviewed, and shipped, so you need metrics that capture this impact instead of relying only on traditional signals. They help you see how AI affects speed, quality, and everyday developer work.
Here are the key questions to guide your evaluation:
These signals help you understand whether AI is actually improving your development process or creating hidden risks.
If you want a ready-made system for tracking DORA metrics, grab the checklist below. It gives you a clear, structured way to measure deployments, lead time, failure rates, and recovery times without missing key steps.
Let's jump into the part you're here for.
Axify is a powerful platform designed to provide teams with a comprehensive view of their software development process. Axify helps engineering teams enhance their performance and deliver reliable software efficiently by tracking key metrics – from DORA to resource allocation and team morale.
Axify is an intuitive tool for different roles: engineering leaders and managers, product managers, and product operations professionals.
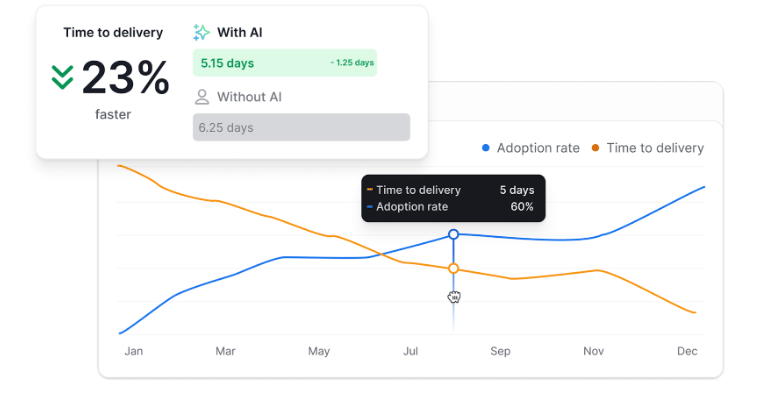
Insider tip: Leverage our unique team maturity assessment to get actionable recommendations to improve your software delivery performance. Elite performers with high DORA maturity are twice as likely to beat profitability, market share, and productivity targets. They also grew their market cap 50% faster in just three years.
Key Features
What Makes Axify Different
Axify shows a holistic view of DORA and a complete Value Stream Management (VSM) perspective, with visibility into flow metrics, bottlenecks, and overall delivery performance. It can also accommodate different teams, making it a versatile choice for organizations looking to optimize their software delivery process.
|
Criterion |
Rating |
|
Metrics measurement |
5 |
|
Developer friendliness |
5 |
|
Integrations |
4.5 |
|
Data reliability and performance |
5 |
|
Support and resources |
4.75 |
|
Total |
4.85 |
LinearB centers on workflow automation and team-level metrics. The platform maps how work moves through the delivery pipeline and applies programmable rules to routine steps such as pull-request reviews, branch workflows, and handoff stages.
It reports DORA metrics within this broader workflow view. This gives teams a snapshot of cycle time patterns and delivery pacing without generating individual-level performance metrics.
LinearB also includes tools for resource allocation and project forecasting. These features estimate workload distribution and predict release timing based on historical activity.
Also, automation components like WorkerB and gitStream apply policy-as-code controls to standardize reviews and reduce delays in merge processes.
Pros:
Cons:
Pricing: Starts at $19 per contributor per month.
|
Criterion |
Rating |
|
Metrics measurement |
5 |
|
Developer friendliness |
4 |
|
Integrations |
4 |
|
Data reliability and performance |
4 |
|
Support and resources |
4.5 |
|
Total |
4.3 |
Swarmia works as a work-management layer that connects engineering activity with business goals. The platform focuses on task prioritization, flow visibility, and team-level insights. It reports DORA and SPACE metrics and combines these with developer feedback to create a broad view of daily work patterns.
Axify offers similar capabilities with its Executive Dashboard.
This can help leadership measure the ROI of engineering efforts while maintaining a holistic view of the entire value stream.
But Axify goes a step further because it provides tools for the whole team so that everyone, from software engineers to product managers and CTOs, can access valuable, actionable insights.
Pros:
Cons:
Pricing: Free for companies that have up to nine developers.
|
Criterion |
Rating |
|
Metrics measurement |
5 |
|
Developer friendliness |
4.5 |
|
Integrations |
4 |
|
Data reliability and performance |
4.5 |
|
Support and resources |
4 |
|
Total |
4.4 |
Jellyfish gives engineering leadership a central view of how teams spend their time and how that work maps to organizational priorities. The platform aggregates activity data from tools like GitHub, Jira, and communication systems.
Then it structures that data into work categories, resource breakdowns, and delivery forecasts. Its focus remains on strategic oversight rather than day-to-day development work.
Jellyfish includes scenario-planning features that model different delivery timelines based on current staffing, historical performance, and project scope. It also focuses on resource allocation by showing how engineering hours are distributed across initiatives, teams, or product areas.
Pros:
Cons:
Pricing: Custom quote.
|
Criterion |
Rating |
|
Metrics measurement |
5 |
|
Developer friendliness |
4 |
|
Integrations |
3.5 |
|
Data reliability and performance |
4.7 |
|
Support and resources |
3 |
|
Total |
4 |
Allstacks focuses on predictive forecasting and risk assessment in software delivery. It aggregates data from engineering and project-management tools and uses historical patterns to generate delivery estimates, identify risk areas, and map project health.
The platform's dashboards include a broad range of selectable metrics, which can create noise for teams that prefer a narrower, more streamlined view.
Meanwhile, Axify focuses on delivering only the most relevant metrics and removes dashboard clutter by connecting engineering performance directly to business outcomes.
Pros:
Cons:
Pricing: $400 per contributor per year.
|
Criterion |
Rating |
|
Metrics measurement |
5 |
|
Developer friendliness |
4 |
|
Integrations |
3.5 |
|
Data reliability and performance |
4.7 |
|
Support and resources |
4 |
|
Total |
4.4 |
Sleuth concentrates on deployment tracking and impact-based insights.
The platform centers its measurement model on deploy events rather than relying mainly on ticket updates or git activity. It then connects those deploys to issues, builds, and repository data to show what was shipped and how it affects the system.
Sleuth also reports the four DORA metrics and presents them in a delivery-focused view.
Sleuth includes several components that shape how teams observe deployments:
These automations standardize parts of the release process and reduce manual repetition.
Sleuth also includes review templates, AI-generated summaries for each metric, and fields for adding notes, review points, and action items directly within the dashboard.
Pros:
Cons:
Pricing: $35 per user per month.
|
Criterion |
Rating |
|
Metrics measurement |
5 |
|
Developer friendliness |
4 |
|
Integrations |
4.5 |
|
Data reliability and performance |
4.5 |
|
Support and resources |
4 |
|
Total |
4.4 |
Cortex is an Internal Developer Portal that centralizes service data, engineering standards, and operational information. It brings multiple systems into one interface so teams can view ownership details, production requirements, and real-time service status without relying on separate tools.
The platform aims to streamline daily engineering workflows rather than operate as a traditional DORA-only solution.
Cortex also includes components for:
Pros:
Cons:
Pricing: Custom quote.
|
Criterion |
Rating |
|
Metrics measurement |
4.5 |
|
Developer friendliness |
3.8 |
|
Integrations |
4.0 |
|
Data reliability and performance |
4.2 |
|
Support and resources |
3.9 |
|
Total |
4.08 |
CTO.ai operates as a DevOps-as-a-Service platform built around event-driven workflows, containerized automation, and communication-based deployment triggers. Its goal is to streamline delivery without requiring teams to build or maintain a large internal platform.
The system uses a low-code model that blends ChatOps, GitOps, and Infrastructure as Code. This creates workflows that run through containers, CLI tools, and messaging channels like Slack.
CTO.ai includes several components centered on day-to-day development activity. Developers can generate instant preview environments for pull requests through containerized workflows.
Also, deployment triggers can be executed directly from Slack, which ties release steps to everyday communication tools. CTO.ai supports container-based command-line tasks that teams can incorporate into local or automated workflows.
Pros:
Cons:
Pricing: Starts at $3,500 per month, billed annually.
|
Criterion |
Rating |
|
Metrics measurement |
4.0 |
|
Developer friendliness |
4.3 |
|
Integrations |
3.7 |
|
Data reliability and performance |
3.9 |
|
Support and resources |
4.1 |
|
Total |
4.0 |
Jira is a long-standing work-tracking system created by Atlassian. It began as an issue and bug tracker for software teams and later expanded into a broader project-management environment through plugins, templates, and marketplace add-ons
Despite this expansion, its core structure still reflects its origins, which is why it remains centered on tasks, issues, stories, and epics rather than higher-level delivery metrics. The platform organizes work through boards, lists, timelines, and custom workflows that accommodate a wide range of team structures.
It is used across both small and large organizations for task planning and cross-team coordination. Jira’s roadmap features, dependency mapping, and collaborative editing tools give teams a structured way to map out project stages and keep track of related tasks.
Pros:
Cons:
Pricing: Free tier available for up to 10 users.
|
Criterion |
Rating |
|
Metrics measurement |
3.9 |
|
Developer friendliness |
3.7 |
|
Integrations |
4.5 |
|
Data reliability and performance |
4.2 |
|
Support and resources |
4.0 |
|
Total |
4.06 |
GitLab operates as an all-in-one DevSecOps platform that combines source control, CI/CD, security testing, and deployment management in a single system. It aims to reduce toolchain fragmentation by centralizing development, security, and delivery workflows.
The platform also incorporates AI features through GitLab Duo, which provides code suggestions, pipeline guidance, and lifecycle-level automation. GitLab includes several components built around secure software delivery.
Integrated security scanning runs during CI/CD and cloud-agnostic deployment options allow teams to deploy to various providers without being tied to one environment.
Pros:
Cons:
Pricing: Free tier for individuals, with pricing starting at $29 per user per month.
|
Criterion |
Rating |
|
Metrics measurement |
4.5 |
|
Developer friendliness |
4.2 |
|
Integrations |
4.3 |
|
Data reliability and performance |
4.0 |
|
Support and resources |
3.8 |
|
Total |
4.16 |
Datadog is an observability and security platform that collects data from applications, infrastructure, logs, and network components. It centralizes these signals into one environment so teams can review performance, trace issues across services, and monitor system behavior in real time.
The platform supports a wide range of integrations across cloud providers, databases, containers, and third-party services.
Datadog includes components such as:
These functions operate across the platform’s broader monitoring stack, which brings together logs, metrics, traces, and security events.
Pros:
Cons:
Pricing: Starts at $15 per host per month.
|
Criterion |
Rating |
|
Metrics measurement |
4.2 |
|
Developer friendliness |
3.6 |
|
Integrations |
4.4 |
|
Data reliability and performance |
4.1 |
|
Support and resources |
3.9 |
|
Total |
4.04 |
Typo is a software engineering intelligence platform that unifies data from the software development lifecycle. Then it applies AI to identify workflow issues, code-quality risks, and delivery patterns.
Here’s how it works. Typo:
The platform includes predictive analytics to flag upcoming delays, as well as conversational check-ins that record developer sentiment and health trends.
Typo’s features revolve around:
Pros:
Cons:
Pricing: Free tier available for up to 5 contributors.
|
Criterion |
Rating |
|
Metrics measurement |
3.8 |
|
Developer friendliness |
4.1 |
|
Integrations |
3.7 |
|
Data reliability and performance |
3.9 |
|
Support and resources |
4.0 |
|
Total |
3.9 |
Faros AI is an engineering intelligence platform that aggregates data from SDLC tools, HR systems, financial sources, surveys, and internal workflows. Its goal is to create a unified operational view for organizations managing complex engineering environments.
The platform applies AI to analyze delivery patterns, operational signals, and workflow structures across teams.
Faros AI includes engineering benchmarking based on anonymized industry data, decision-support recommendations generated from real-time operational inputs, and lifecycle health monitoring that spans tools and repositories.
These components operate through a flexible ingestion layer that connects to many different data sources without requiring teams to significantly change their workflows.
Pros:
Cons:
Pricing: Custom quote.
|
Criterion |
Rating |
|
Metrics measurement |
4.1 |
|
Developer friendliness |
3.7 |
|
Integrations |
4.2 |
|
Data reliability and performance |
4.0 |
|
Support and resources |
3.8 |
|
Total |
3.96 |
You track DORA metrics for a reason, but the process can feel messy when the data isn’t clear or consistent. That confusion grows once different tools and workflows get involved. So, here are the main challenges you should keep in mind:
Improving your DORA metrics starts with strengthening your delivery pipeline: make it observable end-to-end, reduce friction in each stage, and create faster, safer recovery paths. Each metric points to a different part of that flow, so you need a clear plan for each one.
Here are the core areas that shape strong averages and the steps you can take to reach them.
You deploy more frequently when your process is lightweight and repeatable. And this connects directly to what high-performing teams already show.
According to the 2025 State of AI-assisted Software Development report, 16.2% of elite teams deploy on demand, and 22.7% deploy once per hour to once per day. These numbers show how fast delivery becomes when the pipeline is clean.
How to improve deployment frequency:
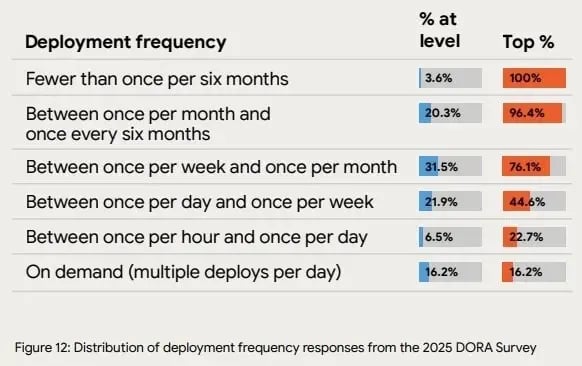
Image Source: 2025 State of AI-assisted Software Development report
Short lead time comes from steady flow. You reach that flow when code moves from idea to production without long waits between steps. And this aligns with what elite teams already do.
The 2025 State of AI-assisted Software Development report notes that 24.4% of top teams ship in under a day and 9.4% ship in under an hour. These numbers show how much speed depends on low friction in the handoff process.
How to improve lead time:
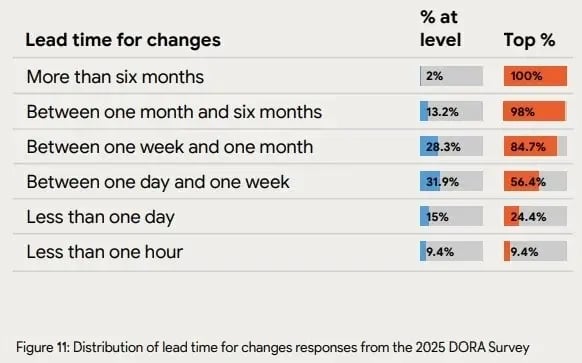
Image Source: 2025 State of AI-assisted Software Development report
A lower change failure rate comes from steady testing and simple releases. And this is clear in the industry data.
The 2025 State of AI-assisted Software Development report shows elite teams holding 8.5% of changes in the 0-2% failure band and 16.7% in the 2-4% band. These numbers show how stable releases get when issues surface early.
How to improve your change failure rate:
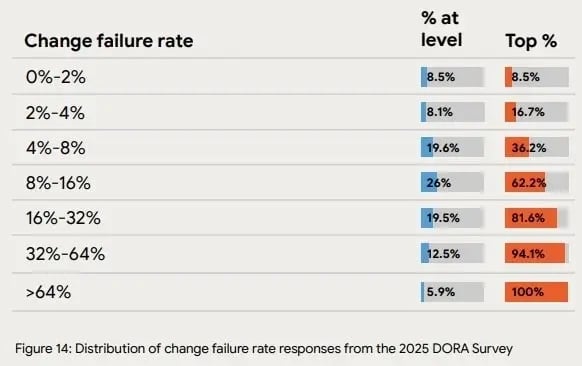
Image Source: 2025 State of AI-assisted Software Development report
Fast recovery is the result of strong observability and easy rollback paths. And the 2025 State of AI-assisted Software Development report shows 21.3% recovering in under an hour and 56.5% recovering in under a day. These numbers show how good visibility and simple rollback steps reduce downtime.
How to improve recovery time:
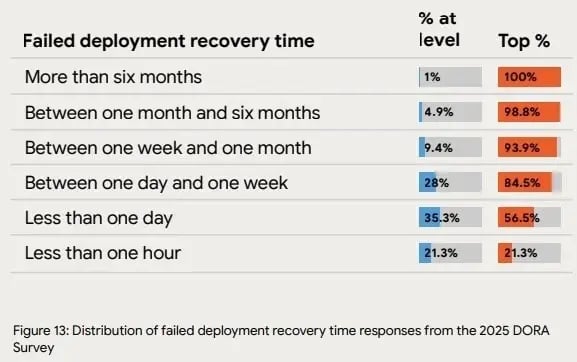
Image Source: 2025 State of AI-assisted Software Development report
If you've read this far, you know the best DORA metrics tools. Each platform has its pros and cons, though, so choose wisely.
Of course, DORA metrics aren't the only metrics that count.
Your team may also need to follow Agile metrics, like daily sprints, or you may want to track team morale.
In that case, Axify offers solutions for different teams and stakeholders.
If you're a CIO, use Axify's new executive dashboard to gain a high-level view of engineering performance and make informed decisions to drive strategic improvements. If you're a software project manager, Axify is excellent for monitoring real-time project progress and team health. That's how you can maintain both product delivery and team wellbeing.
While DORA metrics provide critical insights into your team's DevOps performance, you need to integrate them with other key performance indicators and holistic metrics.
That's the best way to better understand your team's effectiveness and health and to work toward your business goals.
Book a virtual tour today and see how Axify can help.
